11email: smengel@eso.org
Medium resolution 2.3m spectroscopy of the massive Galactic open cluster Westerlund 1††thanks: Based on observations collected at the European Southern Observatory, Chile, under program number 076.D-0680(A)
The Galactic open cluster Westerlund 1 was found only a few years ago to be much more massive than previously thought, with evidence suggesting its mass to be in excess of 105 M⊙, in the range spanned by young extragalactic star clusters. Unlike those clusters its proximity makes spatially resolved studies of its stellar population feasible. It is therefore the ultimate template for a young, massive star cluster, permitting direct comparison of its properties with measurements of velocity dispersion and dynamical mass for spatially unresolved extragalactic clusters.
To this end, we used the long slit near-infrared spectrograph VLT/ISAAC to observe the CO bandhead region near 2.29m, scanning the slit across the cluster centre during the integration. Spatially collapsing the spectra along the slit results in a single co-added spectrum of the cluster, comparable to what one would obtain in the extragalactic cluster context. This spectrum was analysed the same way as the spectra of almost point-like extragalactic clusters, using red superiant cluster members as velocity templates. We detected four red supergiants which are included in the integrated spectrum, and our measured velocity dispersion is 5.8 km/s. Together with the cluster size of 0.86 pc, derived from archival near-infrared SOFI-NTT images, this yields a dynamical mass of 6.3M⊙. While this value is not to be considered the final word, there is at least so far no sign for rapid expansion or collapse.
Key Words.:
open clusters and associations: individual: Westerlund 1 – Galaxies: star clusters – supergiants1 Introduction
For more than a decade now, following their discovery by Holtzman et al. (1992), young massive star clusters have been the focus of intense studies, amongst other reasons because they represent excellent laboratories of star formation: their relative youth ensures that their present day mass function still closely resembles the initial mass function (IMF), their high mass in principle allows studies of IMF variations (stochastic sampling of the IMF plays a minor role in clusters with masses in excess of approximately 105M⊙), and last, but not least, they are abundant in different types of galaxies where they probe a variety of environments. They suffer only one major drawback, the large distance, which means that they are slightly resolved at most, and typically also fairly faint.
The ideal candidates for star formation studies would show the advantages of the extragalactic clusters, but sit in the Galaxy and consequently allow spatially resolved analysis of individual stars in the clusters. Westerlund 1 (Wd 1) is potentially such an ideal target, the first one discovered in the Milky Way (at a distance of 5 kpc, where 1″ corresponds to 0.025 pc). Even though it was already detected in the 1960’s (Westerlund, 1961), it took a few decades to find out that the cluster light is highly extinguished by large quantities of dust, and that it possibly has a fairly high mass of about 105M⊙ .
We observed it as a template for the almost unresolved extragalactic star clusters. For most of those which were analysed spectroscopically, it is plausible that a large fraction of the cluster mass is contributed by low-mass stars (e.g., Mengel et al. (2002); Larsen & Richtler (2004); Larsen et al. (2004)), and that the clusters are compact enough to survive for at least several Gyrs. On the other hand, age determinations of individual clusters in a cluster population suggest that around 90% of all young massive extragalactic star clusters, irrespective of mass, are disrupted within 10 Myrs (Fall, 2004; Mengel et al., 2005; Bastian et al., 2005; Whitmore, 2006). Of course, it is possible that the clusters targetted for spectroscopy have already undergone a selection effect, because they are all older than 6-7 Myr and therefore clearly not amongst the first ones to disrupt. Other types of investigation are necessary to test this hypothesis.
But the origin of this discrepancy could also lie in false assumptions concerning the dynamical state of the young extragalactic star clusters - for example, disruption or collapse could lead to an increase in velocity dispersion which is unrelated to cluster mass. Therefore we wanted to test the approach used for extragalactic clusters on the only spatially resolved young star cluster which has a mass around M⊙.
2 Observations and data reduction
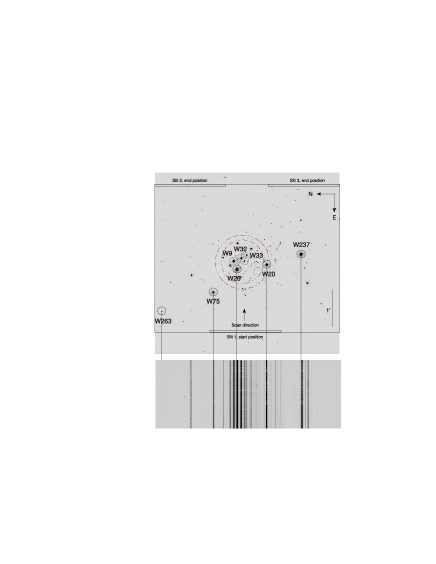
Observations were conducted on VLT-ANTU on the nights of March 11 and 12, 2006 and consisted of scanning the slit across a region while integrating. The ISAAC slit has a length of 2′, and we selected a slit width of 03 to obtain the highest possible spectral resolution. This is necessary for determining a stellar velocity dispersion below 10 km/s, which we expected for the cluster. The scans were conducted by acquiring a star in the centre of the cluster (W33 - throughout the text, we use the numbering from Westerlund (1987)), offsetting 2′ East, and then scanning westward over 4′, for a total integration time of 300 s. This was repeated three times, and two more scans were conducted by offsetting 108′′ North and South, respectively, from the acquisition position. Figure 1 shows the region covered and the resulting 2-dimensional spectrum.
The central wavelength was set to be 2.31 m, and the actual wavelength range covered is 2.249 – 2.373 m at a resolution of R9000.
Reduction of the data was performed using the IRAF package111IRAF is distributed by the National Optical Astronomy Observatories, which are operated by the Association of Universities for Research in Astronomy, Inc., under cooperative agreement with the National Science Foundation.. For the slit scan, it included sky subtraction (a scan across an empty sky field 10′ away was performed with identical integration time of 300 s directly after the cluster scan), bad pixel correction (but there was a blotch of bad pixels (dust) in the top left quadrant which appeared during the night which neither flatfielded out, nor was properly removed by median interpolation), and flatfielding.
Wavelength calibration combined the information of the XeAr lamp spectra and the night sky lines (Rousselot et al., 2000). Spatial distortion was easily corrected due to the many star spectra along the slit. The three scans (centre, offset North and offset South) were mosaicked into a combined scan before integrating spatially into a single cluster spectum.
Individual spectra of the four near-infrared brightest stars (indicated with small solid circles in Figure 1), which show prominent CO absorption, were extracted as template stars for the determination of the cluster velocity dispersion.
Since solar type stars were observed as telluric standards (Hip077718 (G2V, mK=5.894) and Hip087370 (G3V, mK=5.609)), we divided them by an adequately smoothed high-resolution solar spectrum before applying the correction of telluric features to the Westerlund 1 spectrum. The features near the MgI line around 2.2814 m appear to be a residual from this step which we could not eliminate.
Finally, we normalized all spectra which were used for the analysis by dividing by the continuum level determined from a small window (roughly 50 pixels) just shortward of the CO bandhead. A rough flux calibration was obtained via a two-step approach using the archival SOFI/NTT narrow band data obtained for Crowther et al. (2006), programme ID 073.D-0321, and the relative intensities from our scan. Even though we used a combination of NB 2.09m and NB 2.17m, we could reproduce the magnitudes published by Crowther et al. (2006) to within 0.1mag, and determined approximate K-band magnitudes for the moderately bright cluster members not listed in their publication. For the brightest cluster members, we could not use this image, because they were saturated. In those cases we used relative intensities to fainter stars common to the scan and the image (and isolated enough such that spectra of different clusters were not projected on top of each other). The relative fluxes of the stars remained quite constant throughout the short scanning time of 5 minutes, because the seeing varied only slightly. The three individual scans of the central region showed variations in the relative stellar intensities of up to 20%, more typically around 10%.
3 Analysis and Results
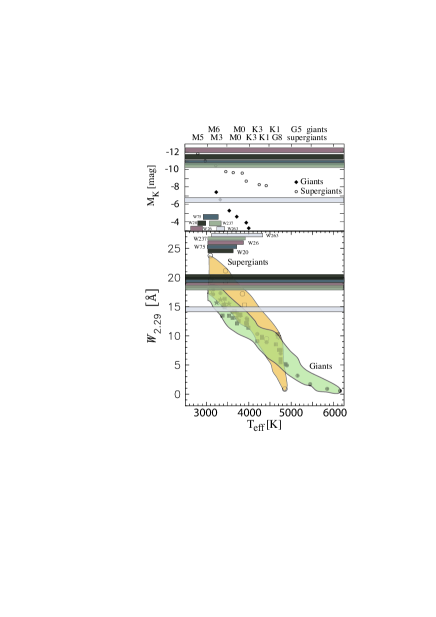
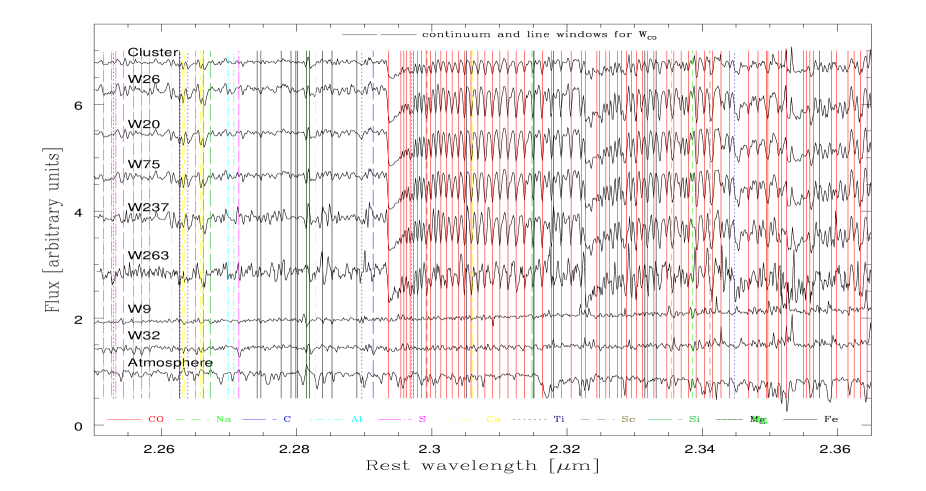
The resulting spectra are shown in Fig. 3. We additionally indicate the region which was used to determine the equivalent width of the 2.29m CO bandhead according to the definition of Origlia & Oliva (2000). From this equivalent width WCO2.29, in combination with approximate absolute magnitudes, we determined the rough spectral type of the individual stars as explained in Fig. 2.
For the K-band magnitudes, we used a distance modulus of 13.5, mV from Westerlund (1987), and apply an extinction correction of 0.7 mag in K-band, which is a lower limit (Crowther et al., 2006).
Fig. 2 shows our measurements of WCO2.29 in comparison with published values as a function of Teff. The lower part of the figure is based on a figure from Förster-Schreiber (2000) which includes measured values for WCO2.29 for giants and RSGs from her own measurements and two other publications (see references in that work). The loci populated by giants and SGs are indicated as shaded areas, and our measured values for both, WCO2.29 and MK are represented as horizontal bars which also indicate the measurement uncertainties. The range of effective temperature for which a given measurement overlaps with measured values for stars is indicated by the shorter (labelled) horizontal bars in the top of the lower part of the figure. In the top part, we applied essentially the same technique. For theoretical MK, we used VK colours from Koornneef (1983), and theoretical MV from Schmidt-Kaler (1982)). For three stars, both diagnostics lead to an agreement in spectral type / Teff. For the two brightest stars, the mismatch is caused by the lack of data points in Förster-Schreiber (2000) below 3000 K. Therefore, the table lists the spectral type resulting from MK.
The four brightest stars are assigned spectral types ranging between M3I and M6I (foreground objects are ruled out also because of the small spread in radial velocity). In order to determine if W263 is a member of Wd 1, and hence valid for inclusion in our velocity dispersion estimate, we determined its spectral type and radial velocity. It is much fainter than the red supergiants, and we considered WCO2.29 and V- and K-band photometry to decide if it is a cluster member or not. The equivalent width would be consistent with a late K-type supergiant or a late M giant. But the absolute luminosity is much too faint, an M5III star approximately at the distance of Wd 1 is likely, or a similar spectral type if it is somewhat closer or more distant. Moreover, its radial velocity is very different from that of the other stars; the velocity difference of around 60 km/s would be several times the escape velocity of the cluster. Hence, we have rejected W263 from our dynamical analysis.
We compared WCO2.29 = 8.7Å of the integrated spectrum with predictions from Starburst99 (Vazquez & Leitherer, 2005), using an instantaneous burst at solar metallicity with a Kroupa IMF ( between 0.1 and 0.5 M⊙, between 0.5 and 100 M⊙, Kroupa (2002)). The modelled WCO2.29 reaches 8.7Å at an age of 6.3 Myr. It is difficult to quote uncertainties for this age, because the main uncertainty is not caused by measurement uncertainties in the equivalent width, but rather in the models (e.g. treatment of the post-main-sequence phase), the assumptions (instantaneous burst), or simply statistics. Therefore, while the uncertainty in the equivalent width would lead to an age uncertainty of only around 0.2 Myr, the real age may easily be off by one or two Myr. Some of the spectral properties of the cluster as a whole and of individually extracted stars are listed in Table 1.
| Spectrum | WCO2.29 | mK | M | Spectral Type / age |
|---|---|---|---|---|
| Å | mag | mag | ||
| Westerlund 1 | 8.7 | 0.1 | - | 6.3 Myrs |
| W26 | 18.6 | 1.9 | -12.3 | M5-6I |
| W20 | 20.3 | 2.7 | -11.5 | M5I |
| W75 | 19.5 | 3.3 | -10.9 | M4I |
| W237 | 18.2 | 3.4 | -10.6 | M3I |
| W263 | 14.5 | 7.2 | -6.5 | M5III |
The integrated spectrum was used together with the individual spectra to determine the velocity dispersion in the same manner as with spectra of extragalactic star clusters: broadening the continuum-diluted red- or blueshifted template spectra222Velocity dispersions from broadening of absorption features can only be measured for clusters dominiated by a stellar type with photospheric absorption and without fast rotation by convolution with a Gaussian with a given velocity width until a best fit (determined through a minimization) of the cluster spectrum is obtained. From the estimated total mass of the cluster (105M⊙, Clark et al. (2005)), we expected a velocity dispersion of around 9 km/s, still quite comfortably above the limit of around 7 km/s to which we can determine a velocity dispersion in that spectral range if the signal-to-noise ratio is high enough (see Fig. 4, top, in Mengel et al. (2002)).
However, our measured velocity dispersion is much lower than expected. For different template stars (which were of course the individual stars extracted from the scan) and different wavelength ranges, our fitting routine returned results between 1 and 6 km/s. As there was no trend in our determined value with either spectral type of the template or spectral region considered, it was obvious that this was the random scatter expected for a velocity dispersion below the resolution limit, and we can only deduce that the velocity dispersion is below 7 km/s.
What is possible to determine, though with relatively high statistically uncertainty, is the rms radial velocity dispersion of the four red supergiants. The rms velocity dispersion determined from the - unfortunately only four - individual stellar velocities is 5.82.1 km/s. Weighting by the luminosity lowers this value to 5.01.7 km/s. Errors on both of these values were determined through Monte Carlo simulations, using the uncertainties in the individual velocity determinations. Formally, the latter value would be the one to compare with values obtained from observations of extragalactic clusters. But since this comparison is inappropriate in this case, due to the fact that Westerlund 1, because of its young age, contains far fewer red supergiant (RSG) stars than all extragalactic clusters studied so far, we use the dynamically more meaningful unweighted rms. Apparent magnitudes of the stars are given in Tab. 1, and the heliocentrically corrected radial velocities in Fig. 4.

The other parameter we require for the determination of the dynamical mass is the projected half-light radius. We used the NIR image we created from the archival NTT/SOFI data to obtain a radius which contains half of the total light (in projection) to be rhp=086014. The uncertainty comes mostly through assumption of different locations of the weakly constrained cluster centre.
The resulting dynamical mass, for a cluster in Virial equilibrium, is (assuming , for details on the formula see Mengel et al. (2002))
Within the errors this is consistent with the mass expected from photometry (Clark et al., 2005).
From stellar number counts, we also (like Clark et al. (2005)) arrive at an expected total cluster mass of approximately 105M⊙. We see 4 red supergiants, and take the number of Wolf-Rayet stars (WN: 16, WC: 8) from Crowther et al. (2006), and of blue supergiants (BSG; ) from Clark et al. (2005). The relative numbers of these stellar populations can be used together with evolutionary synthesis models (Vazquez & Leitherer, 2005) to age date the cluster. The model we assumed was the same we described earlier in this section. From this, according to Fig. 5, we determine the best fitting age to be 5 Myrs. The absolute stellar numbers then indeed correspond to a 105M⊙ cluster. Uncertainties on cluster mass from this method are difficult to determine, because of the sudden appearance (or disappearance) of post-main-sequence stars, RSG and Wolf-Rayet stars being almost mutually exclusive. Nevertheless, if the cluster age was wrong by one Myr, the total cluster mass could be as small as 5M⊙. One puzzling feature remains that supergiant stars of spectral type B3Ia were reported in Clark et al. (2005), which according to the model only appear at a cluster age of around 12 Myrs. This could indicate that the assumption of an instantaneous burst is invalid.

4 Conclusions and future work
-
1.
We identify four late-type supergiant stars (M3I-M6I) which in total contribute 40% of the light in K-band in the scanned region. The equivalent width of the CO bandhead of the integrated cluster spectrum is 8.7Å, which translates to a model age of 6.3 Myrs, somewhat older than the 5 Myrs determined from the stellar content. This discrepancy could arise from uncertainties in the models (the same model is used for both methods of age dating), or, certainly in part, because some of the stars which would contribute to the diluting continuum are not included in the spectrum because they are either outside the scanned region, or extinguished by dust.
-
2.
The velocity dispersion as determined from the integrated spectrum is below 7 km/s; the rms velocity dispersion from individual stars was found to be 5.8 km/s. The resulting dynamical mass is . Of course, these results cannot be considered final, because there are at least three aspects which could influence the velocity dispersion. Firstly, of course the uncertainties are rather large for an rms value determined from only four stars, and we need more stars for a more reliable estimate. Secondly, mass segregation is not ruled out in this cluster, since the main sequence has not yet been detected. In that case, even measuring more stars would yield a velocity dispersion which is too low for the total cluster mass, because the mass segregated high-mass stars have a smaller-than-average velocity, and also velocity dispersion. Furthermore, these most luminous cluster members would cause an artificially low estimate of the cluster size. In that case we would have a clear demonstration of the perils of directly interpreting stellar velocity dispersion measurements as reliable mass indicators in more distant clusters. And thirdly, this cluster is at the lower mass limit where observables become relatively unaffected by statistical fluctuations in the sampling of the IMF (Cervino & Valls-Gabaud, 2003; Cervino & Luridiana, 2006), which is why we observed it. Nevertheless, its probable mass, and hence the number of high mass stars, is only 1/10 that of some of the high mass extragalactic star clusters.
-
3.
There is not yet a sign for rapid expansion or collapse, which would have shown up as an unexpectedly large velocity dispersion. The assumption of Virial equilibrium thus appears to not be strongly violated.
-
4.
As this observational technique and analysis works well, further work at a wavelength more sensitive to the far more numerous hotter stars in this cluster would greatly increase the significance of our preliminary findings.
Acknowledgements.
We are enormously grateful to Paranal staff, whose excellent support enabled us to observe in this non-standard technique, and to the anonymous referee for useful comments which helped us to improve, and particularly clarify, the paper.References
- Bastian et al. (2005) Bastian N., Gieles M., Lamers H.J.G.L.M., Scheepmaker R.A., de Grijs R., 2005, A&A, 431, 905
- Cervino & Valls-Gabaud (2003) Cerviño M. & Valls-Gabaud D., 2003, MNRAS, 338, 481
- Cervino & Luridiana (2006) Cerviño M. & Luridiana V., 2006, A&A, 451, 475
- Clark et al. (2005) Clark J.S., Negueruela I., Crowther P.A., and Goodwin S.P, 2005, A&A, 434, 949
- Crowther et al. (2006) Crowther P.A., Hadfield L.J., Clark J.S., Negueruela I., Vacca W.D., astro-ph 0608356
- Fall (2004) Fall S.M., 2004, ASP Conference Series, Vol. 322. Edited by H.J.G.L.M. Lamers, L.J. Smith, and A. Nota. San Francisco: Astronomical Society of the Pacific, 2004., p.399
- Förster-Schreiber (2000) Förster-Schreiber N.M., 2000, AJ, 120, 2089
- Hinkle et al. (1995) Hinkle K., Wallace L, & Livingston W., 1995, PASP, 107, 1042
- Holtzman et al. (1992) Holtzman J. A. et al. 1992, AJ, 103, 691
- Koornneef (1983) Koornneef J., 1983, A&A, 128, 84
- Kroupa (2002) Kroupa P., 2002, ASP Conference Proceedings, Vol. 285. Edited by Eva K. Grebel and Walfgang Brandner, San Francisco: Astronomical Society of the Pacific, p. 86
- Larsen & Richtler (2004) Larsen S.S. & Richtler T, 2004, A&A, 427, 495
- Larsen et al. (2004) Larsen S.S., Broadie J.P, & Hunter D.A., 2004, AJ, 128, 2295
- Mengel et al. (2002) Mengel S., Lehnert M.D., Thatte N., & Genzel R., 2002, A&A, 383, 137
- Mengel et al. (2005) Mengel S., Lehnert M.D., Thatte N., & Genzel R., 2005, A&A, 443, 41
- Origlia & Oliva (2000) Origlia L., Oliva E., 2000, A&A, 357, 61
- Rousselot et al. (2000) Rousselot P., Lidman C., Cuby J.-G., Moreels G., & Monnet G., 2000, A&A, 354, 1134
- Schmidt-Kaler (1982) Schmidt-Kaler Th., 1982, in Landolt-Börnstein Vol. 2, eds. Schaifers K., Voigt H.H., Springer-Verlag
- Vazquez & Leitherer (2005) Vazquez G.A. & Leitherer C., 2005, ApJ, 621, 695
- Westerlund (1961) Westerlund B.E., 1961, PASP, 73, 51
- Westerlund (1987) Westerlund B.E., 1987, A&AS, 70, 311
- Whitmore (2006) Whitmore B.C., Chandar R., and Fall S.M., 2006, astro-ph/0611055