11email: kuntal,sagar@aries.ernet.in 22institutetext: Raman Research Institute, Bangalore 560 080, India
22email: dipankar@rri.res.in 33institutetext: Center for Research and Education in Science & Technology, Hosakote, Bangalore 562 114, India
33email: dks,bcb@crest.ernet.in 44institutetext: Indian Institute of Astrophysics, Bangalore, 560 034, India
44email: gca@iiap.res.in 55institutetext: Instituto de Astrofísica de Andalucía (IAA-CSIC), PO Box 03004, 18080 Granada, Spain
55email: ajct,gss@iaa.es 66institutetext: Nikolaev State University, Nikolskaya 24, 54030 Nikolaev, Ukraine
Optical observations of GRB 060124 afterglow: A case for an injection break
Abstract
Aims. We present broad band optical afterglow observations of a long duration GRB 060124 using the 1.04-m Sampurnanand Telescope at ARIES, Nainital and the 2.01-m HCT at IAO, Hanle, including the earliest ground based observations in R band for this GRB. We determine the decay slope of the light curve at different bands and examine the reality of a proposed jet break.
Methods. We use data from our observations as well as others reported in the literature to construct light curves in different bands and make power law fits to them. The spectral slope of the afterglow emission in the optical band is estimated.
Results. Our first R-band observations were taken d after burst. We find that all available optical data after this epoch are well fit by a single power law, with a temporal flux decay index . We do not find any evidence of a jet break within our data, which extend till d after the burst. The X-ray light curve, however, shows a distinct break around 0.6 day. We attribute this break to a steepening of the electron energy spectrum at high energies.
Conclusions. We conclude that the above measurements are consistent with the picture of a standard fireball evolution with no jet break within days after the burst. This sets a lower limit of erg to the total energy released in the explosion.
Key Words.:
gamma ray bursts – photometry – observations – temporal index – spectral index1 Introduction
GRB 060124 (Swift trigger = 178750), a long duration gamma ray burst, was detected on 2006 January 24 at T = 15:54:52 UT by the Swift-BAT (Holland et al. 2006a). The BAT light curve shows a precursor from T-3 to T+13 sec, followed by three major peaks from T+520 to T+550 sec, T+560 to T+580 sec, which has the largest flux, and T+690 to T+710 sec (Fenimore et al. 2006). The total duration of the GRB is, thus, the longest ever recorded by BATSE or Swift. The fluence of the precursor emission in the 15-150 keV band is (4.6 0.5) x 10-7 erg/cm2. The peak flux in the 15-150 keV band was about 4.5 0.5 counts/cm2/sec at T+570. The estimated total fluence in the BAT energy range is 7 x 10⁻⁶ erg/cm2 in the 15-150 keV band after scaling the fluence of the precursor.
Swift-XRT began observing the field 106 sec after the BAT trigger. Analysis of the first orbit of XRT data shows the presence of an X-ray source at a position = , = which is 2.4 arcmin from the BAT position and 9 arcsec from the optical afterglow candidate reported by Kann (2006). The X-ray light curve in the Windowed Timing mode shows an initial flat behavior followed by three bright flares after the first 100 s of observation (Mangano et al. 2006).
An optical afterglow candidate of the GRB 060124 was discovered by Kann (2006) at = , = . V-band exposures taken 184 and 629 sec after the BAT trigger by Swift-UVOT also show the presence of an optical transient (Holland et al. 2006b). No optical flare was detected at the position of the optical afterglow (Torii 2006). A low-resolution spectrum of the afterglow of GRB 060124 was obtained by Mirabal and Halpern (2006) on 2006 Jan 25.13. Its preliminary analysis shows the presence of a significant absorption feature at 5105 , possibly a doublet corresponding to Mg II 2795 , 2802 (z=0.82) or C IV 1548 , 1550 (z=2.30). The presence of doublet feature is later confirmed by Cenko et al. (2006). However, the Mg II feature has been ruled out on the basis of their separation and is identified as CIV feature by Prochaska et al. (2006). They also identified a weak absorption feature consistent with this redshift corresponding to AlII 1670 and an absorption line at 4000 consistent with Ly absorption and indicating log N(HI) 20.5. According to Prochaska et al. (2006) the afterglow spectrum is notable for exhibiting very weak low-ion features (e.g. non-detections of FeII 1608, OI 1302, CII 1334) and relatively low HI column density. In this respect, the spectrum of GRB 060124 afterglow is similar to the afterglows of GRB 050908 and GRB 021004. Assuming a standard cosmological model with = 70 km/s/Mpc, = 0.3, = 0.7 and a redshift of z=2.297 and a fluence of about 7 x 10⁻⁶ erg/cm2, the isotropic-equivalent gamma ray energy is 8.9 x 1052 erg (Cenko et al. 2006).
The most intense peak of the burst as seen by Swift BAT triggered Konus-Wind 558.9 s after the BAT trigger (Golenetskii et al. 2006). The Konus-Wind light curve shows the presence of the precursors and the three major peaks as were seen by Swift BAT. Golenetskii et al. (2006) make a preliminary estimate of the total burst fluence in the 20 keV - 2 MeV energy range to be 2.80 10-5 erg/cm2/sec. The major peak of GRB 060124 was intense enough to trigger the FREGATE instrument on HETE II 557.7 s after the Swift trigger time (Lamb et al. 2006).
GRB 060124 has been the first well studied event by Swift in the prompt and the afterglow emission phase (Romano et al. 2006). The prompt emission was simultaneously observed by XRT and UVOT. GRB 990123 was one such event for which the flare in the prompt phase was observed by ROTSE (Akerlof et al. 1999) which showed a rapid decline. This emission in the prompt phase was interpreted as reverse shock emission. The Konus-Wind light curve resembles the light curves of two long duration bursts: GRB 041219A (Vestrand et al. 2005) and GRB 050820A (Golenetskii et al. 2005). The IR afterglow of GRB 041219A was observed while the GRB was still going on. Optical imaging of GRB 050820A, 5.5 s after the trigger alert, with the RAPTOR telescope clearly shows the emergence of faint optical emission which suddenly flares and fades away during the first one hour (Vestrand et al. 2006). The prompt optical emission in both these long duration GRBs (GRB 041219A and GRB 050820A) has been attributed to internal shocks in the ultra-relativistic outflow (Vestrand et al. 2005, Vestrand et al. 2006), the same source that is thought to generate the gamma ray emission in the burst. The optical afterglow of GRB 060124 was extensively followed by ground based telescopes with the earliest observations reported by our group (Misra 2006).
In this paper we present the broad band photometric observations of the optical afterglow of GRB 060124 including the earliest observations in R band from any ground based telescope. A secure photometric calibration has been carried out by imaging the Landolt (1992) Standard SA 104 field along with the GRB 060124 field. A brief description about the observations and data reduction is presented in the next section whereas the multi-band optical light curve of the afterglow follow in section 3. The discussions and conclusions form the last section of the paper.
2 Observations and Data Reduction
Optical observations of the GRB 060124 afterglow were carried out using the 1.04-m Sampurnanand Telescope (ST) at Aryabhatta Research Institute of observational sciencES (ARIES), Nainital and the 2.01-m Himalayan Chandra Telescope (HCT) at Indian Astronomical Observatory (IAO), Hanle during 2006 January 24 to 26. A CCD chip of size 2048 2048 pixel2 was used at ST covering a field of 13′ 13′ on the sky. The gain and readout noise of the CCD camera are 10 e-/ADU and 5.3 electrons respectively. The filters used at ST are the Johnsons BV and Cousins RI. The frames were binned in 2 2 pixel2 to improve the signal-to-noise ratio of the source. The CCD used at HCT was a 2048 4096 SITe chip mounted on Himalayan Faint Object Spectrograph Camera (HFOSC). The central 2048 2048 region of the CCD was used for imaging which covers a field of 10′ 10′ on the sky. It has a gain of 1.22 e-/ADU and readout noise of 4.8 electrons. Filters used are Bessells R and V. The frames obtained using HCT were unbinned. Several twilight flat field and bias frames were obtained for the CCD images at both the telescopes. Several short exposures, with exposure time varying from 300 sec to 1800 sec, were taken in different filters to image the optical transient (OT) of GRB 060124.
MIDAS, IRAF and DAOPHOT softwares were used to process the CCD frames in standard fashion. The bias subtracted, flat fielded and cosmic ray removed CCD frames were co-added whenever found necessary.
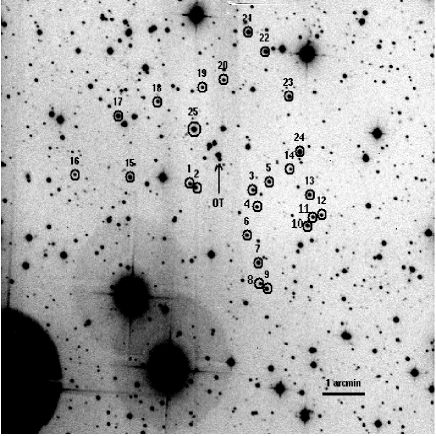
Landolt (1992) Standard field SA 104 region was imaged to calibrate the field of GRB 060124. Atmospheric extinction values and the transformation coefficients in B, V, R and I filters were determined using the 6 standard bright stars in the SA 104 region. The 6 standard stars in the SA 104 region cover a range of 0.518 1.356 in color and 13.484 16.059 in brightness. Using these transformation, magnitudes of 25 secondary stars were determined in GRB 060124 field and their average values are listed in Table 1. Figure 1 shows the position of the optical afterglow in R band and the 25 secondary stars used for calibration. These stars have internal photometric accuracy better than 0.01 mag. The (X, Y) CCD pixel coordinates were converted to , values using the astrometric positions given by Henden (2006). A comparison between photometry of Henden (2006) and that of ours yields zero point differences of 0.04 0.03, 0.04 0.03, 0.03 0.02 and 0.04 0.03 in , , , filters respectively. These zero point differences are based on the comparison of 14 common secondary stars in the field of GRB 060124.
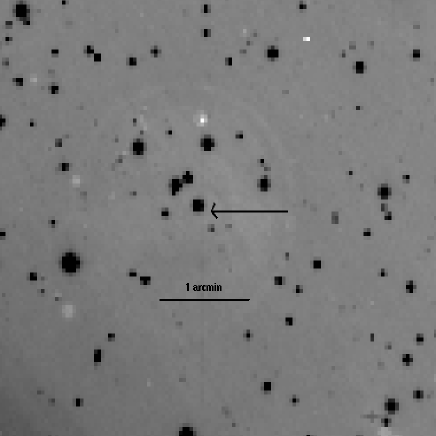
The observations of the field of GRB 060124 were carried out towards a later epoch on 2006 February 16 with the 2.5-m Issac Newton Telescope (INT) at La Palma, Spain. Figure 2 shows the zoomed area of the field of GRB 060124 which does not reveal any afterglow candidate at the location of the optical transient.
A full compilation of magnitudes of the optical afterglow differentially calibrated with respect to the secondary stars numbered 1, 2, 3, 4, 5 and 6 as listed in Table 1 is presented in Table 2. The photometric magnitudes reported by Masetti et al. (2006) were converted to the present photometric scale using the secondary stars listed in Table 1.
| ID | ||||||
|---|---|---|---|---|---|---|
| (h m s) | (deg m s) | (mag) | (mag) | (mag) | (mag) | |
| 1 | 05 07 41 | 69 41 02 | 16.99 | 1.41 | 0.92 | 0.83 |
| 2 | 05 07 59 | 69 41 48 | 18.83 | 1.61 | 1.19 | 1.42 |
| 3 | 05 07 57 | 69 42 21 | 15.45 | 0.99 | 0.53 | 0.49 |
| 4 | 05 07 54 | 69 42 52 | 17.05 | 1.08 | 0.63 | 0.59 |
| 5 | 05 08 08 | 69 41 12 | 17.06 | 0.82 | 0.45 | 0.45 |
| 6 | 05 08 11 | 69 41 51 | 16.66 | 0.86 | 0.49 | 0.47 |
| 7 | 05 08 15 | 69 42 32 | 17.12 | 0.74 | 0.39 | 0.41 |
| 8 | 05 08 12 | 69 43 16 | 18.08 | 0.82 | 0.45 | 0.44 |
| 9 | 05 08 33 | 69 43 42 | 16.78 | 0.95 | 0.51 | 0.46 |
| 10 | 05 08 27 | 69 44 51 | 16.83 | 1.42 | 0.89 | 0.77 |
| 11 | 05 08 25 | 69 45 14 | 15.27 | 0.77 | 0.42 | 0.41 |
| 12 | 05 08 35 | 69 45 10 | 14.93 | 0.72 | 0.39 | 0.39 |
| 13 | 05 08 31 | 69 44 28 | 18.09 | 0.95 | 0.53 | 0.46 |
| 14 | 05 08 50 | 69 43 43 | 16.56 | 0.88 | 0.49 | 0.46 |
| 15 | 05 08 56 | 69 43 52 | 16.34 | 0.86 | 0.47 | 0.45 |
| 16 | 05 09 15 | 69 43 51 | 19.18 | 1.49 | 1.04 | 1.07 |
| 17 | 05 09 01 | 69 45 25 | 15.71 | 0.69 | 0.38 | 0.39 |
| 18 | 05 08 47 | 69 45 50 | 17.41 | 0.67 | 0.37 | 0.39 |
| 19 | 05 08 32 | 69 46 16 | 17.89 | 0.75 | 0.43 | 0.43 |
| 20 | 05 08 25 | 69 46 29 | 18.18 | 0.85 | 0.48 | 0.49 |
| 21 | 05 08 17 | 69 47 44 | 16.09 | 0.93 | 0.51 | 0.48 |
| 22 | 05 08 11 | 69 47 16 | 16.01 | 0.67 | 0.38 | 0.38 |
| 23 | 05 08 02 | 69 46 08 | 16.64 | 1.07 | 0.58 | 0.57 |
| 24 | 05 07 58 | 69 44 44 | 15.40 | 0.63 | 0.35 | 0.38 |
| 25 | 05 07 54 | 69 43 40 | 17.18 | 0.99 | 0.56 | 0.53 |
| Date (UT) | Time since | Magnitude | Exposure | Tel. |
|---|---|---|---|---|
| 2006 January | burst (days) | (mag) | Time (s) | |
| -passband | ||||
| 25.6434 | 0.9802 | 20.58 0.048 | 1200 | ST |
| 25.6925 | 1.0294 | 20.69 0.042 | 1200 | ST |
| 25.7279 | 1.0648 | 20.67 0.051 | 1200 | ST |
| 25.7624 | 1.0993 | 20.78 0.043 | 1200 | ST |
| 26.6542 | 1.9911 | 21.30 0.075 | 1800 | ST |
| 26.7194 | 2.0563 | 21.54 0.070 | 1800 | ST |
| -passband | ||||
| 25.6314 | 0.9683 | 20.14 0.037 | 600 | ST |
| 25.6372 | 0.9741 | 20.15 0.029 | 600 | HCT |
| 25.6420 | 0.9789 | 20.13 0.032 | 600 | HCT |
| 25.6653 | 1.0022 | 20.19 0.045 | 600 | ST |
| 25.6771 | 1.0140 | 20.20 0.036 | 1200 | ST |
| 25.7161 | 1.0530 | 20.25 0.057 | 600 | ST |
| 25.7506 | 1.0875 | 20.28 0.053 | 600 | ST |
| 25.7830 | 1.1199 | 20.36 0.032 | 600 | HCT |
| 26.6190 | 1.9559 | 20.96 0.052 | 1200 | ST |
| 26.6306 | 1.9675 | 20.89 0.038 | 3x600 | HCT |
| 26.6729 | 2.0098 | 21.17 0.071 | 1200 | ST |
| 26.7418 | 2.0787 | 21.00 0.064 | 1800 | ST |
| 26.8806 | 2.2175 | 20.89 0.048 | 3x600 | HCT |
| -passband | ||||
| 24.7017 | 0.0386 | 16.83 0.007 | 300 | ST |
| 24.7069 | 0.0438 | 16.93 0.006 | 300 | ST |
| 24.7114 | 0.0483 | 17.02 0.008 | 300 | ST |
| 24.7201 | 0.0570 | 17.23 0.015 | 600 | HCT |
| 24.7288 | 0.0657 | 17.37 0.011 | 600 | HCT |
| 24.7373 | 0.0742 | 17.48 0.010 | 600 | HCT |
| 25.5594 | 0.8963 | 19.80 0.029 | 2x600 | HCT |
| 25.5820 | 0.9189 | 19.61 0.055 | 300 | ST |
| 25.5871 | 0.9240 | 19.77 0.042 | 300 | ST |
| 25.6083 | 0.9452 | 19.67 0.050 | 2x600 | HCT |
| 25.6113 | 0.9482 | 19.83 0.055 | 300 | ST |
| 25.6264 | 0.9633 | 19.86 0.020 | 600 | HCT |
| 25.6581 | 0.9950 | 19.93 0.065 | 300 | ST |
| 25.7089 | 1.0458 | 19.88 0.056 | 400 | ST |
| 25.7432 | 1.0801 | 19.84 0.071 | 400 | ST |
| 25.7576 | 1.0945 | 19.85 0.033 | 600 | HCT |
| 25.7660 | 1.1029 | 19.97 0.025 | 600 | HCT |
| 26.5615 | 1.8984 | 20.58 0.030 | 3x600 | HCT |
| 26.6308 | 1.9677 | 20.66 0.071 | 600 | ST |
| 26.7647 | 2.1016 | 20.55 0.047 | 1800 | ST |
| Feb 16.5146 | 22.9086 | 22.50 | 3x600 | INT |
| -passband | ||||
| 25.5918 | 0.9287 | 19.52 0.122 | 300 | ST |
| 25.6002 | 0.9371 | 19.20 0.061 | 300 | ST |
| 25.6049 | 0.9418 | 19.07 0.068 | 300 | ST |
| 25.6533 | 0.9902 | 19.25 0.071 | 300 | ST |
| 25.7030 | 1.0399 | 19.27 0.079 | 400 | ST |
| 25.7379 | 1.0748 | 19.67 0.112 | 300 | ST |
| 25.7729 | 1.1098 | 19.49 0.145 | 400 | ST |
| 26.6391 | 1.9760 | 20.19 0.158 | 600 | ST |
| 26.7000 | 2.0369 | 20.56 0.208 | 1200 | ST |
3 Multiband Optical Light Curve
Figure 3 shows the temporal evolution of the GRB 060124 afterglow in bands based on the data presented here and those available in the literature. The published magnitudes in the optical bands were brought to our photometry level using the 6 secondary standard stars as mentioned in Section 2. The frequency distribution of our data in bands is = (6, 13, 20, 9). It is to be noted here that we present the earliest ground based R band observations which have placed important constraints on the overall evolution of the afterglow. The X-axis here represents log where is the time of observation and = 2006 January 24.6331 UT is the burst epoch.
Since we have the R band observations from = 0.03 to 2.0 day, we noticed that
the R band flux decay of the afterglow of GRB 060124 can be well characterized by a single power law written as
where is the flux of the optical afterglow at time since the burst and is the temporal flux decay index. The above function was fitted to the R band data using the least square regression method. This yields the value of = 0.94 0.01. We assumed the same power law decay for B, V and I bands and fitted the above function which seems to agree with the observed data points. The linear least square fit to the data in the different bands is shown in figure 3.

Our observations extend upto = 2 days after the burst including the earliest R band data at = 0.03 day and it does not show any noticeable steepening in the light curve during this entire period of observations.
Towards a later epoch on 2006 February 16, the field of GRB 060124 was observed with the 2.5-m INT at La Palma, Spain. We do not see the optical afterglow in a co-added frame of 3 600 sec exposure at the location of the optical transient and thus put an upper limit of 22.5 mag at the location of the afterglow. There is also no sign of any galaxy at the location. The disappearance of the afterglow is apparent in figure 2 when compared to figure 1.
Both optical and X-ray light curves of GRB 060124 obtained from Swift show a remarkable flickering which can also be seen at late times in our optical observations at all the passbands. Achromatic flickering in optical bands has been seen in a few other GRB afterglows such as GRB 000301C (Sagar et al. 2000), GRB 021004 (Pandey et al. 2003, Bersier et al. 2003, Björnsson et al. 2004), GRB 021211 (Li et al. 2003), GRB 050319 (Wozniak et al. 2005) and GRB 051028 (Castro-Tirado et al. 2006). While some of the reported flicker could arise from variable observing conditions (Wozniak et al 2005), most of the observed flickering appears to be real. Short timescale variability could, in many cases, be attributed to density variations in the external medium (Wang & Loeb 2000). However, in some cases late injection of energy from the central engine provide a better explanation (e.g. Zhang and Meszaros 2002, Li et al. 2003). Gravitational microlensing has been proposed as the cause of achromatic variability in GRB 000301C (Garnavich et al. 2000), but this interpretation remains ambiguous. In the case of GRB 060124, the flickering is observed in all the optical bands as well as in X-rays. Time scales of this variability are short compared to the elapsed time since burst, and there is no evidence seen of persistent increase in the light curve level following the flicker episodes. This nature is more akin to the variability expected due to inhomogeneities in the density of the circumburst material.
4 Discussions and Conclusions
We present in this paper the broad-band optical observations using the 1.04-m Sampurnanand Telescope at ARIES, Nainital and the 2.01-m HCT at IAO, Hanle during 2006 January 24 to 26. We report the earliest optical observations in the R band at 1 hr. The X-ray light curve showed a “flaring” prompt emission. The prompt emission was also observed at optical wavelengths but no flaring activity was seen. The available data in the optical band (Swift UVOT + ground based observations) is not sufficient to compare the prompt optical emission with that in gamma ray and X-ray bands.
We study the optical afterglow evolution from 0.03 to 2.0 day. The optical afterglow is well characterized with a single power law decay with a flux decay index of 0.94 0.01. The late INT upper limit shows that any contamination from possible steady sources coincident with the afterglow is fainter by at least 2 magnitudes compared to the last observed afterglow magnitude at 2 days. This ensures that steepening of the optical light curve, if any, within 2 days could not be masked by a steady source contribution. Table 3 lists the colors of the afterglow at 1 and 2 days after the burst. The spectral index () of the afterglow of GRB 060124 in the optical band is estimated using the flux normalization at different frequencies from the light curves. The estimated value of Galactic Interstellar Extinction in the direction of the burst, using the reddening map provided by Schlegel et al. (1998) is E(B-V) = 0.135 mag. The apparent magnitudes, corrected for Galactic extinction only as the extinction due to the host galaxy is unknown, were converted to flux using the normalization in the bands by Bessel et al. (1998). The spectrum is described by a single power law , where is the flux at a frequency and is the spectral index. The value of obtained in this way is 0.73 0.08.
| days | mag | mag | mag | mag |
|---|---|---|---|---|
| 1.04 | 0.790.05 | 0.410.05 | 0.370.06 | 0.610.06 |
| 1.99 | 0.640.08 | 0.130.08 | 0.510.07 | 0.470.09 |
Romano et al. (2006) tried to fit the XRT light curve beyond 104 sec with a single power law which gives a flux decay index of = 1.36 0.02. But they find a significant improvement in the fit with a broken power law with a break time = 1.05 105 sec, = and = ( = 0.37). Romano et al. (2006) consider this break in the XRT light curve too shallow to be interpreted as a jet break. The optical UVOT data from Swift is available only for s and hence cannot be used to examine a possible break around this epoch.
Curran et al. (2006) also mention a break in the X-ray and optical light curve at 0.77 day but they do not quote the quality of the fit. They also mention that the achromatic break seen in the X-ray and optical light curves differ significantly from the usual jet break which is apparent in GRB afterglows. The late time temporal decay rates reported by Curran et al. (2006) are unequal in X-ray and optical bands, and both are shallower than expected in the case of a regular jet break.
With our coverage of optical data, we also try to check for a possible jet break by fitting a double power law to the observed data. However, combining the early and late time observations in R band we do not find any convincing evidence for a jet break around s as seen in the X-ray light curve by Romano et al. (2006) and there is no considerable steepening seen in the light curve till 2 days after the burst. Using the same values of , and as in the X-ray band (Romano et al. 2006), we attempt a broken power law fit to the R band light curve. This yields a very high value of / d.o.f. = 269 which clearly rules out the possibility of a similar break in the optical light curve. Even the inclusion of a possible contribution from a steady source, consistent with the INT upper limit, does not improve the broken power law fit appreciably. Similarly using the values reported by Curran et al. (2006) for the optical data, of break time = 0.77 day, = 0.77 and = 1.30 we fit a broken power law to the R band light curve. This fit is ruled out at a high confidence level with a / d.o.f. = 15. Thus, we conclude that the optical light curve is well characterized by a single power law.
Based on the fits made to the XRT light curve by Romano et al. (2006) and optical light curve (present work), we see a break which is present in the XRT light curve but not in the optical light curve. Thus, this is a frequency dependent break and is therefore not of dynamical origin. Steepening of this kind reflects a break in the energy distribution of the radiating electrons. Such a break, most commonly, is attributed to the effect of synchrotron cooling. Synchrotron cooling results in the steepening of the slope of the electron energy distribution by one and a corresponding change in the light curve slope by 0.25 (before the jet break). The break that is seen in the XRT light curve is however much steeper than 0.25. We tried to fit the XRT light curve by fixing a light curve slope of 0.25 (similar to that required by a cooling break) and rule out such a fit with a high confidence level (best fit / d.o.f. = 31). The steepening observed in the XRT light curve must therefore be attributed to a different cause. It might be that the energy spectrum of the injected electrons steepens beyond a certain high energy limit (see, eg. Panaitescu and Kumar 2001). Such an “injection break” as it passes through an observing frequency, leads to a corresponding break in the radiation spectrum, and to a steepening of the light curve. We may model such an evolution using a general form of the expression used by Wei and Lu (2002). Wei and Lu (2002) propose that the multi-wavelength spectra of GRB afterglows may not be made of exact power law segments but with a smooth change in slope and some breaks in the GRB afterglow light curves may be caused by such curved spectra.
For an injection break () in the electron energy spectrum evolving as , where is the bulk Lorentz factor of the shock (see Bhattacharya 2001), we can describe the flux evolution at a given observing frequency as
| (1) |
which is a generalisation of the expression of Wei and Lu (2002) who use the evolution of a regular cooling break for which = -1/3. and are the radiation spectral indices below and above the injection break respectively.
Based on this model, we have fitted the X-ray and optical afterglow light curve of GRB 060124. For an assumed = -1/3, the best fit values obtained for the X-ray light curve are = 0.55 0.11 d, = 0.59 0.07 and = 1.95 0.70 with /d.o.f. = 2.1. Fits to the R band light curve with the same values of , and is ruled out at a high confidence level with a / d.o.f. = 225. Thus, the break which is seen in the X-ray light curve is not an achromatic break. A good fit with the same and is obtained for the R band optical light curve with /d.o.f. = 3.8 if the optical band break time is assumed to be 2 day, resulting in a single power law evolution with slope = 3/2. The fits to the X-ray and R band light curves are shown in figure 4. The value of = 0.89 0.11 obtained this way is consistent with the single power law fit to the light curve of all optical bands presented above. We conclude that the break in the X-ray band at 105 sec mentioned by Romano et al. (2006) is not a jet break, but is possibly due to the steepening of the electron energy spectrum at high energies. The derived value of the high energy radiation spectral index depends on the value of for which no independent measurement exists in this case since the passage of the injection break through multiple frequency bands has not been monitored. The dependence of derived on the assumed value of in the range -1/3 to 1 is displayed in figure 5.


The existence of an injection break within the observed frequency bands have been inferred for several other GRB afterglows too (see, for example, Panaitescu and Kumar 2002). This provides an important clue to the particle acceleration process operating in these afterglows. The steepening of the injected electron energy spectrum indicates an upper cutoff, or reduction in efficiency, of the particle acceleration, which may be due either to radiation losses within the acceleration cycle time or simply the limited residence time of electrons within the acceleration zone (Gallant and Achterberg 1999; Gallant et al. 1999). The appearance of the injection break in the X-ray band around day after the burst implies that the upper cutoff Lorentz factor in this case lies in the range –, depending on the fraction of the total energy in the magnetic field and other physical parameters of the afterglow. In the present case, good constraints can unfortunately not be obtained on the physical parameters, in the absence of extensive multiwavelength coverage. Better constraints on the acceleration process will be possible if routine, sensitive monitoring of afterglows is performed at high energies including gamma rays, supported by extensive long wavelength coverage. It is likely that the soon-to-be-launched GLAST mission will be able to make significant impact in this area, particularly for bright afterglows.
The above description of the X-ray and optical light curves implies that within the period of available observations, i.e. till 2 days after the burst, no jet break has occurred in this afterglow. While many afterglows exhibit jet break relatively early, those with jet break beyond 2 days are not rare. Examples include well known afterglows of GRB 000301C, GRB 011211 and GRB 021004. In fact in a sample of 59 GRB afterglows examined by Zeh et al. (2006), five had jet break around 2 days and six had jet break between 3 to 8 days after the burst.
The lower limit to the jet break time mentioned above can be used to put constraints on the jet opening angle and total energy content in the afterglow. Using the isotropic equivalent energy of 8.9 1052 erg derived from - ray fluence by Cenko et al. (2006) and a lower limit to the jet break time of 2 days, we estimate the lower limit to the jet opening angle to be 4.75 degree for an assumed ambient density of 1 atom cm-3 and - ray efficiency of 0.2. This, in turn, yields a lower limit to the total energy output of 0.31 1051 erg, close to the estimated mean energy output in GRBs (Frail et al. 2001).
It is interesting to note that using the empirical relation (Ghirlanda et al. 2005, Liang & Zhang 2005) between isotropic equivalent photon energy output in the burst, the peak energy in the burst and the jet break time, Romano et al. (2006) predicted a jet break time of (2.1 1.2) 105 s for this afterglow, which is consistent with the lower limit to the jet break time discussed by us.
The above discussion demonstrates that observations of GRB afterglows continue to unveil surprising features in their evolution and reveal aspects of underlying physics that remain to be understood.
Acknowledgements.
We thank the HCT and ARIES observers for kindly sparing their observing time for these observations. We acknowledge K. Viirone (IAC), J. A. Caballero (IAC, ING) and L. Sabin (ING) for obtaining the INT image on 15/16 February 2006. This research has made use of data obtained through the High Energy Astrophysics Science Archive Research Center Online Service, provided by the NASA/Goddard Space Flight Center. The GCN system, managed and operated by Scott Barthelmy, is gratefully acknowledged. One of the authors (KM) thanks L. Resmi and Brijesh Kumar for several useful discussions while drafting the manuscript. We thank the anonymous referee for constructive comments which improved the manuscript.References
- (1) Akerlof, C., Balsano, R., Barthelemy, S., et al., 1999, Nature, 398, 400
- (2) Bersier, D., Stanek, K. Z., Winn, J. N., et al., 2003, ApJ, 584, L43
- (3) Bessell, M. S., Castelli, F., Plez, B., 1998, A & A, 333, 231
- (4) Bhattacharya, D., 2001, BASI, 29, 107
- (5) Björnsson, G., Gudmundsson, E. H. & Jóhannesson, G., 2004, ApJ, 615, L77
- (6) Castro-Tirado, A. J., Jelínek, M., Pandey, S. B., et al., 2006, A & A, 459, 763
- (7) Cenko, S. B., Berger, E. & Cohen, J., 2006, GCN Circular 4592
- (8) Curran, P. A., Kann, D. A., Ferrero, P., et al., 2006, astro-ph/0610067
- (9) Fenimore, E., Barbier, L., Barthelmy, S., et al., 2006, GCN Circular 4586
- (10) Frail, D. A., Kulkarni, S. R., Sari, R., et al., 2001, ApJ, 562, 55
- (11) Garnavich, P. M., Loeb, A. & Stanek, K. Z., 2000, ApJ, 544, L11
- (12) Ghirlanda, G., Ghisellini, G. & Firmani, C., 2005, MNRAS, 361, L10
- (13) Gallant, Y. A. & Achterberg, A., 1999, MNRAS, 305, L6
- (14) Gallant, Y. A., Achterberg, A. & Kirk, J. G., 1999, A&AS, 138, 549
- (15) Golenetskii, S., Aptekar, R., Mazets, E., et al., 2005, GCN Circular 3852
- (16) Golenetskii, S., Aptekar, R., Mazets, E., et al., 2006, GCN Circular 4599
- (17) Henden, A., 2006, GCN Circular 4607
- (18) Holland, S. T., Barthelmy, S., Burrows, D. N., et al., 2006a, GCN Circular 4570
- (19) Holland, S. T., Smith, P., Huckle, H., et al., 2006b, GCN Circular 4580
- (20) Kann, D. A., 2006, GCN Circular 4577
- (21) Lamb, D., Ricker, G., Atteia, J-L., et al., 2006, GCN Circular 4601
- (22) Landolt, A. R., 1992, AJ, 104, 340
- (23) Li, W., Filippenko, A. V., Chornock R. & Jha, S., 2003, ApJ, 586, L9
- (24) Liang, E. & Zhang, B., 2005, ApJ, 633, 611
- (25) Mangano, V., Cusumano, G., La Parola, V. et al., 2006, GCN Circular 4578
- (26) Masetti, N., Palazzi, E., Maiorano, E., et al., 2006, GCN Circular 4587
- (27) Mirabal, N. & Halpern, J. P., 2006, GCN Circular 4591
- (28) Misra, K., 2006, GCN Circular 4589
- (29) Panaitescu, A. & Kumar, P., 2001, ApJ, 554, 667
- (30) Panaitescu, A. & Kumar, P., 2002, ApJ, 571, 779
- (31) Pandey, S. B., Sahu, D. K., Resmi, L., et al., 2003, BASI, 31, 19
- (32) Prochaska, J. X., Foley, R., Tran, H., et al., 2006, GCN Circular 4593
- (33) Rhoads, J., Burud, I. & Fruchter, A., 2002, GCN Circular 1601
- (34) Romano, P., Campana, S., Chincarini, G., et al., 2006, A & A, 456, 917
- (35) Sagar, R., Mohan, V., Pandey, S. B., et al., 2000, BASI, 28, 499
- (36) Schlegel, D. J., Finkbeiner, D. P. & Davia, M., 1998, ApJ, 500, 525
- (37) Torii, K., 2006, GCN Circular 4596
- (38) Vestrand, W. T., Wozniak, P. R., Wren, J. A., et al., 2005, Nature, 435, 178
- (39) Vestrand, W. T., Wren, J. A., Wozniak, P. R., et al., 2006, Nature, 442, 172
- (40) Wang, X. & Loeb, A., 2000, ApJ, 535, 788
- (41) Wei, D. M. & Lu, T., 2002, A & A, 381, 731
- (42) Wozniak, P. R., Vestrand, W. T., Wren, J. A., et al., 2005, ApJ, 627, L13
- (43) Zeh, A., Klose, S. & Kann, D. A., 2006, ApJ, 637, 889
- (44) Zhang, B. & Meszaros, P., 2002, ApJ, 566, 712