Low Frequency GMRT Observations of Microquasar V4641 Sgr
Abstract:
We have observed the micro-quasar V4641 Sgr (SAX J1819.3-2525) at the time of flare during May 2002, using the Giant Metrewave Radio Telescope at low radio frequencies (244 and 610 MHz). This is the lowest frequency radio detection of the source. The source showed clear signature of spectral evolution from optically thick to thin state. We model the spectral evolution of the source to obtain some of the source parameters. Assuming the value of magnetic field strength to be in the range of 0.1 to 1 Gauss, we obtain the initial velocity of expansion of the jet to be in the range 0.45c to 0.25c. This is consistent with the known expansion velocities of the jet with other microquasars.
1 Introduction
The micro-quasar V4641 Sgr (XTE J1819-254/SAX J1819.3-2525) was discovered independently by proportional counter array in Rossi X-ray Timing Explorer (RXTE) [1] and wide field cameras on board BeppoSAX [2] in 1999. Optical spectroscopy and photometry showed that V4641 Sgr is a black hole candidate with a mass of in a binary system with a high mass companion [3]. The radio morphology of the source suggests that it is a relativistic jet source like SS433, GRS 1915+105 and Sco X-1 [4] and thus it is a microquasar. The object showed flaring events in past in X-ray [5], optical [6] and radio [4] wavelengths. From RXTE-PCA monitoring of galactic centre region on UT 17.6 and 20.9 May 2002, Markwardt and Swank [7] reported that the source had started flaring. Here we report low frequency radio observation of the source in 244 and 610 MHz using the Giant Meterwave Radio Telescope (GMRT) during the May 2002 outburst. In Section 2, we briefly describe the observation and data analysis and in Section 3 we discuss the results. The summary and conclusions are presented in Section 4.
| Date 2002 | MJD | Frequency | Duration | Flux (mJy) | Flux (mJy) |
|---|---|---|---|---|---|
| May (UT) | (MHz) | (sec) | V4641 Sgr | background | |
| source | |||||
| 23.99 | 52417.99 | 244 | 1680 | ||
| 24.89 | 52418.89 | 244 | 2700 | ||
| 27.85 | 52421.85 | 244 | 1800 | ||
| 28.90 | 52422.90 | 244 | 1800 | ||
| 24.03 | 52418.03 | 610 | 1920 | ||
| 25.02 | 52419.02 | 610 | 1500 | ||
| 25.92 | 52419.92 | 610 | 4500 | ||
| 26.92 | 52420.92 | 610 | 4800 | ||
| 28.01 | 52422.01 | 610 | 2700 | ||
| 29.76 | 52423.76 | 610 | 1680 |
upper limit
2 Observation and Data Analysis
The present observation of V4641 Sgr is carried out at low radio frequencies of 244 and 610 MHz using the Giant Metrewave Radio Telescope (GMRT) [8] during the radio flare in May 2002. GMRT consists of 30 fully steerable parabolic antennas out of which 16 are distributed in a nearly ‘Y’ shaped array and the remaining 14 antennas are randomly distributed in the central 1 km region. The resolution at 244 and 610 MHz are and respectively. Details of GMRT specification can be found at GMRT home page www.gmrt.ncra.tifr.res.in. The bandwidths of the present observations were 6 MHz and 16 MHz at 244 and 610 MHz respectively in the spectral line mode with a total of 128 channels with channel width of 125 kHz per channel. For our observations, we used 16.9 second integration time. Presently, GMRT has a facility to observe simultaneously in 244 and 610 MHz but this facility was not available at the time of this observation. However, whenever possible, we have taken near simultaneous observation at 244 and 610 MHz. We have used 3C48 or 3C286 as flux and bandpass calibrator and 1626-298 as phase calibrator. The observation log and the measured flux of V4641 Sgr on different days are presented in Table LABEL:tab1. The flux of a background source J181929253736 is also included in the Table, which exhibits constant flux.
We have also used the archival data of Very Large Array (VLA), observed between 23rd May and 31st May 2002 at 1.5, 4.9, 8.4, 15.0, 22.5 and 43.3 GHz. The array was in the AB configuration at that time. The data obtained from VLA is processed by using AIPS with standard procedures.
The data recorded with GMRT was converted to FITS format and then analyzed with the Astronomical Image Processing System (AIPS) using standard procedures. After editing the data, the data in 128 channels was collapsed into fewer channels by applying bandpass. To take care of bandwidth smearing, at 244 MHz, we have averaged each 8 channels. The flux measurements at 244 and 610 MHz were corrected for the increased sky background in the direction of V4641 Sgr.


3 Results and Discussion
3.1 Radio Light Curve and Spectral Evolution
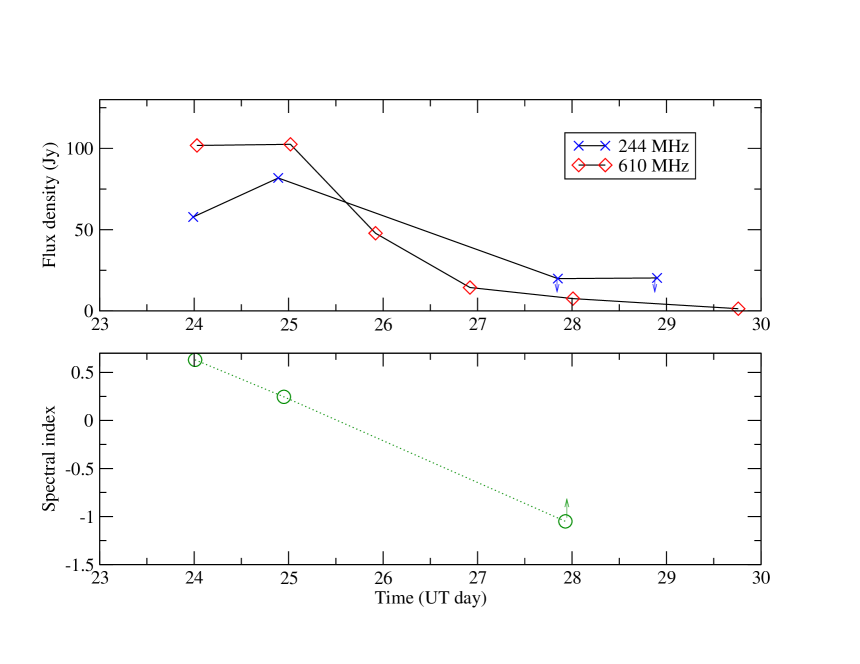
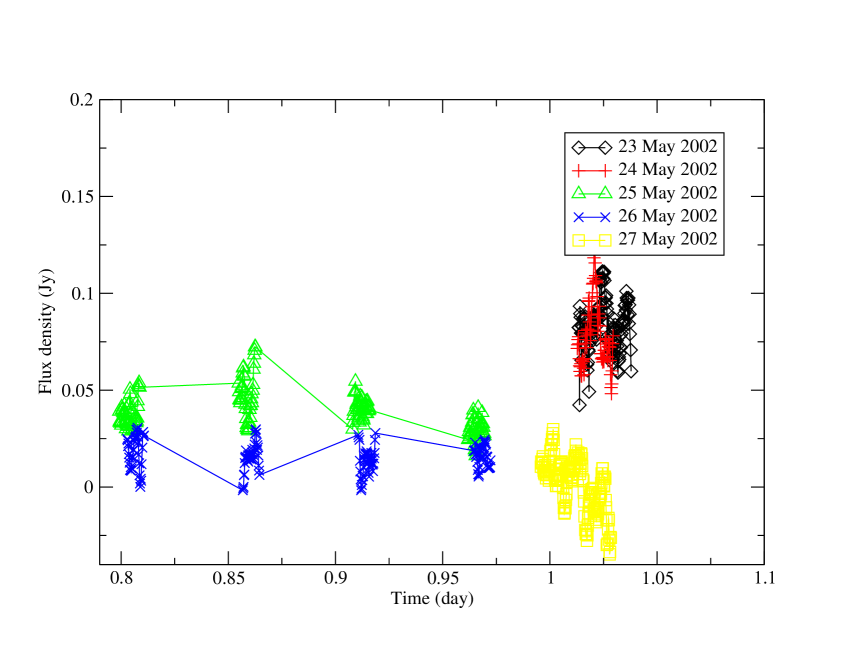
The image of the field of V4641 Sgr at 244 and 610 MHz is presented in Figure 1. The source V4641 Sgr is indicated by a circle as on 24 May at 610 MHz and 244 MHz. The source is not resolved at any of these frequencies. There are many background sources in the field. The flux of these background sources is constant in all the days of observations within measurement errors. V4641 Sgr is clearly detected at 610 and 244 MHz over the first two days. While the flux remained steady at 610 MHz on May 24 and 25, there was an increase in flux at 244 MHz over the same duration, indicating that the spectra has become optically thin on the second day. The radio light curve is presented in Figure 2. The source is seen to fade from 25 to 30 May 2002. The flux density is below limit of 20 mJy on UT 27.85 May 2002 in 244 MHz, though it was still visible in 610 MHz with flux density of 7.6mJy (averaged over whole scan). The limit at 244 MHz is significantly higher than the detected flux at 610 MHz, hence it is possible that the source is optically thin. In the Table LABEL:tab1 we have listed the flux of the source (averaged over whole scan) for different days in each frequencies and for comparison the flux density of a background source J181929253736 is also given. The radio data at 610 MHz is roughly fitted with an empirical decay formula . In Figure 2 (bottom panel), we have plotted the variation of spectral index with time between 244 and 610 MHz, assuming . The plot clearly shows spectral evolution from optically thick to optically thin states. The spectral index on May 24, 2002 was 0.60 which changed to 0.24 on next day. The source showed high variability for each days of observation. In Figure 3, we show the variability of the source for the observation of four days at 610 MHz. No signature of any periodicity or quasi periodic oscillation is found from the fast Fourier transform of short scans of variable radio data.
3.2 Jet Expansion Speed
If we assume the absorption in the optical thick region is due to synchrotron self absorption, it is possible to calculate the quantity (containing the size of the radio source and the magnetic field ) by equating the the observed flux with the source function for the non thermal emission (as done for the case of SS433 in Pal et al [9]). From the standard synchrotron synchrotron self-absorption formulae, [10]
| (1) |
where is in seconds of arc, is the turnover frequency in MHz, is the flux density at the turnover frequency in Jy, is a function of the power-law index and is the magnetic field in Gauss.
From Figure 4, where we have shown the radio spectrum of the source on 23rd May 2002 (UT 08h to 12h), the turnover frequency is approximately GHz and the spectral index between 22.5 and 43.3 GHz is -0.89 (assuming ). This implies , where is in milli-arcsec and B in Gauss. If we assume mG, the size of the radio source will be mas.
The source has expanded since then and the spectra has become optically thin. The source is not detected in further VLA observations at GHz frequencies a few days later. From the GMRT light curve, the synchrotron turn over frequency did not cross below 610 MHz till 25th May. Unfortunately there is no measurement at 244 MHz on this day or on 26th May, but the examination of the light curve at 244 MHz suggests that the peak should have occurred after 25th May, but before 27th May. The time at which the 244 MHz emission would have peaked can be estimated using the adiabatic expansion models used to estimate the time delay for GRS1915+105 [11]. Assuming an optically thin spectral index of 0.75, the application of the above model gives us a time delay of 2.7 days between the peak at 17 GHz and 244 MHz. This means the 244 MHz emission would have peaked on May 26.1. This is broadly consistent with the light curve, where the peak at 244 MHz was expected after 25th May, but before 27th May, hence we use this time for further calculations. From the synchrotron self absorption equation, if the turnover frequency and flux is 244 MHz and 100 mJy respectively. Assuming a magnetic field mG, we get the size of the radio source to be mas.

It should be noted that the size of the source depends weakly on the value of the magnetic field . From the expansion between the days mentioned above, we can obtain the source expansion speed. Taking the distance of V4641 Sgr to be 6.1 kpc [12], the velocity of expansion comes out to be . If we assume the magnetic field to be 1 Gauss, the expansion speed is 0.25c.
4 Conclusion
We have shown for the first time that V4641 Sgr is active at meter wavelengths. This is the first detection of the source at the low frequency of 244 MHz. The source has shown considerable variability at 610 MHz. Synchrotron self absorption explains the behavior of the source in the optically thin limit with reasonable extent. Assuming the radio source is expanding spherically, we get the velocity of expansion of c to 0.25c for magnetic field values of 0.1 to 1 Gauss. This is broadly in agreement with the expansion speeds observed in some of the microquasars.
Acknowledgments
We thank the staff of the GMRT that made these observations possible. GMRT is run by the National Centre for Radio Astrophysics of the Tata Institute of Fundamental Research. We have used data from National Radio Astronomy Observatory (NRAO) archive. The NRAO is a facility of the National Science Foundation operated under cooperative agreement by Associated Universities, Inc.
References
- [1] Markwardt C.B., Swank J.H. and Marshall F.E., XTE J1819-254, XTE J1743-363, XTE J1710-281, XTE J1723-376, IAUC, 99, 7120.
- [2] in ’t Zand J., Heise J., Bazzano A., Cocchi M., di Ciolo L. and Muller J. M, SAX J1819.3-2525, IAUC, 99, 7119.
- [3] Orosz J., Kuulkers E., vander Kliss M., McClintock, Jeffrey E., Garcia, Michael R., Callanan, Paul J., Bailyn, Charles D., Jain, Raj K. and Remillard, Ronald A., A Black Hole in the Superluminal Source SAX J1819.3-2525 (V4641 Sgr), ApJ, 01, (555), 489.
- [4] Hjellming R. M., Rupen M. P., Hunstead R. W., Campbell-Wilson D., Mioduszewski A. J. et al., Light Curves and Radio Structure of the 1999 September Transient Event in V4641 Sagittarii (=XTE J1819-254=SAX J1819.3-2525), ApJ, 00 (544), 977.
- [5] Maitra D. and Bailyn C.D., X-Ray Observations of V4641 SGR (SAX J1819.3-2525) during the Brief and Violent Outburst of 2003, ApJ, 06 (637), 992.
- [6] Uemura, M., Kato T., Watanabe T., Stubbings R., Monard B. and Kawai N., The 1999 Optical Outburst of the Fast X-Ray Nova, V4641 Sagittarii, PASJ, 02, (54), 95.
- [7] Markwardt C. B. and Swank J. H., SAX J1819.3-2525, IAUC, 02, 7906.
- [8] Swarup G., Ananthakrishnan S., Kapahi V.K., Rao A.P., Subrahmanya C. R. and Kulkarni V.K., The Giant Meter-Wave Radio Telescope, Curr. Sci., 91, (60), 95.
- [9] Pal S., Chakrabarti S. K., Kraus A. and Mandal S., Broadband radio spectrum of SS433, BASI, 06, (34), 1.
- [10] Moffet, A. T., Strong Nonthermal Radio Emission from Galaxies (Stars and Stellar Systems), 72, (Chap 7), 211
- [11] Ishwara-Chandra, C. H., Yadav, J. S., Pramesh Rao, A., Evidence for synchrotron bubbles from GRS 1915+105, 00, (338), L33.
- [12] Orosz J., Kuulkers E., van der Klis M., McClintock J. E., Jain R. K. and Bailyn C. D., V4641 SAGITTARII, IAUC, 00, 7440.