VLA Observations of J1228+441, a Luminous Supernova Remnant in NGC 4449
Abstract
The luminous, oxygen-rich supernova remnant, J1228+441, is located in the irregular galaxy NGC 4449 and has been observed at radio wavelengths for thirty years. An analysis of recent VLA observations of NGC 4449, combined with VLA archive data and previously published VLA and WSRT observations, yields light curves at 6 and 20 cm from 1972 to 2002. The light curves at all radio frequencies exhibit a marked decline in radio emission, confirming past findings. This paper presents and discusses the radio light curves and spectral index, , variations from 1972 to 2002 where and compares J1228+441 with other radio supernovae. The spectral index of J1228+441 appears to have steepened in the last five years at higher frequencies from in 1996 to in 2001-2002.
1 Introduction
NGC 4449 is a Magellanic type irregular galaxy with several areas of vigorous recent star formation, including the nucleus and the bar. The distance to NGC 4449 has been suggested to range from 3.7 Mpc (Bajaja et al. 1994) to 5.0 Mpc (Sandage & Tammann 1975 and Aaronson & Mould 1983). In this paper, we adopt a distance of 3.9 Mpc (de Vaucouleurs 1975). The recent star formation in NGC 4449 may have been triggered by a past galactic collision and tidal stripping (Hunter, van Woerden, & Gallagher 1999). The massive stars formed in the recent star formation episodes can then become the progenitors for core-collapse supernovae.
The ultra-luminous supernova remnant (SNR), J1228+441, was first detected by Seaquist & Bignell (1978) and Balick & Heckman (1978) at radio and optical wavelengths, respectively. The nonthermal spectral index, =0.95 0.27 ( , where is the flux density at frequency ) (Seaquist & Bignell 1978), and observations of both broad and narrow lines in the optical spectrum (Balick & Heckman 1978) of J1228+441 indicate that the source was a SNR. Additional optical spectroscopic observations by Kirshner & Blair (1980), Blair, Kirsher, & Winkler (1983) confirmed that the SNR is embedded in and interacting with a nearby H II region.
An upper limit of the diameter of J1228+441 was determined first by De Bruyn (1983) who used European VLBI data to place a limit of ( 1.3 pc at 3.9 Mpc) on the angular size of J1228+441. The age of J1228+441 has been estimated from expansion velocities in excess of 6,000 km s-1, based on UV/optical HST and ground based observations (Blair & Fesen 1998, Blair 2006). The age of J1228+441 was estimated to lie in the range of 60 - 200 years. In this paper, we adopt an explosion date of 1900 for J1228+441 with a large uncertainty. Blair & Fesen (1998) and Blair (2006) found an upper limit of 0028 (or 0.5 pc) for the diameter of the SNR based on HST data. J1228+441 is one of the few known intermediate aged SNRs with an age between that of Cas A, which is 330 years (Thorstensen, Fesen, & van den Bergh 2001), and that of the oldest known extragalactic radio supernovae, SN 1923A in M83 (Eck et al. 1998), which is 83 years old, and SN 1957D also in M83 (Pennington & Dufour 1983), which is 49 years old. J1228+441 is also notable as the most luminous and most distant member of the class of oxygen-rich SNRs (Blair, Kirshner, & Winkler 1983).
Radio observations of J1228+441 were reported by de Bruyn, Goss, & van Woerden (1981), de Bruyn (1983), and Bignell and Seaquist (1983). De Bruyn, Goss, & van Woerden (1981) used Westerbork Synthesis Radio Telescope (WSRT) observations of J1228+441 and found a long-term trend of decline in the radio emission at 6 cm over a period of seven years. Bignell and Seaquist (1983) reported NRAO111The National Radio Astronomy Observatory is a facility of the National Science Foundation operated under cooperative agreement by Associated Universities, Inc. Very Large Array (VLA) observations of J1228+441 from 1979 to 1982 and concluded that the new observations showed significant variability at 5GHz. However, they could not establish the nature of the variability based on their data. Additional WSRT observations from late 1980 to 1982 were reported by de Bruyn (1983), who found that the flux density of J1228+441 at 5 GHz confirmed the decline first reported in de Bruyn, Goss, & van Woerden (1981). There is also weak evidence that the X-ray emission from J1228+441 has decreased by roughly a factor of two from the Einstein data of 1983 (Fabbiano et al. 1992) compared to both the ROSAT data of 1997 (Vogler & Pietsch 1997) and the Chandra data of 2002 (Summers et al. 2003, Patnaude & Fesen 2003).
2 The VLA Observations of J1228+441
A series of VLA observations was undertaken in 1994; A array observations at 20 cm with a beam of 1.3″ 1.2″, PA= 86°, and a rms noise of 0.026 mJy beam-1 were carried out on 30 March 1994, followed by B array observations at 6 cm with a beam of 2.42″ 1.39″, PA= 82°, and a rms noise of 0.028 mJy beam-1, 16-17 June 1994. These observations form the basis of a comprehensive study of NGC 4449, which will be reported elsewhere (Lacey et al. 2006). In Figure 1, we show the location of J1228+441 within the galaxy NGC 4449. The source is located 30″ (570 pc, projected) north of the center (position given by Hunter et al. 1998) of NGC 4449.
To follow the variations in flux density in the intervening years since de Bruyn (1983) and Bignell & Seaquist (1983) the VLA archive was searched for observations of NGC 4449 and J1228+441 that had not been previously published. A total of twelve 20 cm observations, fifteen 6 cm observations, and six additional wavelength observations were located in the archive. These observations of J1228+441 are presented in Table 1, containing the observation date, telescope, beam parameters, VLA configuration, frequency (20 cm 1.4 GHz and 6 cm 4.8 GHz), flux density, and one sigma errors. The WSRT data from de Bruyn (1983), the published VLA data from Seaquist & Bignell (1978), Bignell & Seaquist (1983), and Johnson et al. 2006 are also included in Table 1. The WSRT data (Table 1) are taken from only de Bruyn (1983), in which the WSRT data were corrected to the Baars et al. (1977) flux density scale. In addition, the observations from de Bruyn et al. (1981) were corrected for radio confusion arising from a nearby H II region. De Bruyn (1983) notes that the confusion in the 7″ WSRT beam at 6 cm is mJy. For the lower frequency VLA data (1.4 to 5 GHz), the effects of a confusing source of 380 mJy at 20 cm located 8′ to the southwest of J1228+441 must be subtracted in the imaging process. The confusing source is located at . For the spectral line observations at H I (1.420 GHz) and OH (1.720) GHz only the continuum channels were used.
3 Time Dependent Decline of Radio Emission
The flux density of J1228+441 has declined gradually over 30 years (1972 to 2002). The 20 cm and 6 cm light curves presented in Figure 2 clearly demonstrate a decline in the radio emission at both frequencies. De Bruyn (1983) suggested that, in addition to the smooth decline of radio emission, there were possible small variations from a smooth decline. The VLA data at 6 cm presented in this paper suggest that variations of 0.70.3 mJy over short time scales (two to three years) may be present in addition to the overall smooth decline, but the evidence for the short-time scale deviations from a smooth decline is only at a level of 2.
4 Evolution of the Spectral Index
De Bruyn, Goss, & van Woerden (1981) compared their 5GHz measurements with Seaquist and Bignell (1978) and found that J1228+441 must have undergone significant variability in order to explain the variability in spectral index measurements. De Bruyn, Goss, & van Woerden (1981) speculated that the spectral index varied with a timescale of a few years. Bignell & Seaquist (1983) also found that the spectral index must have changed from the earliest value of to 0.62, which was flatter.
Table 2 lists the dates and the spectral index, , based on two frequencies that were observed within an interval of 8 - 16 months. Figure 3 displays the spectral index calculated from two frequencies for J1228+441 over the time period 1972 to 2002. The spectral index is variable from 1972 until 1982 as noted by De Bruyn, Goss, & van Woerden (1981). This early period is characterized by the largest flux density errors and the 6 cm (4.8 GHz) flux density varies from mJy in 1973, to an upper limit of mJy in 1973, to mJy in 1974. The spectral index has a relatively constant value of from 1982 to 1996. This period has high sensitivity VLA data and the 6 and 20 cm were observed on the same day, which eliminates temporal effects from the determination of the spectral index. The spectral index then steepens to 1.0 0.02 in 2001 – 2002. In 2001– 2002, a 22 GHz and a 4.9 GHz frequency observation provided the most reliable measure of the spectral index since the frequency range covers an order of magnitude. In summary, analysis of Figure 3 shows an essentially constant value from 1980 through 1997, with possible small scale variations at the 1 – 2 level with a period of two to three years. After 1997, the spectral index steepens.
The spectrum of J1228+441 is shown in Figure 4 at three epochs: 1982, 1996, and 2001-2002. The fitted values of shown in Figure 4 are: in 1982, in 1996, and in 2001-2002. The spectrum of J1228+441 is only shown for cases in which three or more observations at substantially different frequencies were available within a time range of 8 months for the spectra in 1994 and 1996 and within a time range of 16 months for the 2001-2002 spectrum. As expected, the early spectra exhibit a higher flux density for each frequency than the later epoch spectra. In addition, the 2001-2002 epoch spectrum displays a steepening that is also reflected in the steepening of the spectral index (see Figure 3), providing additional support that the spectral index is steepening and that the steepening is not just due to the time difference between the observations in 2001-2002.
Montes et al. (2000) also reported spectral index variations for the radio SN 1979C (see Section 6 for a discussion of the differences between radio SNe and SNRs); the spectral index both steepened and flattened over time scales on the order of 365 days for the time period between 4300 – 7100 days after the explosion. Unfortunately, a scarcity of high frequency observations and adequate time coverage of the radio emission from SN 1979C during this period prevented the testing of hypotheses concerning the mechanism responsible for the spectral index variations. Both J1228+441 and SN 1979C highlight the need for future observations of both objects over closely spaced time intervals covering the full radio frequency range in order to fully confirm the magnitude and time scale of the small-scale variations.
The steepening of the spectrum of J1228+441 is most likely caused by synchrotron or inverse Compton radiation losses, possibly augmented by the effects of adiabatic expansion. Extensive multi-wavelength monitoring of J1228+331 over an extended period of time is required in order to produce spectra with enough precision to confirm the spectral steepening and identify the time period over which the spectral index changes. More precise determinations of the radio spectra are required in order to determine the mechanism that is responsible for the likely spectral steepening.
5 Discussion
The fractional decline rate, , can be calculated for both the 6 cm and 20 cm data from 1975 to 2001 using the relation. We find rates: 0.4% per year at 6 cm and 0.6% per year at 20 cm. The high sensitivity VLA observations dominate the estimate of the fractional decline rate. The decline of J1228+441 is well fit by a constant fractional decline rate; there is no evidence that this rate has changed over the 25 years of observations. These rates are noticeably less than the rate of per year at 6 cm found by de Bruyn, Goss, & van Woerden (1981) for a shorter interval of 1975 to 1981. The decline rate of J1228+441 is similar to that of Cas A, which is -1.3% per year for the radio ring (Tuffs 1986) for the period of 1974 to 1978, and much larger than that of the Crab Nebula, which is -0.17 % 0.02 % per year for the period of 1968 to 1984 (Aller & Reynolds 1985).
If the flux density evolution is described by , where is the time since the explosion, then is just multiplied by the age of the remnant (de Bruyn, Goss, & van Woerden 1981). Since the age of J1228+441 is not well known, we give at 6 cm for a range of ages: for an age of t=100 yrs, ; for an age of 150 years, ; and for an age of 200 yrs, . Similarly, for 20 cm we find: for an age of t=100 yrs, ; for an age of 150 years, ; and for an age of 200 yrs, . The values of calculated for different ages of J1228+441 vary significantly due to the large error in the age and, thus, are not useful without a better estimate of the age.
6 J1228+441 Compared with the Oldest Radio SNe
There is some ambiguity in the classification of radio supernovae and SNRs. Supernovae are objects that are generally discovered at optical wavelengths soon after the initial explosion. The explosion date of a SN is often known very precisely with current SN monitoring programs and all supernovae are characterized by a light curve that over time exhibits an initial rise in the emission, a peak, and then a gradual decline. Radio emission from optically identified SNe arises from the interaction of the supernova shock with the circumstellar medium (CSM) that was initially created by the progenitor star. The CSM originates from the stellar winds of the red supergiant phase of the progenitor star and typically expands with speeds around 10 km s-1, which allows the much faster supernova shock to overrun the CSM. The rise and decline of radio emission due to the CSM interaction with the shock has been modeled (Weiler et al. 2002 and references therein). Radio SNRs are primarily objects that have ages of 300 – 10,000 years and a typical radio SNR produces radio emission arising from the interaction of the shock with plowed up interstellar material. The youngest radio SNRs, e.g. the Crab Nebula and Cas A, show small declines in radio emission of a few percent per year. Very few SNRs have known explosion dates; the few that are known, such as the Crab Nebula, are known due to historical records and measurements of shock expansion speeds. In the Milky Way Galaxy, a supernova has not occurred in the last 200 years and the youngest Galactic SNR, Cas A, exploded in the late 17th century with some uncertainty as to the exact explosion date (Thorstensen, Fesen, & van den Bergh 2001). The currently known supernovae are all extragalactic in origin. The transition between the CSM dominated phase of a radio SN to the ISM dominated phase of a radio SNR has not been observed and the transition is predicted to depend on the CSM and the ISM distributions. The environment, in particular the density and distribution of the ISM, of a SNR greatly affects the ability of a SNR to produce radio emission (Lacey and Duric 2001).
SN 1957D and SN 1950B in M83 and SN 1970G in M101 are radio supernovae whose radio emission has been identified and monitored for at least three decades. SN 1961V in NGC 1058 was initially identified as a peculiar SN, but the exact nature of SN 1961V is still uncertain (Chu et al. 2004). We compared J1228+441 with the young Galactic SNRs, the Crab and Cas A, in Section 5. Since J1228+441 has declining radio emission, it is natural to compare this object with other older radio supernovae. Table 3 shows the basic properties of J1228+441 compared with SN 1957D, SN 1950B, and SN 1970G.
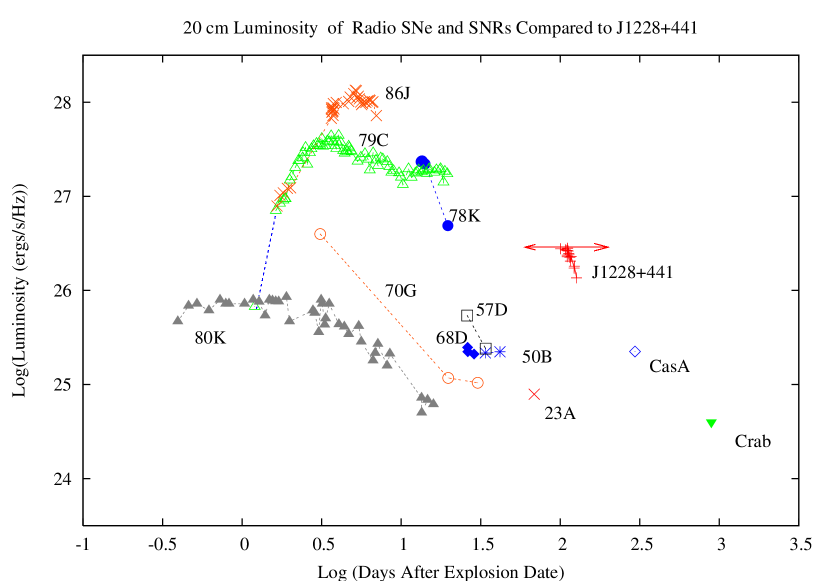
Figure 5 compares J1228+441 with other core collapse extragalactic radio supernovae and young Galactic supernova remnants in a figure adapted from Stockdale et al. (2001). In order to compare J1228+441 with other supernovae and supernova remnants, the age of J1228+441 was assumed to be 100 years (explosion date 1900 AD, see the discussion of this uncertainty in Section 1) and the luminosity was calculated using the same model as Stockdale et al. (2001). The current luminosity of J1228+441 is comparable to the peak luminosity of SN 1970G and higher than the current luminosities of two Galactic SNRs, Cas A and the Crab. While J1228+441 currently appears in the middle range of the radio supernovae luminosities in Figure 5, the actual peak luminosity of J1228+441 is unknown; its true peak luminosity on Figure 5 could be higher and could be comparable to the peak luminosities of SN 1979C, SN 1986J, and SN 1978K. It is tempting to speculate that J1228+441 occupies a transition region between radio supernovae and young Galactic core-collapse SNRs, but this transition region is due mostly to the historical classification of the Crab and Cas A and may not represent a significant difference or transition in the physical properties between SNe and SNRs.
Cowan, Goss & Sramak (1991) and Stockdale et al. (2001) observed SN 1970G with the VLA in 1990 and 2000, respectively. These VLA observations of SN 1970G were combined with previous WSRT observations by Gottesman et al. (1972) and Allen et al. (1976) in 1971 through 1975 so that SN 1970G was observed over a three decade period similar to the time interval of J1228+441. Both J1228+441 and SN 1970G have experienced changes in the spectral index; the spectral index of J1228+441 has steepened from 0.65 in 1996 to 1.0 in 2001-2002 while the spectral index of SN 1970G has flattened from 0.560.11 in 1990 to 0.240.20 in 2000 (Stockdale et al. 2001).
From the data in Stockdale et al. (2001) and Cowan, Goss, and Sramek (1991), the fractional decline rate for SN 1970G can be calculated for the two periods with different spectral indices that Stockdale et al. (2001) identified. Between 1973 and 1991, the decline rate for SN 1970G at 20 cm was per year and between 1991 and 2001, per year. The fractional decline rate of J1228+441, = -2.8% 0.6% per year at 20 cm, is intermediate to the two values found for SN 1970G.
Stockdale et al. (2001) suggest that the change in for SN 1970G could be due to changes in the CSM density. The radio supernova, SN 1993J, has also shown a flattening of the spectral index at 8 years of age, caused by changes in the deceleration rate of the shock (Bartel et al. 2002). Given that J1228+441 is interacting with a nearby H II region (Blair, Kirshner, & Winkler 1983), the density profile of the CSM and ISM environment that the remnant shock is encountering is likely to be complex, which could cause future changes in the deceleration rate of the shock and the fractional decline rate.
7 Summary
The light curve of J1228+441 shows a significant decline at 6 and 20 cms with a fractional decline rate of = -2.3% 0.4% per year at 6 cm and = -2.8% 0.6% per year at 20 cm over the time interval 1975 to 2001. In the epoch 2001- 2002, a significant steepening of the spectral index was observed. The spectral index steepened from from 1982 to 1996 to in 2001-2002. The spectrum of J1228+441 also steepened in 2001-2002.
As J1228+441 continues to evolve, additional monitoring at radio, X-ray, and optical wavelengths over multiple epochs is needed in order to follow the evolution and determine the properties of this young SNR. Further monitoring at multiple radio frequencies, with the multiple frequencies observed on the same day, are required to better define the light curve. Future changes in the spectral index and the fractional decline rate could occur if expansion velocities and deceleration rates change as the shock encounters changes in the density profiles of the CSM and ISM. Additional optical spectroscopy will yield shock velocities, deceleration rates, and determine the evolutionary stage and aid in the interpretation of the radio observations.
8 References
Allen, R. J., Goss, W. M., Ekers, R. D., & de Bruyn, A. G. 1976, A&A, 48, 253
Aller, H.D. & Reynolds, S.P. 1985, ApJ, 293L, 73
Anderson, M.C. & Rudnick, L. 1995, ApJ, 441, 300
Baars, J. W. M., Genzel, R., Pauliny-Toth, I.I.K., & Witzel, A., 1977, A&A, 61, 99
Bajaja, E., Huchtmeier, W. K., & Klein, U. 1994, A&A, 285, 385
Balick, B. & Heckman, T. 1978, ApJ, 226, L5
Bartel N., Bietenholz, M. F., Rupen, M. P., Beasley, A.J., Graham, Da.A., Altunun, V.I., Venturi, T., Umana, G., Cannon, W.H., & Conway, J.E. 2002, ApJ, 581, 404
Blair,W.P., Raymond, J.C., Fesen, R.A., & Gull, T.R. 1984, ApJ, 279, 708
Blair, W.P., Kirshner, R. P., & Winkler, P.F., Jr, 1983, ApJ, 272, 84
Blair, W. P. 2006, Private communication
Blair, W.P. & Fesen, R.A., 1998, BAAS, 193, 7404
Bignell, R.C. & Seaquist, E.R., 1983, ApJ, 270, 140
Chu, Y.-H., Gruendl, R. A., Stockdale, C. J., Rupen, M. P., Cowan, J. J., & Teare, S. W., 2004, AJ, 127, 2850 Condon, J. & Yin, ApJ, 357, 97, 1990
Cowan, J. J., Goss, W. M., & Sramek, R. A., 1991, ApJ, 379L, 49
Cowan, J.J. & Branch, D., 1982, ApJ, 258, 31
de Bruyn, A.G., 1983, A&A, 119,301
de Bruyn, A.G., Goss, W. M., &, van Woerden, H., 1981, A&A, 94, L25
de Vaucouleurs, G. 1975, in Galaxies and the Universe, ed. A. Sandage, M. Sandage, & J. Kristian (Chicago: Univ. Chicago Press), 557
Eck, C. R., Roberts, D. A., Cowan, J. J., & Branch, D., 1998, ApJ, 508, 664
Fabbiano, G., Kim D.-W., & Trinchieri, G., 1992, ApJS, 80, 531
Goss, W. M., Allen, R. J., Ekers, R. D., & de Bruyn, A. G., 1973, A&A, 243, 42
Gottesman, S. T., Broderick, J. J., Brown, R. L., Balick, B., & Palmer, P. 1972, ApJ, 174, 383
Hunter, D.A., van Woerden, H., & Gallagher, J. S., 1999, AJ, 118, 2184
Hunter, D.A., Wilcots, E.M., van Woerden, H., Gallagher, J. S., & Kohle, S., 1998, ApJ, 495L, 47
Johnson, K. E. et al., 2006, in preparation.
Kirshner, R. P. & Blair, W. P. 1980, ApJ, 236, 135
Lacey et al. 2006, in preparation.
Lacey, C. K. & Duric, N., 2001, ApJ, 560, 719
Long, K. S, Winkler, P. F., & Blair, W. P., 1992, ApJ, 395, 632
Montes, M. J., Weiler, K. W., van Dyk, S.D., Panagia, N., Lacey, C.K., Sramek, R.A., & Park, R., 2000, ApJ, 532, 1124
Patnaude, D. J., & Fesen, R.A. 2003, ApJ, 587, 221
Pennington, R. L. & Dufour, R. J., 1983, ApJ, 270L, 7
Sandage, A. & Katem, B. 1976, AJ, 81, 743
Seaquist, E.R. & Bignell, R.C., 1978, ApJ, 226, L5
Stockdale, C. J., Goss, W. M., Cowan, J. J., & Sramek, R. A., 2001, ApJ, 559, 139
Stockdale, C. J., Maddox, L.A., Cowan, J. J., Prestwich, A., Kilgard, R., & Immler, S., 2006, ApJ, 131, 889.
Stockdale, C. J., Sramek., R. A., Williams, C. L., Van Dyk, S. D., Weiler, K. W. , & Panagia, N., 2006a, New Radio Supernova Results.
Summers,L.K., Stevens, I.R., Strickland, D.K. & Heckman, T.M., 2003, MNRAS, 342, 690
Thorstensen, Fesen, & van den Bergh, 2001, AJ, 122, 297
Tuffs, R.J., 1986, MNRAS, 219, 13
Vögler, A. & Pietsch, W. 1997, A&A, 319, 459
Weiler, K. W., Panagia, N., Montes, M. J., & Sramek, R. A., 2002, ARA&A, 40, 387


| Observing | Telescope | RMS Noise | Beam Size | PA | VLA | Frequency | Flux Density | Error |
|---|---|---|---|---|---|---|---|---|
| Date | (mJy/bm) | (″x ″) | (°) | Configuration | (GHz) | (mJy) | (mJy) | |
| 1972 Aug. 01 | WSRTbbDe Bruyn, 1983, A&A, 119, 301 | 1.5 | 24 x 34 | - | 1.420 | 15.3 | 2.0 | |
| 1973 Feb. 22 | WSRTbbDe Bruyn, 1983, A&A, 119, 301 | 3.0 | 7 x 10 | - | 4.995 | 13.0 | 2.0 | |
| 1973 Nov. 24 | WSRTbbDe Bruyn, 1983, A&A, 119, 301 | 3.0 | 7 x 10 | - | 4.995 | 8.5 | ||
| 1974 May 24 | WSRTbbDe Bruyn, 1983, A&A, 119, 301 | 0.8 | 7 x 10 | - | 4.995 | 10.9 | -2.1, +2.9 | |
| 1975 Mar. 23 | WSRTbbDe Bruyn, 1983, A&A, 119, 301 | 2.3 | 56 x 80 | - | 0.61 | 25.5 | 10 | |
| 1979 May 02 | WSRTbbDe Bruyn, 1983, A&A, 119, 301 | 0.4 | 7 x 10 | - | 4.995 | 8.8 | -0.6, +0.8 | |
| 1979 Oct. 08 | Published VLAccBignell et al., 1983, ApJ, 270, 140 | 1.2 | 1.8 x 1.8 | Mixed | 1.479 | 14.9 | 1.2 | |
| 1979 Oct. 08 | Published VLAccBignell et al., 1983, ApJ, 270, 140 | 0.15 | 0.7 x 0.5 | Mixed | 4.900 | 6.8 | -0.2, +0.6 | |
| 1980 Jan. 23 | WSRTbbDe Bruyn, 1983, A&A, 119, 301 | 0.35 | 7 x 10 | - | 4.995 | 8.6 | -0.5, +0.7 | |
| 1980 Jun. 07 | WSRTbbDe Bruyn, 1983, A&A, 119, 301 | 1.5 | 7 x 10 | - | 4.874 | 7.6 | 1.6 | |
| 1980 Oct. 22 | WSRTbbDe Bruyn, 1983, A&A, 119, 301 | 7 x 10 | - | 4.995 | 6.4 | 1.6 | ||
| 1981 Apr. 03 | WSRTbbDe Bruyn, 1983, A&A, 119, 301 | 7 x 10 | - | 4.995 | 7.1 | 1.0 | ||
| 1981 May 24 | WSRTbbDe Bruyn, 1983, A&A, 119, 301 | 7 x 10 | - | 4.995 | 6.8 | 1.0 | ||
| 1981 Aug. 05 | Published VLAccBignell et al., 1983, ApJ, 270, 140 | 0.19 | 1.6 x 1.2 | B | 4.885 | 5.6 | -0.2, +0.5 | |
| 1981 Oct. 01 | Published VLAccBignell et al., 1983, ApJ, 270, 140 | 0.17 | 15.8 x 11.5 | D | 4.885 | 7.9 | 0.2 | |
| 1982 Feb. 02 | Published VLAccBignell et al., 1983, ApJ, 270, 140 | 0.3 | 0.12 x 0.11 | A | 14.965 | 2.9 | -0.3, +0.6 | |
| 1982 Feb. 11 | Published VLAccBignell et al., 1983, ApJ, 270, 140 | 0.27 | 1.0 x 1.0 | A | 1.465 | 14.7 | -0.3, +0.4 | |
| 1982 Feb. 11 | Published VLAccBignell et al., 1983, ApJ, 270, 140 | 0.15 | 0.34 x 0.31 | A | 4.885 | 6.7 | -0.2, +0.6 | |
| 1982 Apr. 11 | WSRTbbDe Bruyn, 1983, A&A, 119, 301 | 7 x 10 | - | 4.995 | 6.7 | 1.0 | ||
| 1982 Jun. 25 | VLA Archive | 0.12 | 1.3 x 1.1 | -18 | A | 1.465 | 14.7 | 0.2 |
| 1982 Jul. 13 | VLA Archive | 0.4 | 4.8 x 3.7 | -11 | BnA | 1.465 | 12.6 | 0.5 |
| 1982 Jul. 13 | VLA Archive | 0.12 | 1.5 x 1.1 | 5 | BnA | 4.885 | 6.9 | 0.1 |
| 1982 Oct. 17 | VLA Archive | 0.2 | 4.1 x 3.7 | -21 | B | 1.446 | 13.1 | 0.7 |
| 1983 Mar. 25 | VLA Archive | 0.3 | 15.1 x 12.5 | 58 | C | 1.452 | 15.5 | 1.2 |
| 1983 Mar. 25 | VLA Archive | 0.1 | 4.7 x 3.0 | 71 | C | 4.873 | 7.3 | 0.1 |
| 1983 Aug. 25 | VLA Archive | 0.066 | 0.38 x 0.34 | -19 | A | 4.873 | 6.77 | 0.07 |
| 1984 Feb. 10 | VLA Archive | 0.27 | 4.6 x 4.0 | 68 | B | 1.490 | 14.5 | 0.35 |
| 1984 Feb. 10 | VLA Archive | 0.08 | 1.4 x 1.2 | 62 | B | 4.860 | 5.97 | 0.08 |
| 1984 Dec. 12 | VLA Archive | 0.29 | 1.4 x 1.3 | -24 | A | 1.490 | 13.6 | 0.3 |
| 1984 Dec. 12 | VLA Archive | 0.14 | 0.41 x 0.40 | -24 | A | 4.860 | 6.4 | 0.1 |
| 1985 May 02 | VLA Archive | 0.24 | 4.5 x 3.7 | 55 | B | 1.490 | 13.2 | 0.2 |
| 1985 May 02 | VLA Archive | 0.083 | 1.4 x 1.1 | 56 | B | 4.860 | 5.95 | 0.08 |
| 1986 Dec. 03 | VLA Archive | 0.36 | 15.1 x 12.7 | 58 | C | 1.490 | 12.4 | 0.8 |
| 1986 Dec. 03 | VLA Archive | 0.06 | 4.5 x 4.1 | -86 | C | 4.860 | 6.02 | 0.07 |
| 1987 Oct. 15 | VLA Archive | 0.21 | 3.5 x 1.4 | -60 | BnA | 1.490 | 11.3 | 0.3 |
| 1987 Oct. 15 | VLA Archive | 0.075 | 1.2 x 0.39 | -61 | BnA | 4.860 | 6.09 | 0.08 |
| 1988 Jan. 17 | VLA Archive | 0.14 | 1.3 x 1.3 | -61 | B | 4.873 | 5.0 | 0.15 |
| 1988 Feb. 12 | VLA Archive | 0.18 | 3.9 x 1.6 | 75 | CnB | 4.873 | 5.6 | 0.2 |
| 1988 May 26 | VLA Archive | 0.065 | 9.0 x 4.4 | 77 | DnC | 4.873 | 5.35 | 0.4 |
| 1988 Dec. 30 | VLA Archive | 0.22 | 1.6 x 1.2 | 81 | A | 1.490 | 12.7 | 0.5 |
| 1989 Mar. 13 | VLA Archive | 0.088 | 1.3 x 1.2 | -71 | B | 4.860 | 5.62 | 0.11 |
| 1990 Jul. 29 | VLA Archive | 0.24 | 1.4 x 1.2 | 45 | B | 4.860 | 5.9 | 0.3 |
| 1991 Dec. 06 | VLA Archive | 0.12 | 1.3 x 1.2 | -33 | B | 4.860 | 4.9 | 0.15 |
| 1994 Mar. 30 | VLA this paper | 0.026 | 1.3 x 1.2 | 86 | A | 1.460 | 9.55 | 0.03 |
| 1994 May 07 | VLA Archive | 0.25 | 0.71 x 0.41 | -52 | AB | 4.873 | 5.4 | 0.5 |
| 1994 Jun. 16 | VLA this paper | 0.028 | 2.42 x 1.39 | 82 | B | 4.860 | 4.22 | 0.03 |
| 1994 Sep. 05 | VLA Archive | 0.18 | 4.8 x 4.1 | 71 | B | 1.420 | 10.0 | 0.3 |
| 1996 Sep. 01 | VLA Archive | 0.016 | 13.4 x 12.1 | 83 | D | 4.860 | 4.71 | 0.2 |
| 1996 Sep. 01 | VLA Archive | 0.015 | 8.3 x 7.1 | -88 | D | 8.460 | 3.25 | 0.05 |
| 1996 Oct. 18 | VLA Archive | 0.22 | 0.19 x 0.19 | -45 | A | 14.940 | 2.3 | 0.5 |
| 1998 Sep. 14 | VLA Archive | 0.093 | 3.9 x 3.5 | 73 | B | 1.719 | 7.5 | 0.09 |
| 2001dd2001 Apr. 7, 2001 May 17, 2001 Jun 29, 2001 Sep. 1 | VLAeeJohnson et al., 2006, in preparation | 0.011 | 0.86 x 0.81 | 53 | B,BC,C | 8.460 | 2.53 | 0.01 |
| 2002 Feb. 16 | VLAeeJohnson et al., 2006, in preparation | 0.04 | 0.42 x 0.36 | -89 | A | 4.860 | 4.0 | 0.06 |
| 2002 Nov. 15 | VLAeeJohnson et al., 2006, in preparation | 0.039 | 1.03 x 0.08 | 78 | C | 22.460 | 0.86 | 0.07 |
| Date1 | Date2 | (GHz) | (GHz) | Error | |
|---|---|---|---|---|---|
| 1975 Mar 23 | 1974 May 24 | 0.610 | 4.995 | 0.40 | 0.23 |
| 1979 Oct 8 | 1979 May 2 | 1.479 | 4.885 | 0.44 | 0.10 |
| 1979 Oct 8 | 1979 Oct 8 | 1.479 | 4.900 | 0.65 | 0.10 |
| 1979 Oct 8 | 1979 May 2 | 1.479 | 4.995 | 0.43 | 0.10 |
| 1982 Feb 11 | 1982 Feb 11 | 1.465 | 4.885 | 0.65 | 0.08 |
| 1982 Feb 11 | 1982 Feb 23 | 4.885 | 14.965 | 0.75 | 0.20 |
| 1982 Jul 13 | 1982 Jul 13 | 1.465 | 4.885 | 0.50 | 0.04 |
| 1984 Feb 10 | 1984 Feb 10 | 1.490 | 4.860 | 0.75 | 0.02 |
| 1984 Dec 12 | 1984 Dec 12 | 1.490 | 4.860 | 0.64 | 0.02 |
| 1985 May 2 | 1985 May 2 | 1.490 | 4.860 | 0.67 | 0.02 |
| 1986 Dec 3 | 1986 Dec 3 | 1.490 | 4.860 | 0.61 | 0.06 |
| 1987 Oct 15 | 1987 Oct 15 | 1.490 | 4.860 | 0.52 | 0.03 |
| 1988 Dec 30 | 1988 May 26 | 1.490 | 4.873 | 0.73 | 0.07 |
| 1988 Dec 30 | 1988 Feb 12 | 1.490 | 4.873 | 0.69 | 0.04 |
| 1988 Dec 30 | 1988 Jan 17 | 1.490 | 4.873 | 0.79 | 0.04 |
| 1988 Dec 30 | 1989 Mar 13 | 1.490 | 4.873 | 0.69 | 0.04 |
| 1994 Mar 30 | 1994 May 7 | 1.460 | 4.873 | 0.47 | 0.08 |
| 1994 Sep 5 | 1994 Jun 16 | 1.420 | 4.860 | 0.70 | 0.03 |
| 1996 Sep 1 | 1996 Oct 18 | 4.860 | 14.940 | 0.64 | 0.20 |
| 1996 Sep 1 | 1996 Oct 18 | 8.460 | 14.940 | 0.61 | 0.38 |
| 2002 Feb 16 | 2001 Jun 29 | 4.860 | 8.460 | 0.83 | 0.03 |
| 2002 Feb 16 | 2002 Nov 15 | 4.860 | 22.460 | 1.00 | 0.05 |
| 2001 Jun 29 | 2002 Nov 15 | 8.460 | 22.460 | 1.11 | 0.08 |
| Parameter | SN 1970G | SN 1957D | SN 1950B | J1228+441 |
|---|---|---|---|---|
| Distance (Mpc) | 7.4 | 4.1 | 4.1 | 3.9 |
| Peak 20 cm Flux density (mJy) | 5.9 1.6 | 2.7 0.12 | 0.7 0.08 | 14.9 1.2bb Peak flux density for J1228+441 is not known. The current maximum observed flux density is quoted here. |
| Supernova age (yr) | 19.74 | 25.24 | 33.00 | 100 |
| Luminosity (ergs s-1 Hz-1) | 4.0 | 5.3 | 1.4 | 2.8 |
| Peak 6 cm Flux density (mJy) | 0.12 0.020 | 1.39 0.04 | 0.37 0.03 | 4.0 0.06bb Peak flux density for J1228+441 is not known. The current maximum observed flux density is quoted here. |
| Supernova age (yr) | 30.50 | 32.82 | 40.58 | 100 |
| Luminosity (ergs s-1 Hz-1) | 7.9 | 2.8 | 7.4 | 7.6 |
| Most recent spectral index | 0.24 0.20 | 0.11 0.06 | 0.57 0.08 | 1.0 0.02cc , based on 22.4 , 8.46, and 4.86 GHz observations obtained in 2001-2002. |
| Earlier spectral index | 0.56 0.11dd based on 1.4 GHz and 8.5 GHz observations (Stockdale et al. 2001). | 0.23 0.04 | 0.55 0.13 | 0.65 0.02eeAverage from 1982 through 1997. |