Hot halos around high redshift protogalaxies
Abstract
Aims. We present a study of the highly ionized gas (plasma) associated with damped Lyman- (DLA) systems at =2.1–3.1.
Methods. We search for O vi absorption and corresponding Si iv, C iv, and N v in a Very Large Telescope/Ultraviolet-Visible Echelle Spectrograph (VLT/UVES) sample of 35 DLA systems with data covering O vi at S/N10. We then use optical depth profile comparisons and ionization modelling to investigate the properties, phase structure, and origin of the plasma.
Results. We report twelve DLAs (nine intervening and three at 5 000 km s-1 from the QSO redshift) with detections of O vi absorption. There are no clear O vi non-detections, so the incidence of O vi in DLAs is between 34% (12/35) and 100%. Among these 12 DLAs, C iv and Si iv are seen whenever data is available, and N v is detected in 3 cases. Analysis of the line widths together with photoionization modelling suggests that two phases of DLA plasma exist: a hot, collisionally ionized phase (seen in broad O vi components), and a warm, photoionized phase (seen just in narrow C iv and Si iv components). The presence of inflows and/or outflows is indicated by individual O vi and C iv components displaced from the neutral gas (either blueshifted or redshifted) by up to 400 km s-1. We find tentative evidence (98% confidence) for correlations between the DLA metallicity (measured in the neutral gas) and high-ion column density, and between the DLA metallicity and high-ion line width, as would be expected if supernova-driven galactic outflows rather than accretion produced the high ions. Using conservative ionization corrections, we find lower limits to the total hydrogen column densities in the hot (O vi-bearing) and warm (C iv-bearing) phases in the range log to , and log to . On average, the hot and warm phases thus contain 40% and 20% of the baryonic mass of the neutral phase in DLAs, respectively.
Conclusions. If the temperature in the O vi phase is K and so , the plasma can make a significant contribution to the metal budget at high redshift. Additional searches for O vi in Lyman Limit Systems (QSO absorbers with ) will be necessary to determine the total quantity of baryons and metals hidden in hot halos at .
Key Words.:
quasars: absorption lines – cosmology: observations – galaxies: high-redshift – galaxies: halos – galaxies: ISM1 Introduction
Damped Lyman- (DLA) systems, defined as those QSO absorbers with H i column densities cm-2, represent the largest reservoirs of neutral gas in the redshift range 0–5, and are believed to be the precursors to modern day disk galaxies (see recent review by Wolfe, Gawiser, & Prochaska 2005). Detailed abundance studies of these systems at various redshifts (Prochaska & Wolfe 2002; Dessauges-Zavadsky et al. 2004, 2006) have provided a means to trace the process of cosmic metal enrichment over a large fraction of the age of the Universe.
In addition to the neutral gas phase, spectroscopic observations of DLAs have revealed both cold molecular ( K; Petitjean et al. 2000; Ledoux et al. 2003; Srianand et al. 2005) and warm ionized ( K; Lu et al. 1996; Ledoux et al. 1998; Wolfe & Prochaska 2000a) components, with a multi-phase structure resembling that seen in the Galactic interstellar medium (ISM). However, very little is known about the presence or properties of a hot ( K)111There is some disagreement in the ISM and IGM literature about the meaning of the terms “warm” and “hot”. X-ray astronomers do not consider any gas below K hot, and IGM astronomers now have adopted the term “warm-hot” to describe the regime with to K. However, throughout this paper we use the ISM traditions of “warm” to imply K and “hot” to mean K. ionized medium. Given the evidence for star formation in DLAs (see Wolfe et al. 2005), Type II supernovae should create observable regions of hot, shock-heated interstellar plasma. The separate process of accretion and shock-heating of intergalactic gas may also lead to the production of a hot ionized medium.
The best ultra-violet (UV) lines available for studying hot interstellar plasma are the O vi and N v doublets. O vi (N v) peaks in abundance at K under collisional ionization equilibrium (CIE) conditions (Sutherland & Dopita 1993; Gnat & Sternberg 2006). Surveys of O vi absorption have been used to establish the presence of a hot ionized medium in the Milky Way and its surrounding network of high-velocity clouds (Savage et al. 2003; Sembach et al. 2003; Fox, Savage, & Wakker 2006). Additionally, O vi can be formed by photoionization, as is reported for narrow O vi absorbers in the intergalactic medium (IGM) at (Carswell, Schaye, & Kim 2002; Bergeron et al. 2002; Bergeron & Herbert-Fort 2005; Levshakov et al. 2003). Distinguishing between photoionized and collisionally ionized O vi absorbers is therefore important in searching for a hot ionized medium in DLAs.
O vi absorption has been found before in Lyman Limit Systems (QSO absorbers with log ; Kirkman & Tytler 1997, 1999) but no systematic search for O vi absorption has yet been conducted in DLAs. In this paper we present such a search. In Sect. 2 we discuss the data acquisition and reduction, O vi identification, and absorption line measurements. In Sect. 3 we present the spectra and compare the line profiles, and in Sect. 4 we discuss ionization processes. In Sect. 5 and 6 we discuss the total plasma content in DLAs and its contribution to the cosmic density . In Sect. 7 we briefly speculate on the origins of the O vi phase. We summarize our study in Sect. 8.
2 Data acquisition and handling
2.1 Observations
The VLT/UVES DLA sample currently consists of 123 DLA (log 20.3) and sub-DLA (19.7 log 20.3) systems. All data were acquired with the Ultraviolet-Visible Echelle Spectrograph (UVES) at the 8.2 m Very Large Telescope Unit 2 (VLT/UT2) at Paranal, Chile in the years 2000 to 2006. The data reduction was performed using the interactive pipeline described in Ballester et al. (2000); full details of the reduction procedures are given in Ledoux et al. (2003). The rebinned pixel size is 2 km s-1 and the data have a spectral resolution (FWHM) of 6.6 km s-1 (=45 000).
2.2 Identifying O vi absorption in DLAs
O vi systems are only accessible from the ground at , where the transitions become redshifted enough to pass the atmospheric cutoff near 3000 Å. They lie in the Lyman- forest, the series of intervening H i absorption lines whose number density increases rapidly above (Kim et al. 1997). There is therefore a high level of confusion in separating O vi from H i interlopers, that becomes more difficult with increasing redshift. We thus adopted a series of systematic steps to identify our sample of DLA O vi absorbers, as follows.
(1) We selected from the UVES DLA sample the 35 DLAs with data covering the O vi wavelength range at S/N10 per resolution element222Note that 8 sub-DLAs (or “super-Lyman Limit Systems”) were discarded so as to restrict the sample to genuine DLAs, even though they have O vi coverage and adequate S/N..
(2) We immediately rejected 19 cases where the O vi lines are clearly blended, e.g. by continuous absorption troughs extending over several hundred km s-1.
(3) We searched for O vi components over a range of 500 km s-1 relative to the redshift of the neutral gas in the DLA. If absorption lines were found where the doublet ratio (O vi 1031)/(O vi 1037)=2 in all pixels through the line profile, we made a preliminary identification of O vi. Alternatively, if one O vi line was blended but the other O vi line showed a candidate absorption line, we looked at the C iv data (which exists in most cases), and if the candidate O vi absorber showed a similar line profile to the C iv absorber, we treated the O vi as a preliminary identification.
(4) We investigated whether the preliminary O vi identifications could be caused by intervening Lyman-, Lyman- or Lyman- forest absorbers, by looking in each case for corresponding absorption in the other Lyman series lines and in C iv. If no blending lines were identified, the preliminary O vi detections became real and entered our sample. Four preliminary O vi identifications were identified as being due to intervening H i lines. We are confident that no Lyman- or Lyman- forest interlopers remain in our sample, since in these cases the corresponding Lyman- would be seen in the spectrum. It is more difficult to decontaminate Lyman- absorbers (which are more numerous) since the corresponding higher order Lyman lines often fall outside the observed wavelength range. Therefore, it is possible that some contamination by Lyman- forest absorbers remains in our data.
The problem of reliably discriminating between true high-redshift O vi absorbers and intervening Lyman forest systems is discussed in Burles & Tytler (1996) and Simcoe et al. (2002). Our situation is favorable in that we look for O vi at the redshift where an absorption line system is already known to exist, not in a blind search over redshift. We can crudely assess the probability that a given O vi component is caused by blending using the observed density of Lyman- forest lines. The data presented in Kim et al. (1997) imply a mean separation of Lyman- forest lines (with log ) of 560 km s-1 at =2.17–2.45, and of 360 km s-1 at =2.71–2.30. We adopt an average separation of 400 km s-1 for the purposes of this calculation, ignoring the effects of clustering. The probability of a forest line falling in a 20 km s-1 interval around is . The probability of two blending lines falling at the same velocity, one in O vi 1031 and the other in 1037, or equivalently two blends falling in one O vi line at the velocity of two known components, is , and so on for multiple lines. We find several DLAs with multiple O vi components identified; there is a negligible probability that they are all blends. In other cases there are only one or two components identified; these detections are less secure. To further justify our identification of O vi in each DLA, we present detailed notes on each system in the appendix, which should be consulted together with Figure 1, showing the spectra.
2.3 The resulting sample
After applying our search criteria we are left with 12 O vi detections, of which three are at d= km s-1 from the QSO redshift, and so may be “associated” by the traditional definition (though see Sect. 5.1). C iv and Si iv are seen in every case where data is available, and N v is detected in 3/9 systems with data. The O vi detections cover the redshift range 2.07–3.08, median redshift 2.62, and are observed at S/N levels (per resolution element) in the range 23–41 at the O vi wavelength. The S/N is typically over twice as high near C iv and Si iv. The DLAs span values of log from 20.35 to 21.75, with metallicities [Z/H]Neut (measured from the singly-ionized species in the neutral phase) also spanning two orders of magnitude between 2.59 and 0.49 (Ledoux et al. 2006)333Throughout this paper we use the convention [Z/H]=log()–log()⊙.. The three systems with are toward Q0528–250, Q0841+129, and Q2059–360.
2.4 Incidence of O vi absorption in DLAs
We detect O vi in 12 of 35 DLAs (34%) with O vi coverage. There are no clear O vi non-detections, so the percentage of DLAs with O vi could be 100%. However, we caution that O vi non-detections are difficult to make, due to the high density of forest lines; a conservative estimate of the fraction of DLAs with O vi is thus 34%. Analyzing only the intervening DLAs at 5 000 km s-1 from the quasar redshift, we find that 9 of 31 show O vi, so the incidence of O vi in intervening DLAs is 29%, whereas 3/4 DLAs at 5 000 km s-1 from the quasar redshift show O vi.
2.5 Measurement of absorption
For each DLA we determined by eye the velocity range of absorption (labelled to ) in O vi , Si iv , C iv , N v , and the neutral gas444 Note that the “neutral” phase is traced here through absorption lines from singly-ionized metals; it is so called because hydrogen is predominantly neutral in this phase. The exact range of ions available changes from system to system, due to blending and data availability. Our neutral-phase line for each DLA is adopted from Ledoux et al. (2006), who chose a line with in the strongest component to minimize saturation, where and are the continuum and observed fluxes as a function of velocity.
We fit continua locally to all the lines of interest using low-order (often linear) Legendre polynomials to regions of continuum free from absorption. We then integrated the absorption in each line using the apparent optical depth (AOD) method of Savage & Sembach (1991), which returns measurements of the column density km s-1, where , is the rest wavelength in Angstroms, and is the oscillator strength of the line (taken from Morton 2003). The AOD method also returns measurements of the central velocity of the absorption using the first moment of the optical depth profile, . The treatment of errors arising from statistical (photon noise) and systematic (continuum placement) effects is handled as described in Sembach & Savage (1992). The UVES instrumental resolution of 6.6 km s-1 (FWHM) ensures that lines with km s-1 will be resolved, which is required for the AOD method to give accurate results.
For each line we calculate , the velocity range containing the central 90% of the total integrated optical depth in the line (Prochaska & Wolfe 1997b). For cases where no absorption is seen at the DLA redshift in N v, we present a 3 upper limit to the column density, using the 3 upper limit to the equivalent width, and assuming any absorption to be optically thin. For cases where the line profile is saturated (which we define as where in any pixel within the line profile), we present a lower limit to the column density, and an upper limit to the line width.
We also used the VPFIT software package555Available at http://www.ast.cam.ac.uk/rfc/vpfit.html to derive the absorption line parameters for each high-ion absorber with Voigt profile fits. This provides an independent check of our absorption line measurements. The number of components fit is somewhat subjective; we use the minimum number necessary. We present the measurements using both the AOD and VPFIT techniques in Table 1. Note that the AOD method, which can be fully automated for high efficiency, and has the advantage of not requiring any assumptions about the component structure, generally reproduces the same column density results (within the errors) as the VPFIT method. This indicates that the choice of and by eye is not a significant source of error.
All velocities (in Table 1 and throughout this paper) are quoted relative to the redshift of the neutral gas in the DLA, which is measured using the central velocity of the strongest component of the low-ionization metal absorption in Ledoux et al. (2006). This provides a convenient rest-frame in which to discuss the kinematics of the absorption line profiles.
3 Results
In Fig. 1 we show the absorption line profiles of all the DLA systems with O vi detections. Fig 2. shows the / ratios versus velocity for the ten DLAs in our sample with both O vi and C iv data.
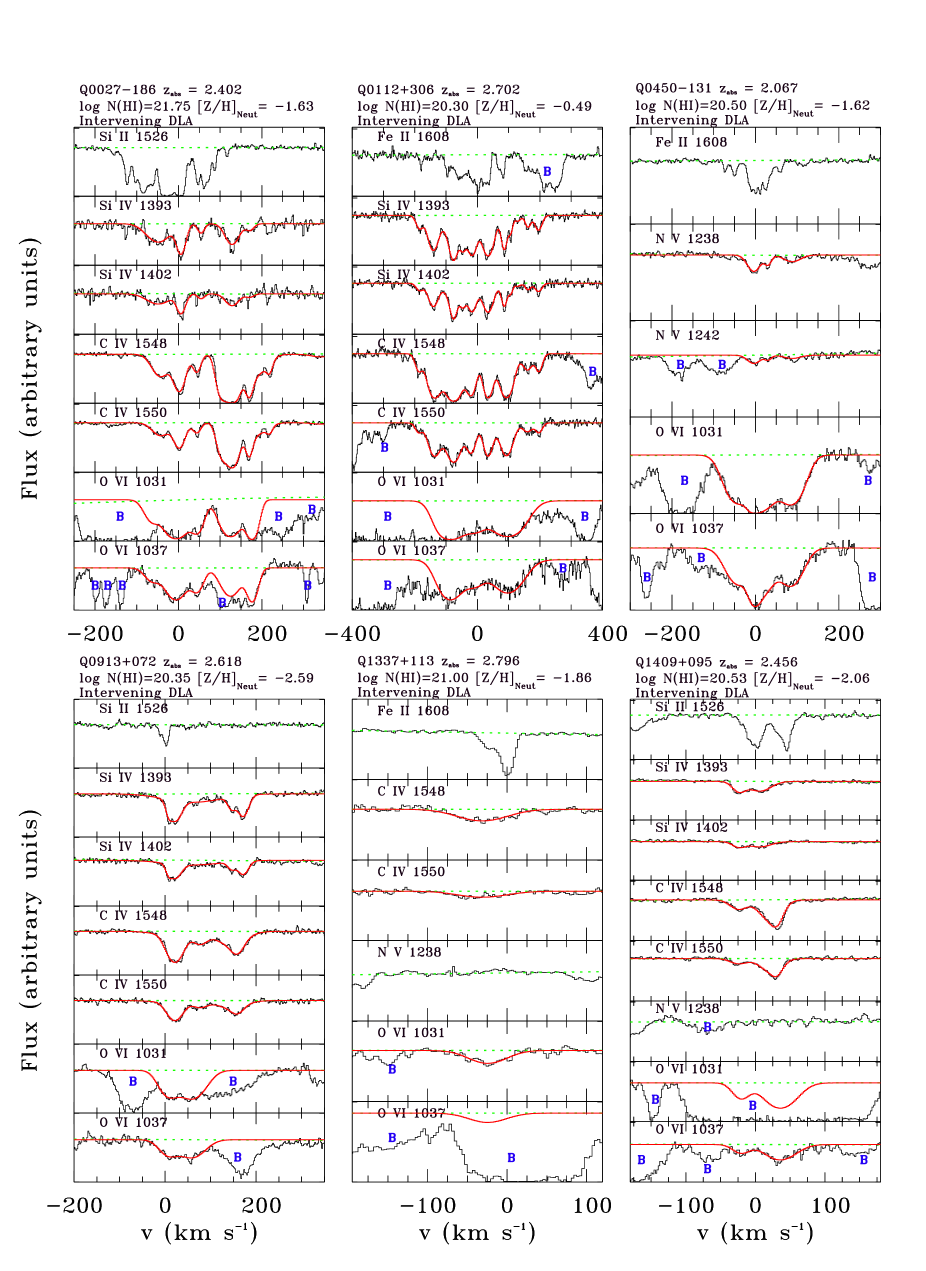
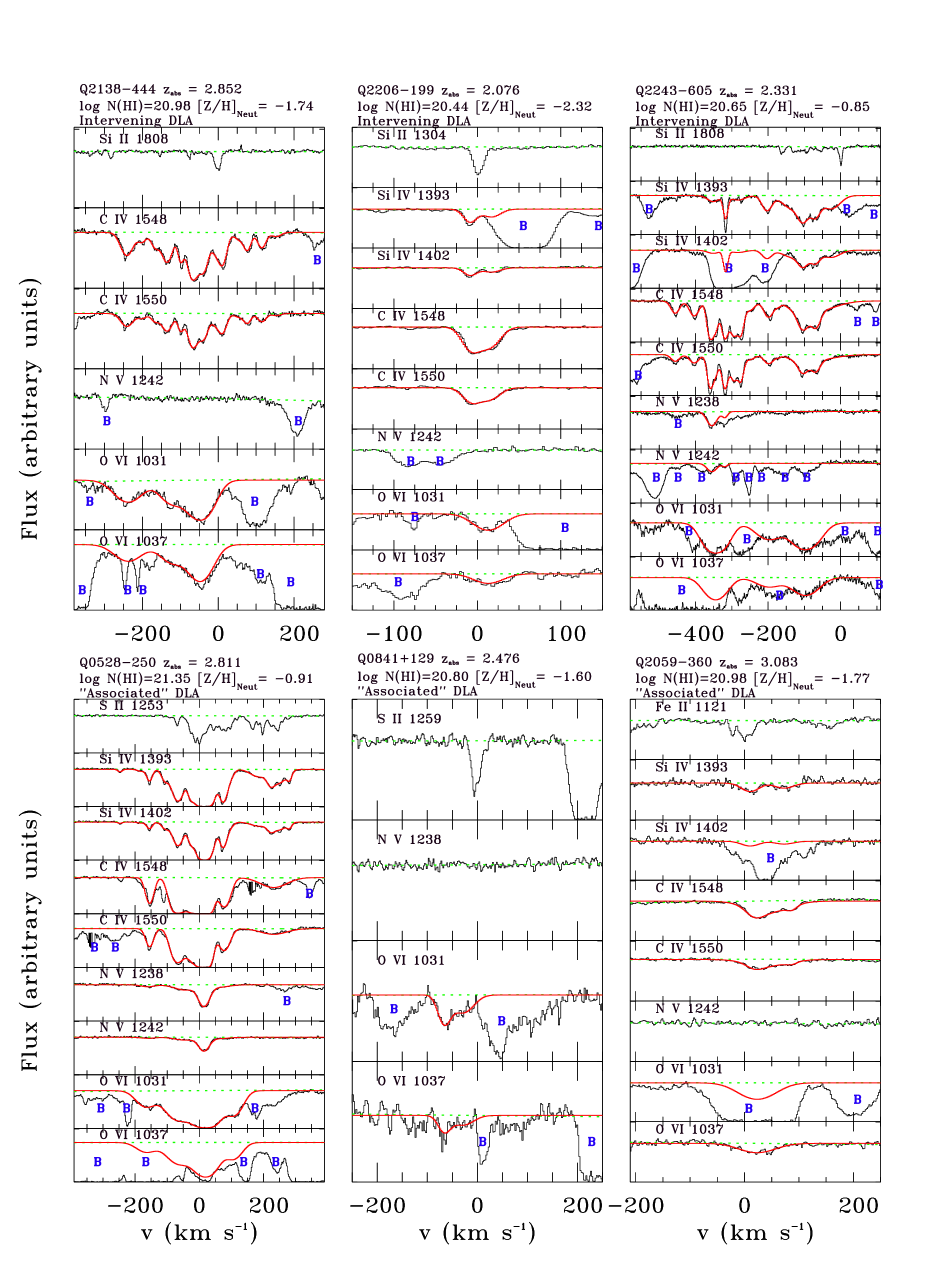

There is considerable variation in the appearance of the highly ionized absorption lines in the DLAs. The O vi absorbers range from cases with a single, optically thin component (e.g. toward Q2059-360 or Q2206-199) to cases with a series of saturated components (e.g. toward Q0450-131 or Q2243-605). The C iv profiles range from cases with one or two components spanning 100 km s-1 to cases with 15 components spanning several hundred km s-1. By no means is it clear that we are looking at a homogeneous sample of objects.
3.1 O vi column density
The logarithmic integrated O vi column density in our 12 detections ranges from 13.66 to 15.15, with a median value of 14.77, a mean of 14.54, and a standard deviation of 0.59. The mean column density is similar to that seen in the “thick disk” of O vi in the Milky Way (Savage et al. 2003), where log ranges from 13.85 to 14.78, with a median value of 14.38. A typical complete sight line through the Milky Way halo also shows O vi high-velocity clouds (HVCs; Sembach et al. 2003; Fox et al. 2006), so a better analogy for DLAs is the total O vi column density through the Milky Way halo over all velocities, which is typically 14.80. The average value of in DLAs is slightly larger than both the Large Magellanic Cloud average of log =14.37 (Howk et al. 2002), and the amount log =14.3 seen in starburst galaxy NGC 1705 (Heckman et al. 2001). The values of in the neutral gas in the DLAs, between 20.35 to 21.75, compare to values in the Galactic ISM of between 19.6 and 22.4 (Dickey & Lockman 1990), with over two orders of magnitude of dispersion in each case. The similarity in the amount of O vi seen is intriguing considering that the metallicities in these DLA systems are typically forty times lower than the (solar) value in the Galactic ISM. This implies that the total column density of ionized gas in DLAs is very large (see Sect. 5).
3.2 Comparison of high ion line profiles
Throughout this Section we refer to Table 2, comparing the integrated kinematic measurements of the neutral-phase, C iv, and O vi absorption line profiles, Fig. 3, showing the column density, line width, and central velocity distributions for the components of Si iv, C iv, and O vi in the DLA sample, and Fig. 4, comparing many measured absorber properties using scatter plots.

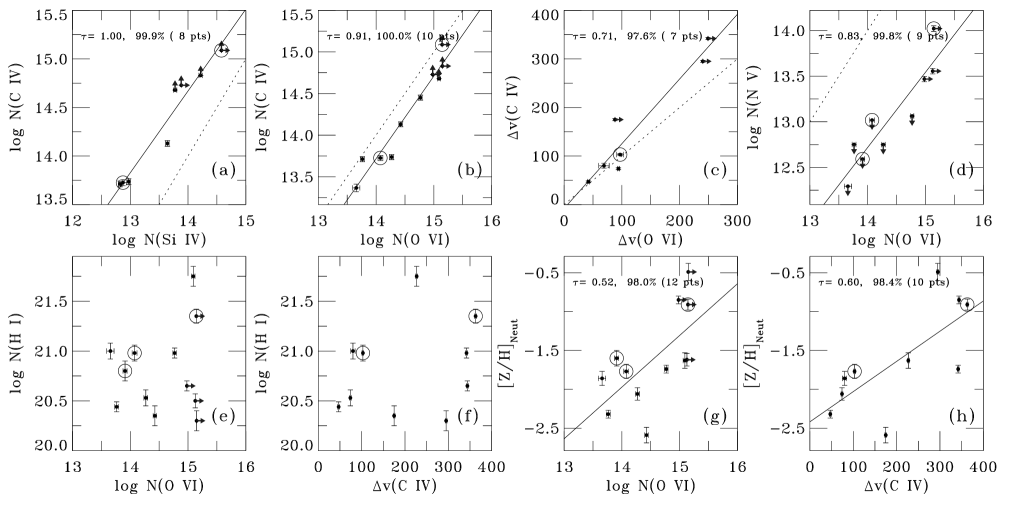
The properties of the Si iv and C iv absorbers are strongly correlated. This is revealed by visual examination of the data, by the close similarity in their distributions of individual component line width and central velocities in Fig. 3, and by the strong correlation in their total column densities (Fig. 4, panel a). In general the Si iv and C iv thus arise in the same gaseous phase.
There is a 3 correlation between and (Fig. 4, panel b). The total line widths of the two ions are also correlated (Fig. 4, panel c). Despite these correlations in the integrated properties, we do observe significant differences in the C iv and O vi absorbers at the component level. The C iv/O vi column density ratios are non-linear with velocity in nine out of ten cases where data on both ions exist, often showing multiple peaks and troughs within the velocity width of each system (Fig. 2). This can be attributed to the O vi profiles being smoother than those of C iv, with fewer O vi components overall and no narrow O vi components observed. These non-linear ratios imply the C iv and O vi arise in separate phases. Further evidence for O vi and C iv tracing different gas phases in DLAs is given by the histograms of the line widths of the individual components (Fig. 3, panel b), where strong differences are seen between C iv and O vi. Many narrow ( km s-1) C iv components are observed, but most O vi components have -values in the range 25–40 km s-1.
We report three DLAs with detections of both O vi and N v. One of these DLAs is close to the QSO redshift (toward Q0528-250) leaving two intervening cases where N v is seen (toward Q0450-131 and Q2243-605). The O vi column densities are highest (in fact, saturated) in the cases where N v is present (Fig. 4, panel d). Profile comparisons are hence not useful in revealing the O vi-to-N v relationship.
3.3 High ions versus neutral species
In Fig. 5 we compare the velocity range to between O vi, C iv, and the neutral lines in each DLA, to display the larger range of velocity space that the ionized lines invariably occupy. The mean total width (and its standard deviation) of all the C iv absorbers (including the limits from the saturated cases), =205125 km s-1, is twice as broad as the average width of the neutral lines, =10288 km s-1. These results agree with the corresponding numbers reported in Wolfe et al. (2005) over a sample of over 70 DLAs: =209114 km s-1 and =11484 km s-1.
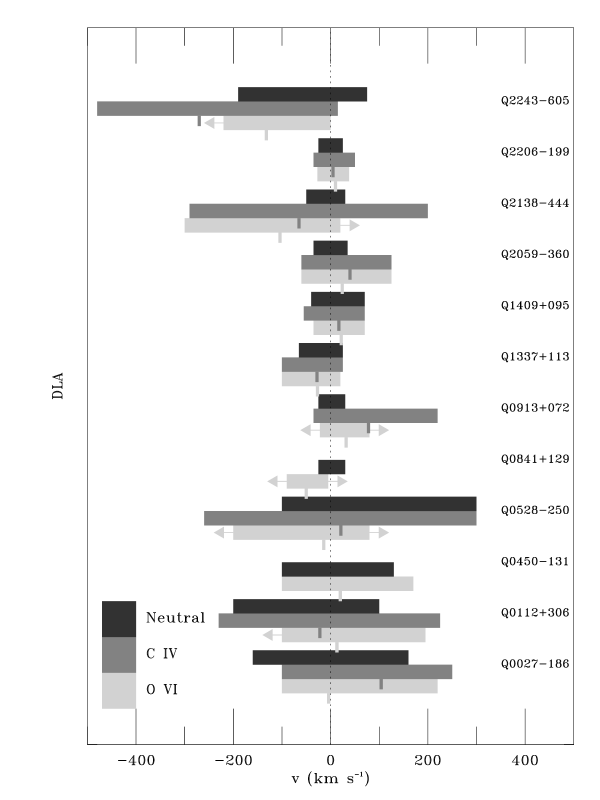
Individual C iv components are found at velocities of up to 400 km s-1 from the neutral gas (see the distribution in Fig. 3, panel c). We also observe offsets in the overall mean velocity of high-ion absorption in each DLA. The mean and standard deviation of is 6578 km s-1. These offsets can be interpreted as the signature of galactic inflows and/or outflows.
In Fig. 4 (panels e to h) we directly compare our new measured high-ion DLA properties with the H i column densities and neutral-phase metallicities. We find that the column densities and line widths of the high ions are each uncorrelated with the column density of H i in the neutral gas. However, the plasma properties do depend on the metallicity of the neutral gas. This is revealed by the tentative detection (98% confidence) of a [Z/H]Neut vs correlation (panel g), and the tentative detection (also at 98% confidence) of a [Z/H]Neut vs correlation (panel h). Note we use and not to illustrate the high-ion kinematics since C iv line widths are far better measured. All DLAs in the sample with [Z/H]Neut 1.5 have both log 14.77 (the sample median value) and 250km s-1. A similar correlation is found between [Z/H]Neut and (not shown).
The correlation between the high-ion line width and metallicity in DLAs follows the observed correlation between the low-ion line width and metallicity (Ledoux et al. 2006; Wolfe & Prochaska 1998). However, these correlations likely have very different explanations. The low-ion velocity dispersion is thought to be dominated by gravity, and so its correlation with metallicity may imply an underlying mass-metallicity relation (Ledoux et al. 2006). The high-ion line width may be correlated with metallicity since both high ions and metals can be produced as a result of supernovae. Further observations of DLA high ions are needed to investigate the existence of this correlation, which in principle can be used to probe the origin of plasma in DLAs.
4 Ionization
To create the ions O vi, N v, C iv, and Si iv from the preceding ionization stages requires 114, 78, 48, and 34 eV, respectively. In principle, these ionization energies can be supplied either by electron collisions in hot plasma or by extreme-UV photons. Either ionization process is plausible in the vicinity of DLAs, due to the local presence of type II supernovae, accreting intergalactic gas, and the ionizing extragalactic background.
4.1 Model-independent insights
Many of the C iv and Si iv components have narrow line widths, km s-1 implying photoionization is the origin for these components. Collisional ionization is ruled out since km s-1 implies log , at which temperature little C iv would be produced by collisions with electrons (Sutherland & Dopita 1993); a similar argument holds for Si iv. These narrow components are particularly noticeable in the DLAs toward Q2243-603, Q0112-306, and Q2138-444. There are also broader C iv components present in the data with km s-1, e.g. toward Q1337+113 and Q2059-360. However, no individual narrow photoionized O vi components are found; the narrowest O vi -value is 14 km s-1, with the majority of cases over 20 km s-1. For comparison, a thermally broadened O vi component at a temperature of K, where O vi peaks in abundance in collisionally ionized plasma, has a line width km s-1. The line widths of the N v components are generally over 20 km s-1, though the sample is small. We cannot infer conclusively from the observed line widths whether O vi and N v are photoionized or collisionally ionized, because of the possibility of non-thermal broadening or unresolved components. However, the fact that we clearly see photoionized C iv and Si iv components but do not see these components in O vi suggests that the O vi arises in a separate, collisionally ionized phase. Analogous situations (with narrow components seen in C iv but not in O vi) are observed in the low halo of the Milky Way (Fox et al. 2003) and in Lyman Limit Systems (Kirkman & Tytler 1999).
4.2 Photoionization models
We ran photoionization models using the code CLOUDY (version C06.02, described in Ferland et al. 1998), to investigate the viability of photoionization as an origin mechanism for the observed high ions in the DLA at toward Q2206-199. This absorber was chosen as an illustrative case. Our methodology involved running a grid of models at different gas density and total hydrogen column density, until we found a solution that reproduced the high-ion column densities (see Fig. 6).
The following assumptions were made: (1) the plasma in DLAs exists in a uniform, plane-parallel slab; (2) the plasma has the same metallicity as the neutral gas; (3) the plasma has solar relative abundance ratios; (4) the plasma is exposed to the extragalactic background taken from Haardt & Madau (1996), with a mean intensity at 912 Å of ergs cm-2 s-1 Hz-1 sr-1 at .
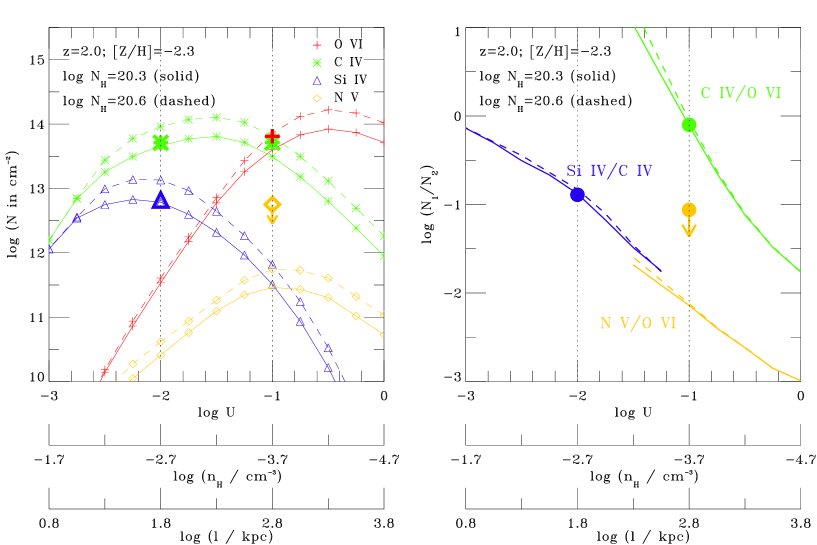
The first result is that in this test case (the DLA toward Q2206-199), there is no single-phase solution to the Si iv, C iv, and O vi observations. There are solutions just to the C iv and Si iv, or to the C iv and O vi data, which we discuss here. A model to the observed and , assuming [Si/H]=[C/H], requires log and log , where is the ratio of ionizing photon density to gas density, corresponding to log , or an over-density . The C iv and O vi data are reproduced, if we assume [C/H]=[O/H], by a model with log , ionization parameter log , gas density log (/cm-3)=3.7, and linear size kpc. However, using a value for the Hubble constant at of =220 km s-1 Mpc-1 that follows from a standard (=0.7, =0.3) cosmology, the Hubble flow broadening (km s-1(Mpc) over a path of 630 kpc would create lines with widths of 140 km s-1, several times larger than the observed C iv line width (see spectra in Fig. 1). In order to arrive at a physically reasonable size, one requires [O/C]0, as is the case for metal-poor halo stars (Akerman et al. 2004). In this case a given / ratio can be reached at a lower ionization parameter, corresponding to higher density and smaller size.
If local galactic sources of radiation were present in addition to the extragalactic background (e.g. Howk & Sembach 1999; Vladilo et al. 2001), then (assuming the shape of the radiation field does not change) a given ionization parameter would be reproduced at higher density and smaller cloud size, and consequently the Hubble broadening would be smaller. However, one would not expect a strong flux of O vi-ionizing photons from galactic sources of radiation (e.g. Fox et al. 2005), so though local sources of radiation could produce the C iv they could not easily explain the O vi.
N v is not detected in the Q2206-199 DLA, in agreement with the model prediction. For those DLAs where N v is present, one cannot use the N v/C iv ratios to derive the gas density since the relative nitrogen abundance in DLAs can be highly non-solar (Pettini et al. 2002), and also because the N v may be collisionally ionized. We also note that two of the three DLAs at 5 000 km s-1 from the QSO (toward Q0841+129 and Q2059-360) do not show N v absorption, whereas N v is expected in intrinsic systems photoionized by radiation from the QSO (Hamann 1997). This suggests that the influence of photoionizing QSO radiation is not that strong in these two cases. Indeed, the ionization properties of the three DLAs are no different than those of the intervening DLAs, so they may be representative of the whole population.
5 Total ionized column density
We can calculate the total hydrogen column density in the hot (O vi-bearing) and warm (C iv-bearing) phases using
| (1) |
| (2) |
where / is the fraction of oxygen atoms in the five-times-ionized state, and /. Assuming solar relative abundance ratios in both the neutral and plasma phases, we have [O/H]Hot=[Z/H]Neut and [C/H]Warm=[Z/H]Neut. By using , , and as shorthands for the absolute metallicities in the hot, warm, and neutral phases, we can write
| (3) |
| (4) |
To evaluate Eqns. (3) and (4) for each DLA we take (O/H)⊙=10-3.34 from Asplund et al. (2004) and (C/H)⊙=10-3.61 from Allende Prieto et al. (2002), and [Z/H]Neut from Ledoux et al. (2006). We cannot directly measure the metallicity of the plasma phases so we assume and to be equal to one in our calculations. The remaining unknowns are and , which will depend on the ionization mechanism. The maximum value reaches in collisionally ionized plasma is 0.2 at K (Sutherland & Dopita 1993). The maximum for in collisionally ionized plasma is 0.29 at K, and our photoionization models also show a maximum =0.3 in photoionized plasma. We can therefore estimate lower limits to the hot and warm hydrogen column densities using the maximum values for and .
The implied hot hydrogen column densities are compared with the H i column density in the neutral phase in Table 3 and Figure 7, where we find log ranges from 19.5 to 21.1, and log ranges from 19.4 to 20.9. These lower limits are typically on the same order as the H i column in the neutral gas, though we observe a considerable dispersion (over two orders of magnitude) in the value of . Note that if some C iv co-existed with the O vi in the hot phase, as is possible in collisional ionization models, then the true hydrogen column in the warm phase would be lower than that calculated here. Therefore we do not sum the H ii contents of the C iv and O vi phases, since this could constitute a double-counting problem.

6 Contribution of DLA plasma to the cosmic baryon and metal density
The contribution of H i in DLAs to the cosmic density can be calculated using
| (5) |
where is the H i column density distribution function. has been calculated as , fairly flat with redshift (Prochaska, Herbert-Fort, & Wolfe 2005; Péroux et al. 2003, 2005). In Eqn. (5) the lower integration limit corresponds to the definition of a DLA, and the upper integration limit corresponds to the break in the power law reported by Prochaska et al. (2005); above log =21.5 becomes much steeper and the contribution of DLAs at these column densities to becomes small. Since (H i) has a power law dependence with slope (Prochaska et al. 2005), it can be shown by integrating Eqn. (5) that equal bins of log contain equal contributions to , i.e. all DLAs contribute toward the mass density. The contribution of the hot phase of DLA to the closure density can be expressed in a similar way:
| (6) |
The ratio may depend on , but since we only have nine intervening DLAs, we do not have enough data to characterize this relationship. Therefore we proceed by using our median values and measured over the nine intervening DLAs with O vi666Using the mean rather than the median raises the ratio to 1. However we use the median since it is less sensitive to the effect of false O vi detections.. Now the contribution from the ionized gas simply becomes
| (7) |
evaluating to and . The contribution of the metals in DLAs (Ferrara, Scannapieco, & Bergeron 2005) then needs to be augmented by and .
Note that the plasma contributions to the baryon and metal budgets would rise if the value of in the DLA plasma were 0.2. The total density of metals estimated by integrating the star formation history of the Universe up to is (using the star formation history from Bouwens et al. 2004, and assuming a metal yield =1/42). Stars in galaxies appear to contain % of the total (Bouché et al. 2006), the contribution from the ISM in galaxies (H i in DLAs) is 1%, and the IGM contains a further % (Pettini 2004; Bergeron & Herbert-Fort 2005). The remaining metals (% of the total) are yet to be found, hence the formulation of the “missing metal problem” (Pettini 1999; Ferrara et al. 2005). If in the DLA plasma were as low as , which is the case for plasma in CIE at K (Sutherland & Dopita 1993; Gnat & Sternberg 2006), then the O vi-bearing plasma around DLAs would constitute and hence solve the missing metals problem. In this event the majority of oxygen atoms would be ionized up to O vii and O viii. The lines of these ions are in the X-ray, but unfortunately searches for high-redshift DLA absorption in O vii and O viii to confirm the presence of K plasma are beyond the capabilities of current X-ray satellites. A scenario with O vi existing as a trace ionization state in million-degree DLA coronae is consistent with the broader O vi lines in our sample, since km s-1 in a thermally broadened line at K. However, this scenario is not required by the data; it is merely one possible explanation. Indeed, the notion that all the missing metals are in hot DLA halos is implausible, since metals will also be found in both the neutral and ionized phases of other classes of QAL system. This includes the plasma in sub-DLAs and Lyman Limit Systems (Kirkman & Tytler 1997, 1999; D’Odorico & Petitjean 2001; Prochaska et al. 2006), which may also probe galactic halos (see Figure 1 in Maller et al. 2003), and could easily contribute to the missing metals. It will be necessary to search for and characterize the O vi phase in QSO absorbers over all ranges of to fully measure the quantity of baryons and metals hidden in hot galactic halos at high redshift.
7 Discussion
A full discussion of models of the origin of high-ionization plasma in DLAs (e.g. Mo 1996; Mo & Miralda-Escudé 1996; Katz et al. 1996; Rauch et al. 1997; Wolfe & Prochaska 2000b; Maller et al. 2003) is beyond the scope of this paper. However, we briefly mention two leading theories in light of the findings in our new data.
7.1 Accretion
Numerical simulations of cosmological structure formation (Cen & Ostriker 1999; Davé et al. 2001) predict that gas falling onto diffuse large-scale structures will be accelerated to supersonic speeds and become shock-heated to temperatures of 105 to 107 K, creating a phase known as the warm-hot IGM (WHIM).777Note that the term “warm-hot” here is at odds with our use of the terms warm and hot throughout this paper. The Davé et al. (2001) WHIM evolution models predict 10% of the cosmic baryons are in the WHIM at (at over-densities ), but 30–40% are at . Our data show that collisionally ionized plasma at K exists around DLAs at , and that the baryonic content of the plasma is at least of similar order to that in the H i phase. This plasma could be identified with the high-density portions of the WHIM, since DLAs presumably trace deep potential wells within dark matter halos, and hence represent likely sites for accretion to occur. However, the presence of metals in DLA halos implies that the gas has been processed by star formation; accretion would bring in pristine, low-metallicity material.
7.2 Supernovae and galactic winds
Star formation in DLAs will lead to supernovae and regions of hot, shock-heated plasma, which will become outflows if enough energy is injected. Galactic outflows are a topic of considerable interest, not least because of the metal pollution and energy injection they bring about in the IGM (e.g. Veilleux et al. 2005; Aguirre et al. 2001, 2005; Aracil et al. 2004).
Our DLA observations show O vi and C iv components displaced from the neutral gas by up to 400 km s-1; for comparison, Aguirre et al. (2001) find that 300 km s-1 winds at can account for the metallicity of the Lyman alpha forest. Our data also show evidence at the 98% level for both a [Z/H]Neut vs correlation and a [Z/H]Neut vs correlation. These correlations are consistent with a feedback scenario where supernovae in DLA disks produce both metals and kinematically disturbed volumes of interstellar plasma.
8 Summary
We have performed a successful search for O vi and other high ions in a VLT/UVES sample of 35 DLAs with data covering O vi at S/N10, and studied the properties of the highly ionized phase and its relationship to the neutral gas. We now list the principal observational results.
-
1.
We detect 12 cases of DLA O vi absorption, of which three are at 5 000 km s-1 from the QSO. No O vi non-detections are found, but considering the difficulty in making non-detections, a conservative estimate of the incidence of O vi absorption in DLAs is 34%. All the DLAs show C iv and Si iv when data is available, and N v is seen in 3/9 DLAs with N v coverage. The O vi absorbers are characterized by log between 13.66 and 15.25 with a median value of 14.77. These average column densities are similar to the amounts measured in the Galactic halo, LMC, and starburst galaxy NGC 1705, even though the DLA metallicities (measured in the neutral gas) are typically one fortieth of the solar values.
-
2.
The Si iv and C iv profiles are very similar, suggesting these two ions are generally co-spatial. Many of the individual C iv and Si iv components are narrow enough ( km s-1) to imply photoionization as the origin mechanism.
-
3.
In nine of ten cases the ratio is non-linear with velocity through the profile, implying that O vi and C iv are not fully co-spatial. No narrow, photoionized O vi components are seen in the data. Furthermore, CLOUDY photoionization models show no single-phase solution to the Si iv, C iv, and O vi column densities. Thus, the observations suggest the plasma in DLAs contains two phases: a photoionized phase seen in Si iv and C iv, and a hot phase seen in O vi and N v that may also contain additional amounts of C iv.
-
4.
C iv and O vi components are seen centered up to 400 km s-1 away from the neutral gas, indicating inflows or outflows. The total width of the C iv absorbers is typically twice as large as the total width of the neutral absorbers.
-
5.
Our data show tentative evidence (98% significance) for correlations between [Z/H]Neut and log , and between [Z/H]Neut and . This can be explained if the DLA plasma is produced as a direct result of supernova-generated outflows. The high ion properties are uncorrelated to in the neutral gas.
-
6.
Using the observed and measurements in the DLAs from this paper, the metallicities and measurements from Ledoux et al. (2006), conservative assumptions for the O vi and C iv ionization fractions ( and ), and assuming that the plasma has the same metallicity as the neutral phase, we calculate the total hydrogen column density in the O vi-bearing and C iv-bearing phases. We find log ranges from 19.5 to 21.1, and log ranges from 19.4 to 20.9. These column densities of ionized plasma are typically of the same order as log in the neutral phase. Using the median value to , we find that the total baryonic content of the O vi phase is and the total metal content is , i.e. 1% of the metal budget at . If the temperature in the O vi-bearing plasma is K and so , then the O vi phase of DLAs can make a significant contribution to the missing metals problem.
Acknowledgements
AJF is supported by a Marie Curie Intra-European Fellowship awarded by
the European Union Sixth Framework Programme.
We are grateful to Philipp Richter and Blair Savage for comments,
to Bart Wakker for help in implementing CLOUDY,
and to Jacqueline Bergeron and Patrick Boissé for assistance with VPFIT.
PP and RS gratefully acknowledge support from the Indo-French
Centre for the Promotion of Advanced Research (Centre Franco-Indien
pour la Promotion de la Recherche Avancée) under contract No. 3004-3.
We thank the referee for a thorough report that improved the
quality of the manuscript.
References
- Aguirre et al. (2001) Aguirre, A., Hernquist, L., Schaye, J., Weinberg, D. H., Katz, N., & Gardner, J. 2001, ApJ, 560, 599
- Aguirre et al. (2005) Aguirre, A., Schaye, J., Hernquist, L., Kay, S., Springel, V., & Theuns, T. 2005, ApJ, 620, L13
- Akerman et al. (2004) Akerman, C. J., Carigi, L., Nissen, P. E., Pettini, M., & Asplund, M. 2004, A&A, 414, 931
- Allende Prieto, Lambert, & Asplund (2002) Allende Prieto, C., Lambert, D. L., & Asplund, A. 2002, ApJ, 573, L137
- Aracil et al. (2004) Aracil, B., Petitjean, P., Pichon, C., & Bergeron, J. 2004, A&A, 419, 811
- Asplund et al. (2004) Asplund, M., Grevesse, N., Sauval, A. J., Allende Prieto, C., Kiselman, D. 2004, A&A, 417, 751
- Ballester et al. (2000) Ballester, P., Modigliani, A., Boitquin, O., Cristiani, S., Hanuschik, R., Kaufer, A., & Wolf, S. 2000, The Messenger, 101, 31
- Bergeron et al. (2002) Bergeron, J., Aracil, B., Petitjean, P., & Pichon, C. 2002, A&A, 396, L11
- Bergeron & Herbert-Fort (2005) Bergeron, J., & Herbert-Fort, S. 2005, “Probing Galaxies through Quasar Absorption Lines”, Proc. IAU Coll. No. 199, ed. Williams, Shu, & Ménard
- Bouché et al. (2006) Bouché, N., Lehnert, M. D., & Péroux, C. 2006, MNRAS, 367, L16
- Bouwens et al. (2004) Bouwens, R. J., et al. 2004, ApJ, 616, L79
- Burles & Tytler (1996) Burles, S., & Tytler, D. 1996, ApJ, 460, 584
- Carswell, Schaye, & Kim (2002) Carswell, B., Schaye, J., & Kim, T.-S. 2002, ApJ, 578, 43
- Cen & Ostriker (1999) Cen, R., & Ostriker, J. P. 1999, ApJ, 514, 1
- Davé et al. (2001) Davé, R., et al. 2001, ApJ, 552, 473
- Dessauges-Zavadsky et al. (2004) Dessauges-Zavadsky, M., Calura, F., Prochaska, J. X., D’Odorico, S., & Matteucci, F. 2004, A&A, 416, 79
- Dessauges-Zavadsky et al. (2006) Dessauges-Zavadsky, M., Prochaska, J. X., D’Odorico, S., Calura, F., & Matteucci, F. 2006, A&A, 445, 93
- Dickey & Lockman (1990) Dickey, J. M., & Lockman, F. J. 1990, ARA&A, 28, 215
- D’Odorico & Petitjean (2001) D’Odorico, V.; Petitjean, P., A&A, 370, 729
- Ferland et al. (1998) Ferland, G. J., Korista, K. T., Verner, D. A., Ferguson, J. W., Kingdon, J. B., & Verner, E. M. 1998, PASP, 110, 761
- Ferrara, Scannapieco, & Bergeron (2005) Ferrara, A., Scannapieco, E., & Bergeron, J. 2005, ApJ, 634, L37
- Fox et al. (2003) Fox, A. J., Savage, B. D., Sembach, K. R., Fabian, D., Richter, P., Meyer, D. M., Lauroesch, J., & Howk, J. C. 2003, ApJ, 582, 793
- Fox et al. (2005) Fox, A. J., Wakker, B. P., Savage, B. D., Sembach, K. R., Tripp, T. M., & Bland-Hawthorn, J. 2005, ApJ, 630, 332
- Fox, Savage, & Wakker (2006) Fox, A. J., Savage, B. D., & Wakker, B. P. 2006, ApJS, 165, 229
- Gnat & Sternberg (2006) Gnat, O., & Sternberg, A. 2006, ApJS, in press (astro-ph/0608181)
- Haardt & Madau (1996) Haardt, F., & Madau, P. 1996, ApJ, 461, 20
- Hamann (1997) Hamann, F. 1997, ApJS, 109, 279
- Heckman et al. (2001) Heckman, T. M., Sembach, K. R., Meurer, G. R., Strickland, D. K., Martin, C. L., Calzetti, D., & Leitherer, C. 2001, ApJ, 554, 1021
- Howk & Sembach (1999) Howk, J. C., & Sembach, K. R. 1999, ApJ, 523, L141
- Howk et al. (2002) Howk, J. C., Sembach, K. R., Savage, B. D., Massa, D., Friedman, S., & Fullerton, A. W. 2002, ApJ, 569, 214
- Katz et al. (1996) Katz, N., Weinberg, D. H., Hernquist, L., & Miralda-Escudé, J. 1996, ApJ, 457, L57
- Kim et al. (1997) Kim, T.-S., Hu, E. M., Cowie, L. L., & Songaila, A. 1997, AJ, 114, 1
- Kirkman & Tytler (1997) Kirkman, D., & Tytler, D. 1997, ApJ, 489, L123
- Kirkman & Tytler (1999) Kirkman, D., & Tytler, D. 1999, ApJ, 512, L5
- Ledoux et al. (1998) Ledoux, C., Petitjean, P., Bergeron, J., Wampler, E. J., & Srianand, R. 1998, A&A, 337, 51
- Ledoux et al. (2003) Ledoux, C., Petitjean, P., & Srianand, R. 2003, MNRAS, 346, 209
- Ledoux et al. (2006) Ledoux, C., Petitjean, P., Fynbo, J. P. U., Møller, P., & Srianand, R. 2006, A&A, 457, 71
- Levshakov et al. (2003) Levshakov, S. A., Agafonova, I. I., Reimers, D., & Baade, R. 2003, A&A, 404, 449
- Lopez et al. (2002) Lopez, S., Reimers, D., D’Odorico, S., & Prochaska, J. X. 2002, A&A, 385, 778
- Lu et al. (1996) Lu, L., Sargent, W. L. W., Barlow, T. A., Churchill, C. W., & Vogt, S. S. 1996, ApJS, 107, 475
- Maller et al. (2003) Maller, A. H., Prochaska, J. X., Somerville, R. S., & Primack, J. R. 2003, MNRAS, 343, 268
- Mo (1996) Mo, H. J. 1996, MNRAS, 269, L49
- Mo & Miralda-Escudé (1996) Mo, H. J., & Miralda-Escud e, J. 1996, ApJ, 469, 589
- Morton (2003) Morton, D. C. 2003, ApJS, 149, 205
- Péroux et al. (2003) Péroux, C., McMahon, R. G., Storrie-Lombardi, L. J., & Irwin, M. J. 2003, MNRAS, 346, 1103
- Péroux et al. (2005) Péroux, C., Dessauges-Zadavsky, M., D’Odorico, S., Kim, T. S., & McMahon, R. G. 2005, MNRAS, 363, 479
- Petitjean et al. (2000) Petitjean, P., Srianand, R., & Ledoux, C. 2000, A&A, 364, L26
- Pettini (1999) Pettini, M. 1999, in Proc. ESO Workshop, Chemical Evolution from Zero to High Redshift, ed. J. R. Walsh & M. R. Rosa (Berlin: Springer), 233 (astro-ph/9902173)
- Pettini (2004) Pettini, M. 2004, in Cosmochemistry: The Melting Pot of the Elements, ed. C. Esteban et al. (Cambridge: Cambridge Univ. Press), 257
- Pettini et al. (2002) Pettini, M., Ellison, S. L., Bergeron, J., & Petitjean, P. 2002, A&A, 391, 21
- Prochaska & Wolfe (1997a) Prochaska, J. X., & Wolfe, A. M. 1997a, ApJ, 474, 140
- Prochaska & Wolfe (1997b) Prochaska, J. X., & Wolfe, A. M. 1997b, ApJ, 487, 73
- Prochaska & Wolfe (2002) Prochaska, J. X., & Wolfe, A. M. 2002, ApJ, 566, 68
- Prochaska et al. (2005) Prochaska, J. X., Herbert-Fort, S., & Wolfe, A. M. 2005, ApJ, 635, 123
- Prochaska et al. (2006) Prochaska, J. X., O’Meara, J. M., Herbert-Fort, S., Burles, S., Prochter, G. E., & Bernstein, R. A. 2006, ApJ, 648, L97
- Rauch et al. (1997) Rauch, M., Haehnelt, M. G., & Steinmetz, M. 1997, ApJ, 481, 601
- Savage & Sembach (1991) Savage, B. D., & Sembach, K. R. 1991, ApJ, 379, 245
- Savage et al. (2003) Savage, B. D., et al. 2003, ApJS, 146, 125
- Sembach & Savage (1992) Sembach, K. R., & Savage, B. D. 1992, ApJS, 83, 147
- Sembach et al. (2003) Sembach, K. R., et al. 2003, ApJS, 146, 165
- Simcoe et al. (2002) Simcoe, R. A., Sargent, W. L. W., & Rauch, M. 2002, ApJ, 578, 737
- Srianand et al. (2005) Srianand, R., Petitjean, P., Ledoux, C., Ferland, G. & Shaw, G. 2005, MNRAS, 362, 549
- Sutherland & Dopita (1993) Sutherland, R. S., & Dopita, M. A. 1993, ApJS, 88, 253
- Veilleux et al. (2005) Veilleux, S., Cecil, G., Bland-Hawthorn, J. 2005, ARA&A, 43, 769
- Vladilo et al. (2001) Vladilo, G., Centuri on, M., Bonifacio, P., & Howk, J. C. 2001, ApJ, 557, 1007
- Wolfe, Gawiser, & Prochaska (2005) Wolfe. A. M., Gawiser, E., & Prochaska, J. X. 2005, ARA&A, 43, 861
- Wolfe & Prochaska (1998) Wolfe. A. M., & Prochaska, J. X. 1998, ApJ, 494, L15
- Wolfe & Prochaska (2000a) Wolfe. A. M., & Prochaska, J. X. 2000a, ApJ, 545, 591
- Wolfe & Prochaska (2000b) Wolfe. A. M., & Prochaska, J. X. 2000b, ApJ, 545, 603
| QSO888Alternate (SIMBAD-compatible) names are given in parentheses. | 999Redshift of quasar determined from position of Lyman- emission. | Ion | 101010 and are the lower and upper velocity limits of absorption in km s-1. | log (strong)111111Column density measured using AOD method. Strong and weak refer to the two lines of the doublet. | log (weak)d | log (fit)121212Column density measured using VPFIT. The number in parentheses indicates the number of Voigt components in the model. | ||
|---|---|---|---|---|---|---|---|---|
| Q0027-186 | 2.56 | 2.402 | O vi | 100 | 60 131313AOD measurement made over a limited velocity range, due to partial blending. (fit), determined using unblended data from both lines, may be higher. | …141414Line completely blended. | 14.810.03 | 15.090.03( 5) |
| Si iv | 100 | 250 | 13.770.03 | 13.660.04 | 13.740.03( 5) | |||
| C iv | 100 | 250 | 14.67 | 14.68 | 14.690.03( 9) | |||
| Q0112+306 | 2.99 | 2.702 | O vi | 100 | 195f | …g | 15.15 | 15.210.05( 3) |
| Si iv | 230 | 225 | 14.220.03 | 14.240.03 | 14.230.09(12) | |||
| C iv | 230 | 225 | 14.87 | 14.830.03 | 14.840.03( 8) | |||
| Q0450-131 | 2.25 | 2.067 | O vi | 100 | 170 | 15.12 | 15.12 | 15.120.13( 4) |
| (QSO B0450-1310B) | N v | 50 | 110 | 13.560.03 | 13.590.03 | 13.570.03( 3) | ||
| Q0528-250 | 2.77 | 2.811 | O vi | 200 | 80f | 15.14 | …g | 15.180.03( 4) |
| Si iv | 260 | 300 | 14.45 | 14.58 | 14.570.03(13) | |||
| C iv | 260 | 140 | 14.97 | 15.09 | 15.290.09( 6) | |||
| N v | 150 | 150 | 14.020.03 | 14.000.03 | 14.040.03( 4) | |||
| Q0841+129 | 2.50 | 2.476 | O vi | 90 | 5f | 13.910.04 | 13.940.05 | 13.950.09( 2) |
| N v | 85 | 0 | 12.59 | …g | … | |||
| Q0913+072 | 2.78 | 2.618 | O vi | 22 | 80f | 14.430.03 | 14.430.03 | 14.490.04( 2) |
| Si iv | 35 | 220 | 13.640.03 | 13.690.03 | 13.670.03( 5) | |||
| C iv | 35 | 220 | 14.130.03 | 14.140.03 | 14.140.03( 5) | |||
| Q1337+113 | 2.92 | 2.796 | O vi | 100 | 20 | 13.660.06 | …g | 13.660.03( 1) |
| C iv | 100 | 25 | 13.370.05 | 13.380.07 | 13.400.03( 1) | |||
| N v | 100 | 25 | 12.29 | …g | … | |||
| Q1409+095 | 2.85 | 2.456 | O vi | 35 | 70 | …g | 14.270.03 | 14.280.03( 2) |
| Si iv | 35 | 50 | 12.970.03 | 12.930.03 | 12.970.03( 2) | |||
| C iv | 55 | 70 | 13.740.03 | 13.740.03 | 13.740.03( 3) | |||
| N v | 20 | 85 | 12.75 | …g | … | |||
| Q2059-360 | 3.09 | 3.083 | O vi | 60 | 125 | …g | 14.070.04 | 14.080.03( 1) |
| Si iv | 60 | 125 | 12.870.07 | …g | 12.930.03( 2) | |||
| C iv | 60 | 125 | 13.730.03 | 13.760.03 | 13.730.03( 3) | |||
| N v | 60 | 125 | …g | 13.02 | … | |||
| Q2138-444 | 3.17 | 2.852 | O vi | 300 | 20f | 14.770.03 | …g | 14.780.03( 3) |
| C iv | 290 | 200 | 14.450.03 | 14.430.03 | 14.450.03(13) | |||
| N v | 290 | 200 | …g | 13.06 | … | |||
| Q2206-199 | 2.56 | 2.076 | O vi | 27 | 38 | 13.760.03 | 13.810.04 | 13.840.03( 1) |
| (LBQS2206-1958A) | Si iv | 35 | 50 | …g | 12.820.03 | 12.850.03( 2) | ||
| C iv | 35 | 50 | 13.710.03 | 13.720.03 | 13.710.03( 2) | |||
| N v | 35 | 50 | …g | 12.75 | … | |||
| Q2243-605 | 3.01 | 2.331 | O vi | 220 | 80f | 14.58 | …g | 14.980.03( 3) |
| (HE2243-6031) | Si iv | 400 | 13 | 13.88 | …g | 14.370.42( 8) | ||
| C iv | 480 | 15 | 14.68 | 14.73 | 14.740.05(14) | |||
| N v | 380 | 335 | 13.470.03 | 13.500.03 | 13.560.03( 2) |
| QSO | 151515Redshift of the system determined using the velocity centroid of the strongest component in the neutral line. | Neutral | 161616 is the velocity range enclosing the central 90% of the total integrated optical depth in the line (in km s-1). | 171717 is the optical-depth weighted mean velocity of the line profile, (in km s-1). | |||
|---|---|---|---|---|---|---|---|
| Q0027-186 | 2.402 | Si ii 1526 | 1802 | 1044 | 227181818Lines saturated, so could be lower. | …191919Lines partly blended and saturated, so no measurement is possible. | …e |
| Q0112+306 | 2.702 | Fe ii 1608 | 2082 | 222 | 295d | …202020Lines partly blended, so is unknown and only a lower limit to is measured. | 240f |
| Q0450-131 | 2.067 | Fe ii 1608 | 1342 | …212121No available C iv data. | …g | 204 | 168d |
| Q0528-250 | 2.811 | S ii 1253 | 2822 | 214 | 363d | …e | …e |
| Q0841+129 | 2.476 | S ii 1259 | 262 | …g | …g | …f | 67f |
| Q0913+072 | 2.618 | Si ii 1526 | 242 | 782 | 1752 | …f | 88f |
| Q1337+113 | 2.796 | Fe ii 1608 | 362 | 284 | 805 | 277 | 699 |
| Q1409+095 | 2.456 | Si ii 1526 | 652 | 172 | 742 | 222 | 942 |
| Q2059-360 | 3.083 | Fe ii 1121 | 442 | 402 | 1032 | 244 | 976 |
| Q2138-444 | 2.852 | Si ii 1808 | 442 | 652 | 3422 | …f | 249f |
| Q2206-199 | 2.076 | Si ii 1304 | 212 | 52 | 472 | 102 | 422 |
| Q2243-605 | 2.331 | Si ii 1808 | 1652 | 2706 | 344d | …e | …e |
| Mean and std dev222222Upper limits treated as data points in these calculations. | 10288 | … | 205125 | … | … | ||
| QSO | [Z/H]Neut232323[Z/H]Neut and log from Ledoux et al. (2006). Element Z is Zn if Zn ii is detected, otherwise S or Si. | log | log | log 242424; we present a lower limit since . We assume [O/H]Hot=[Z/H]Neut. | log | log 252525; we present a lower limit since . We assume [C/H]Warm=[Z/H]Neut. | |||
|---|---|---|---|---|---|---|---|---|---|
| Q0027-186 | 2.402 | 1.630.10 | 21.750.10 | 15.090.03 | 20.8 | 0.10 | 14.68 | 20.4 | 0.05 |
| Q0112+306 | 2.702 | 0.490.11 | 20.300.10 | 15.15 | 19.7 | 0.24 | 14.83 | 19.5 | 0.14 |
| Q0450-131 | 2.067 | 1.620.08 | 20.500.07 | 15.12 | 20.8 | 1.92 | … | … | … |
| Q0528-250 | 2.811 | 0.910.07 | 21.350.07 | 15.14 | 20.1 | 0.06 | 15.09 | 20.1 | 0.06 |
| Q0841+129 | 2.476 | 1.600.10 | 20.800.10 | 13.91 | 19.5 | 0.06 | … | … | … |
| Q0913+072 | 2.618 | 2.590.10 | 20.350.10 | 14.43 | 21.1 | 5.07 | 14.130.03 | 20.9 | 3.18 |
| Q1337+113 | 2.796 | 1.860.09 | 21.000.08 | 13.660.06 | 19.6 | 0.04 | 13.370.05 | 19.4 | 0.02 |
| Q1409+095 | 2.456 | 2.060.08 | 20.530.08 | 14.270.03 | 20.4 | 0.69 | 13.740.03 | 19.9 | 0.25 |
| Q2059-360 | 3.083 | 1.770.09 | 20.980.08 | 14.070.04 | 19.9 | 0.08 | 13.730.03 | 19.6 | 0.04 |
| Q2138-444 | 2.852 | 1.740.05 | 20.980.05 | 14.77 | 20.5 | 0.37 | 14.450.03 | 20.3 | 0.22 |
| Q2206-199 | 2.076 | 2.320.05 | 20.440.05 | 13.760.03 | 20.1 | 0.48 | 13.710.03 | 20.2 | 0.53 |
| Q2243-605 | 2.331 | 0.850.05 | 20.650.05 | 14.98 | 19.9 | 0.17 | 14.73 | 19.7 | 0.12 |
Appendix A Notes on individual systems
Q0027-186
O vi 1031 is blended below 50 km s-1 and above 200 km s-1, but
shows strong absorption components near 0, 50, 125, and 175 km s-1, as
does the C iv profile.
O vi 1037 appears to be unblended in the ranges
100 to 60 km s-1 and 180 to 220 km s-1, where the
profile shows similar components to those seen in C iv.
In our analysis we adopt log =15.090.03, based on the results from a Voigt fit to the unblended
parts of each O vi profile.
The AOD integration of Si iv 1393 yields a slightly higher
column density (by 0.11 dex) than 1402, so
1393 may be partly blended.
Q0112-306
Both O vi 1031 and 1037 are blended at
km s-1. At km s-1 both O vi lines show the same
profile, which is clearly smoother than the C iv.
We only present a lower limit to in this system using a
Voigt fit to the data at km s-1.
At least eight components are seen in the C iv and Si iv data.
Q0450-131
Both N v 1238 and 1242 show three components.
Strong corresponding O vi is seen in
1031 and 1037, which have consistent optical depth
profiles. C iv and Si iv data do not exist.
The QSO is 17 900 km s-1 away from the DLA.
Full details of the neutral gas in this system are published in Dessauges-Zavadsky et al. (2006).
Q0528-250
This DLA is 3 600 km s-1 more redshifted than the QSO and may be a QSO
intrinsic absorber. Though the O vi continuum placement is
difficult due to a high density of lines,
absorption features appear in 1031 at
150, 50, and 25 km s-1, the velocities of
strong Si iv and C iv absorption components.
Our value for derives from a four component fit to the data.
The data show two very good detections of N v with
identical column densities measured in each line.
Q0841+129
This system is separated from the host quasar by 2050 km s-1.
Though there are several blends near O vi 1031 and
1037, two components appears in both lines with the
same optical depth profile in the range 100 to 0 km s-1.
with the stronger component at 65 km s-1.
No C iv or Si iv data are currently available, and N v is not
detected.
The neutral gas in this DLA is studied in Dessauges-Zavadsky et al. (2006).
Q0913+072
There are several blends near O vi 1031 and
1037, but we verify O vi absorption in the velocity range
22 to 80 km s-1 since the 1037 profile shows the same
column density profile as 1031 in this interval.
The C iv and Si iv data show at least
four components over an interval of 200 km s-1.
Q1337+113
O vi 1037 is blended, but the 1031 profile shows a
single component with a similar
profile to C iv, giving a
ratio that is, within the errors, flat with velocity over a 60 km s-1 range.
This is the only DLA in our sample where this ratio is flat.
No N v is seen.
Q1409+095
O vi 1031 is blended, but the 1037 profile shows the
same two components
(central velocities of 19 and 35 km s-1)
as are seen in C iv and Si iv.
In C iv and O vi, the 35 km s-1 component is stronger than the
19 km s-1 component.
In Si iv and Si ii, the 19 km s-1 and 35 km s-1 components are of equal strength, showing that the Si iv follows the neutral gas in this case.
N v is not detected.
Q2059-360
This DLA is only 500 km s-1 away from the QSO.
O vi 1031 is blended; O vi 1037 shows a clean
detection of a single component, with a similar width to the C iv absorption.
Three components appear in the higher S/N C iv data, so the C iv/O vi ratio is non-linear with velocity.
This represents our highest redshift DLA O vi detection.
Q2138-444
O vi 1031 shows absorption between 300 and 0 km s-1,
but is blended above 0 km s-1. The O vi 1037 profile
is identical to 1031 in the range 160 to 20 km s-1,
confirming the detection of O vi, though the continuum placement is
difficult.
The C iv profiles broadly follows the O vi 1031 profile
in the range 300 to 0 km s-1, although more subcomponents appear in
the C iv data.
Q2206-199
This sight line shows a single O vi absorption component in both
1031 and 1037.
Two components are revealed in the higher S/N Si iv and C iv data,
separated by 20 km s-1.
The O vi appears to be aligned with the weaker C iv component
centered at 13 km s-1. See Prochaska & Wolfe (1997a) for a detailed analysis of this DLA; our total C iv and
Si iv column densities are in agreement with the earlier published values.
Q2243-605
O vi 1031 and 1037 are each blended at different
velocities but O vi components centered near 350, 200,
and 100 km s-1 correspond to features seen in C iv.
A Lyman- line at is identified at 270 km s-1 in
the O vi 1031 frame.
We only present a lower limit to in this system based on
a 3-component Voigt profile fit to the unblended data.
N v is detected in both 1238 and 1242, at velocities
where the C iv and O vi optical depths are highest.
At least 14 components are seen in the C iv data over a velocity range
of 500 km s-1.
C iv and Si iv follow each other in the series of
absorption components in the range 225 to 0 km s-1, but the C iv profile
shows many additional components in the range 500 to 225 km s-1 that have no counterparts in Si iv.
See Lopez et al. (2002) for a detailed analysis of this DLA.