On the Nature of the Solar Chromosphere
Abstract
DOT high-resolution imagery suggests that only internetwork-spanning H “mottles” constitute the quiet-sun chromosphere, whereas more upright network “straws” in “hedge rows” reflect transition-region conditions.
Sterrekundig Instituut, Utrecht University, The Netherlands
Institute of Theoretical Astrophysics, University of Oslo, Norway
1. Introduction
In my talk I skipped a planned discourse on definitions of the chromosphere because Philip Judge had just admirably done so (these proceedings). I then used movies from the Dutch Open Telescope111All DOT data are public and available under DOT database at http://dot.astro.uu.nl. The movies that I showed and sample here in Figs. 1 and 2 reside there also, under DOT movies. (Rutten et al. (2004)) to argue that much so-called chromosphere is actually transition region, that much other so-called chromosphere is actually upper photosphere, and that only those H mottles and fibrils that span across and between internetwork cells and active regions constitute the actual chromosphere. I compress the argument here into a two-figure summary of the evidence and a list of brief conjectures with explanatory cartoons. The upshot is that radiation modeling of the field-guided filamentary features (mottles, fibrils, spicules, “straws”) that infest – if not constitute – the quiet-sun domain between photosphere and corona should mix steep gradients in varied configurations with thick-to-thin radiation simulation containing everything from LTE to coronal conditions. One conjecture is that the latter dominate such things as Ca II H & K superbasal magnetic-activity emissivity, making that a transition-region diagnostic.
2. Evidence
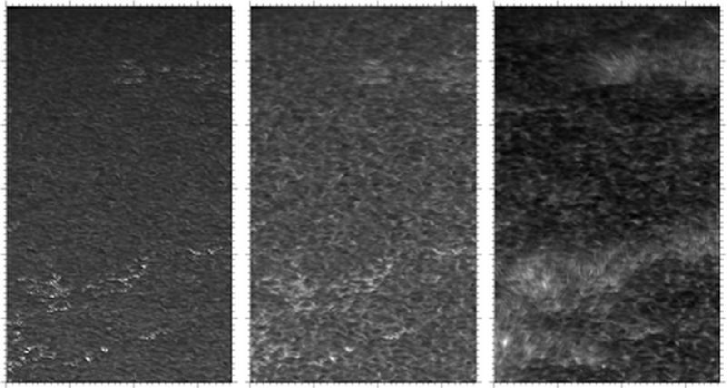
Fig. 1 shows Ca II H “straws” at right: long thin emission features in Ca II H, in rows jutting out from active network, seen near the limb against a dark background of reversed granulation. The latter is photospheric and is sampled only slightly deeper in the other two images.
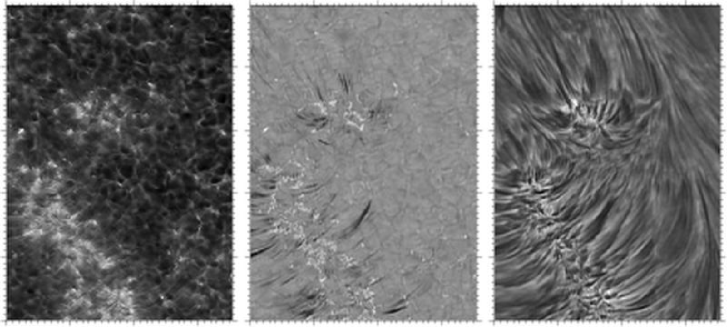
Fig. 2 shows active network on the disk. The strikingly bright H -wing network bright points form in the deep photosphere; the different-morphology Ca II H network bright points form higher up. The H core shows its proprietary filamentary structures habitually called “mottles” in quiet sun, “fibrils” when jutting out from active regions, “spicules” off the limb. Those in Fig. 2 are mottles but with large-scale organization from avoiding the filament (the campaign target) just outside these cutouts. They tend to have bright near-network beginnings, especially in active plage.
The H disk mottles are not seen in Ca II H. Reversely, Ca II H limb straws do not stand out between all other mottles seen in H line center near the limb. They gain hedge-row prominence there only in the outer H wings, as slender isolated dark features against the bright H -wing background which appears when the internetwork is no longer occulted by cell-spanning mottles.
The VAULT-2 Ly images at http://wwwsolar.nrl.navy.mil/rockets/vault/archives.html (cf. Korendyke et al. (2001)) show dense, 5000 km-high hedge rows of abruptly ending bright upright straws above network near the limb, twice as high and much thicker than in Ca II H. In addition, they show weaker and flatter rosettes fanning out from network that also end abruptly, an opaque dark floor of long mottles covering internetwork areas. On-disk plage appears as a dense forest of short bright stalks and bright grains.
Comparison of the Ca II H, H , and Ly scenes raises questions:
-
1.
Similarities: how can these various structures appear simultaneously in Ly, H , and Ca II H? A similar question as the old one why off-limb spicules appear in all of He I D3, H , and Ca II K, but adding Ly.
-
2.
Differences: the hedge rows of upright straws are bright and optically thick in Ly, bright and thin in Ca II H, much less distinct and dark in H line center, more prominent but less upright and very dark in the H wings. The cell-spanning H mottles are not seen in Ca II H and only as a dark floor in Ly. Why?
3. Considerations
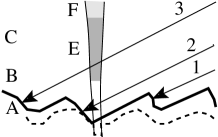
The left part of Fig. 3 is a schematic consideration of the scenes in Fig. 1. Mid-photosphere regime A (tenuous fluxtubes in reversed granulation) is currently well understood: time-dependent magnetoconvection plus LTE radiation simulations explain G-band bright points, faculae, and reversed granulation very well (Shelyag et al. (2004), Keller et al. (2004), Carlsson et al. (2004), Leenaarts & Wedemeyer-Böhm (2005)). Internetwork upper-photosphere regime B requires time-dependent NLTE modeling as in the acoustic shock simulation of Carlsson & Stein (1997), but does not produce noticeable Ca II H emission outside acoustic grains because the shocks do not heat on average. Internetwork regime C is transparent in Ca II H. Fluxtube regime E makes the straws in Fig. 1 bright. Fluxtube regime F starts where they end, corresponding to spicule heights on the limb.
Since the straws appear without contributions from regimes B and C their intensity is, in homogeneous-cloud approximation:
| (1) |
where is the background temperature and the optical thickness of the straw along the line of sight. The second version requires . The straw source function is:
| (2) |
adding the contributions from resonant scattering, thermal lower-to-upper level excitation, and multi-level roundabout photon production. In the optically thin limit without irradiation (as in coronal conditions) use of the emissivity and geometrical straw thickness is more direct: .
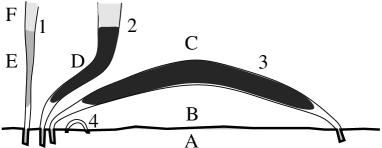
Right: different filamentary structures. A similar cartoon is shown in Fig. 2 of Fontenla et al. (1993); compare also Judge’s sketch in these proceedings. Rough temperatures: D104 K, E105 K, F106 K. Outside regimes: A = photosphere with normal/reversed granulation and tenuous magnetic elements, B = upper internetwork photosphere pervaded by acoustic shocks but nevertheless cool, C = transparent in H & K, H , and Ly. Type 1: bright upright H & K and Ly network straws opening into coronal plasma. On the disk they produce grainy H & K line-center, H line-center, and Ly full-profile emission in network and plage (Fig. 2). Type 2: dark H mottles bending upward into hot plasma from unipolar crowding. They represent the on-disk “spicules” modeled by De Pontieu et al. (2004) as due to -mode mass loading. They end abruptly where the shocked cool gas meets transition-region temperatures. Above plage they cause rapid occultive flickering of TRACE 171 Å brightness (“moss”) through bound-free hydrogen and helium scattering out of the TRACE passband (Berger et al. (1999), Rutten (1999)). Type 3: dark H mottles spanning across cell interiors in bipolar network without hot-plasma connectivity. They are reasonably well represented by the classical modeling of Giovanelli (1967), Beckers (1968, 1972), Heinzel & Schmieder (1994) as opaque clouds of order 104 K. Type 4: short weak-field near-network loops postulated by Schrijver & Title (2003). They lack the Wilson depressions that turns types 1–3 into bright points in photospheric diagnostics and the mass loading that makes types 2 and 3 dark in chromospheric H .
4. Conjectures
-
1.
Structures: there are four distinct types of filamentary structures in the quiet-sun regime between photosphere and corona, sketched at right in Fig. 3. Type 1 and 2 connect upward into hot conditions where they end abruptly. Type 1 is rather straight and upright, remains slender to large height, and is hot and dense from unidentified mass and energy filling. Type 2, often arranged in sheets, is less hot from propagative -mode mass loading from below as suggested by De Pontieu et al. Type 3 is supposedly loaded similarly or by siphoning, but does not connect into hot conditions and remains cool. Type 4 is conjectured by Schrijver & Title (2003) but is hard to observe if neither evacuation nor filling gives them brightness signature.
-
2.
Regimes: the regime C surroundings of types 1–3 are transparent in Ca II H, H , and Ly, most likely from being coronally hot and tenuous. Upper-photosphere regime B is cool outside shocks, does not produce much Ca II H line-center emissivity, is transparent throughout H due to low H I population, and is largely shielded by type-3 loops in Ly and H center.
-
3.
Ly: type 1 produces the thick hedge rows of network straws in the VAULT-2 near-limb images. Their appearance suggests thermal Ly emission from optically thick straws with if effectively thin and growing to for the thickest ones. Since is likely small, must be high. The bright grains abounding in disk plage are due to type-1 along-the-straw viewing. The abruptly ending rosette fans correspond to type 2. Type 3 constitutes the dark opaque internetwork background, with . Regime C must be transparent through being coronal, not only hot but also tenuous since at coronal temperatures H I maintains as much as fractional population (J. Raymond).
-
4.
Other UV lines: type 1 produces network brightness in UV lines across many stages of ionization. The systematic downdrafts observed in these suggest energy transfer from above.
-
5.
Ca II H: type 1 also produces the Ca II near-limb straws, in similar fashion to the Ly ones but at smaller opacity, half as long, and with photospheric internetwork background. The contribution in Eq. (2) is likely important through dielectronic recombination since Ca II ionizes to closed-shell Ar configuration. It still has 10-3 fractional population at K in coronal conditions (Mazzotta et al. (1998)), or nearly 1% of the H I population density. In any case, Ca II level must have considerable population in the straws compared to regime C. Somewhere along the fluxtube the magnetic-element brightness must flip from being due to evacuation to being due to excess filling (cf. Sheminova et al. (2005)). On the disk, viewing along straws produces the bright Ca II H network grains and the short bright filaments jutting out from the Ca II H network at high resolution (Fig. 2). The straws also cause the wide-spread diffuse Ca II H brightness around network, the diffuseness arising from lack of resolution, small optical thickness through slanted straws, and resonance and electron scattering.
-
6.
H on the disk: type-3 mottles occult the underlying photosphere at line center. They can be dark or bright (cf. Heinzel & Schmieder (1994)), especially when images are scaled for optimum display contrast. Type 2 produces dark mottles jutting out from network with abrupt endings. Following the conjecture of De Pontieu et al. they should show substantial five-minute modulation in their Dopplershift and endpoint locations. The bright beginnings of type 2 and 3 mottles that are frequently observed near active network and plage are likely due to Lyman (lines and continuum) irradiation by type-1 straws. Type 1 appears also in on-the-disk H line center as bright grains and diffuse emission. In the wings only type-2 structures remain visible, always dark because the photospheric background is relatively bright in H (Leenaarts et al. (2006a)). Dopplershifts cause extra type-2 darkening, most frequently in the blue wing through blueshift.
-
7.
H at the limb: types 1 and 2 gain H conspicuousness in the line wings in which type 3 vanishes. Larger line width increases their far-wing visibility on the disk but decreases their off-limb contrast as spicules (A.G. de Wijn).
-
8.
Modeling: chromospheric modeling should upgrade to the comprehensive VAL/FAL radiation treatment of Vernazza et al. (1981) and Fontenla et al. (1993) which covers the whole gamut from high-density LTE in their photospheric bottoms through NLTE and PRD to coronal conditions at their K model tops – but not in 1D radial geometry but for chromospheric cylinders and sheets, with variation in orientation, density, and temperature, embedded in coronal or upper-photosphere surroundings, and possessing transition-region sheaths to these and upward coronal contact as in types 1 and 2. The next step is to feed them mass from below through dynamic pistoning including -modes and convective squirting (Babcock & Babcock (1955)), and energy from above through conduction.
-
9.
Nomenclature: the chromosphere consists primarily of type-3 mottles and fibrils. They appear as a crowded H forest at the limb and collectively cause the purple H + H flash at the onset of totality for which the chromosphere is rightfully named. Later definitions as “initial outward temperature rise” or “layer between the temperature minimum and the transition region” should be disavowed. Regime B, extending over km, is non-purple “upper photosphere” or “clapotisphere” (Rutten (1995)). Regime C is coronal. The transition region is extremely warped, consisting of the regime E parts of type-1 straws plus the D-F interface in type 2 mottles plus thin low-emissivity D-F sheaths along type 2 and 3 mottles. As a spherical shell it exists only around the fictitious but superbly didactic star VALIII (Rutten (2003)).
-
10.
Cool-star activity: the superbasal “Ca II emission” which is so useful as stellar activity indicator (Rutten et al. (1991), Schrijver (1995)) comes primarily from type 1 structures, just like Ly and other UV lines. That’s why Ca II H & K excess flux correlates so well with UV line fluxes. H & K network bright points are “transition region” diagnostics just like those.
Acknowledgments.
I thank Pit Sütterlin for the DOT observations, Marcel Haas, Jorrit Leenaarts, Július Koza, John Raymond, and Alfred de Wijn for discussions and comments, Han Uitenbroek for hospitality, the Leids Kerkhoven-Bosscha Fonds for travel support, and NASA’s Astrophysics Data System for serving much literature.
References
- Babcock & Babcock (1955) Babcock H. W., Babcock H. D., 1955, ApJ 121, 349
- Beckers (1968) Beckers J. M., 1968, Sol. Phys. 3, 367
- Beckers (1972) Beckers J. M., 1972, ARA&A 10, 73
- Berger et al. (1999) Berger T. E., De Pontieu B., Fletcher L., Schrijver C. J., Tarbell T. D., Title A. M., 1999, Sol. Phys. 190, 409
- Carlsson & Stein (1997) Carlsson M., Stein R. F., 1997, ApJ 481, 500
- Carlsson et al. (2004) Carlsson M., Stein R. F., Nordlund Å., Scharmer G. B., 2004, ApJ 610, L137
- De Pontieu et al. (2004) De Pontieu B., Erdélyi R., James S. P., 2004, Nat 430, 536
- Fontenla et al. (1993) Fontenla J. M., Avrett E. H., Loeser R., 1993, ApJ 406, 319
- Giovanelli (1967) Giovanelli R. G., 1967, Australian Journal of Physics 20, 81
- Heinzel & Schmieder (1994) Heinzel P., Schmieder B., 1994, A&A 282, 939
- Keller et al. (2004) Keller C. U., Schüssler M., Vögler A., Zakharov V., 2004, ApJ 607, L59
- Korendyke et al. (2001) Korendyke C. M., Vourlidas A., Cook J. W., Dere K. P., Howard R. A., Morrill J. S., Moses J. D., Moulton N. E., Socker D. G., 2001, Sol. Phys. 200, 63
- Leenaarts et al. (2006a) Leenaarts J., Rutten R. J., Sütterlin P., Carlsson M., Uitenbroek H., 2006, A&A 449, 1209
- Leenaarts & Wedemeyer-Böhm (2005) Leenaarts J., Wedemeyer-Böhm S., 2005, A&A 431, 687
- Mazzotta et al. (1998) Mazzotta P., Mazzitelli G., Colafrancesco S., Vittorio N., 1998, A&A Suppl. 133, 403
- Rutten et al. (1991) Rutten R. G. M., Schrijver C. J., Lemmens A. F. P., Zwaan C., 1991, A&A 252, 203
- Rutten (1995) Rutten R. J., 1995, in ESA SP-376: Helioseismology, 151
- Rutten (1999) Rutten R. J., 1999, in ASP Conf. Ser. 184: Third Advances in Solar Physics Euroconference: Magnetic Fields and Oscillations, p. 181
- Rutten (2003) Rutten R. J., 2003, Radiative Transfer in Stellar Atmospheres, Lecture Notes Utrecht University, 8th Edition, http://www.astro.uu.nl/~rutten
- Rutten et al. (2004) Rutten R. J., Hammerschlag R. H., Bettonvil F. C. M., Sütterlin P., de Wijn A. G., 2004, A&A 413, 1183
- Schrijver (1995) Schrijver C., 1995, A&AR 6, 181
- Schrijver & Title (2003) Schrijver C. J., Title A. M., 2003, ApJ 597, L165
- Shelyag et al. (2004) Shelyag S., Schüssler M., Solanki S. K., Berdyugina S. V., Vögler A., 2004, A&A 427, 335
- Sheminova et al. (2005) Sheminova V. A., Rutten R. J., Rouppe van der Voort L. H. M., 2005, A&A 437, 1069
- Vernazza et al. (1981) Vernazza J. E., Avrett E. H., Loeser R., 1981, ApJS 45, 635