Cold CO Gas in Protoplanetary Disks
Abstract
In a disk around DM Tau, previous observation of 13CO ( and transitions) derived the 13CO gas temperature of K, which is lower than the sublimation temperature of CO (20 K). We argue that the existence of such cold CO can be explained by a vertical mixing of disk material. As the gas is transported from a warm layer to a cold layer, CO is depleted onto dust grains with a timescale of yr. Because of the steep temperature gradient in the vertical direction, an observable amount of CO is still in the gas phase when the fluid parcel reaches the layer of K. Apparent temperature of CO decreases as the maximum grain size increases from m-size to mm-size.
1 Introduction
Theoretical models previously showed that the protoplanetary disks can be divided to three layers in the vertical direction from a chemical point of view (Aikawa & Herbst, 1999; Willacy & Langer, 2000; Aikawa et al., 2002; Bergin et al., 2006). Surface layer of the disk is a PDR (photon-dominated region) because of the interstellar UV, stellar UV, and stellar X-rays. As we go deeper into the disk, the radiation becomes weaker, and the density gets high enough to allow high abundances of organic molecules. In the midplane, on the other hand, heavy-element species are mostly depleted onto grains because of very high density and very low temperature. The three-layer model naturally explains the characteristics of the disk chemistry observed in radio wavelengths: low average abundances of gaseous organic species and relatively high abundances of radical species (ex. CN/HCN ratio) in comparison with the molecular clouds(Dutrey et al., 1997; Qi et al., 2003; Thi et al., 2004). Molecular emission lines arise mostly from the intermediate molecular layer, because it is chemically rich and spans a density range that covers critical densities of many (sub-)millimeter rotational transitions.
Dartois et al. (2003) observed two rotational transitions ( and ) of various CO isotopes, from which they derived 12CO temperature to be 30 K and 13CO temperature K. Since the 13CO lines trace the deeper layer of the disk than the 12CO lines, it was the first observational evidence that the gas temperature increases with height from the midplane at radii of AU, which are traced by the current radio telescopes. In addition, the 13CO temperature challenges the theoretical model; since the sublimation temperature of CO is K, a layer with K is considered to be the freeze-out layer.
Recently, Aikawa & Nomura (2006) briefly argued that existence of such cold CO can be explained by vertical mixing due to turbulence. In the vertical direction gas can migrate over AU in the vertical direction, and thus can travel from the K layer to the K layer within yr, which is comparable to a freeze-out timescale in the DM Tau disk. In this paper, we examine their arguments in more detail using various disk models. The rest of the paper is organized as follows. In §2, we derive a typical migration length of material within the freeze-out timescale of CO. In §3, a distance between the K and 20 K layers is measured in various disk models, and is compared with the migration length. We compare our results with the recent numerical calculation of turbulent disk chemistry in §4. Summary is contained in §5.
2 Basic Equations
Following Willacy et al. (2006), we consider a vertical mixing in the disk. The net transport flux of species by the turbulent diffusion is
| (1) |
where is the abundance of species relative to the number density of hydrogen molecule . We assume that the diffusion coefficient is equal to the viscosity coefficient: where is the turbulent velocity, is the mixing length, is the alpha-viscosity parameter (Shakura & Sunayev, 1973), is the sound velocity, and is the scale height of the disk. The chemical continuity equation is
| (2) |
where and are the chemical production and loss terms for species .
We now consider the steady-state abundance distribution of CO near the boundary between the warm molecular layer and freeze-out layer. Since CO is the most abundant and stable species among the carbon-bearing species in the warm molecular layer, the main production and loss terms are desorption from and adsorption onto grains, respectively. As the matter is transported from the warm molecular layer to the freeze-out layer, the desorption term becomes negligible. Hence the vertical distribution of CO is determined by the diffusion from the warm molecular layer and the adsorption onto grains, i.e.
| (3) |
where is the grain radius, is the sticking probability, is the Boltzman constant, (CO) is the mass of CO molecule, and is the grain number density. In order to derive an analytic solution, we neglect the density gradient (), which is justified because the abundance gradient is steeper than the density gradient. Then the basic equation is reduced to
| (4) |
The analytic solution for this equation is
| (5) |
where is the canonical CO abundance () in the warm molecular layer and is the height of K layer, i.e. the boundary between the warm molecular layer and freeze-out layer. The decay length is given by
| (6) |
In other words, material can migrate from the boundary to within the freeze-out timescale of CO.
3 Results
In this section, we evaluate in various disk models. Considering the vertical temperature gradient, we discuss if the turbulence can transport observable amount of CO to the K layer.
3.1 Migration length of CO and vertical temperature gradient
The decay length is determined by the ratio between the rate coefficient of adsorption and diffusion coefficient. The former depends on temperature, sticking probability, and total grain surface area. Temperature is set to be 17 K, since we are interested only in a region between 13 K and 20 K, and since the dependence of on temperature is not strong. Sticking probability is set to be 0.5. As for dust grains, we assume dust/gas mass ratio of 1% and grain radius of cm. The number density of grain is then , where is the number density of hydrogen nuclei. If the grain size distribution follows the MRN model (Mathis et al., 1997), the total surface area () of dust grains should be about three times larger than assumed in our model. However, observations suggest that the dust grains in disks are larger than the interstellar dust(D’Alessio et al., 2001; Rodmann et al., 2006). Dependence of our results on grain size in disks will be discussed in the next subsection.
The diffusion coefficient depends on and scale height. We assume . Analyzing the CO emission lines in DM Tau disk, Guilloteau & Dutrey (1998) found the intrinsic local velocity dispersion is essentially thermal, with a turbulent component of 0.05 km s-1 km s-1, while Dartois et al. (2003) estimate km s-1. Thus by setting , we assume the mixing length of several . The scale height of the disk is given by
| (7) |
where is the mean molecular weight, is the hydrogen mass, is the gravitational constant, and is the mass of the central star. We assume and . Then is given as a function of hydrogen number density and disk radius :
| (8) |
Here we evaluate in two disk models from literature: DM Tau disk model, which is constructed to fit the SED assuming the grain size of 0.1 m (Ceccarelli et al., 2005), and a model by D’Alessio et al. (1999), who assumed interstellar-type dust is well mixed with gas. Models give and as a function of and . At each radius we calculate using in the layer of K. In Figure 1, asterisks, open boxes, and crosses depict with the density at K layer, K layer, and with the average density of K layer at each radius, respectively. The black marks are the DM Tau disk model and the gray marks are the D’Alessio et al. (1999) model. For example, is cm-3 at the boundary between the molecular layer and the freeze-out layer at AU in both models. Then the decay length is AU.
Also shown in Figure 1 (closed circles) is the distance between the layers of K and 13 K, , at each radius in the two disk models. It can be seen that at radius of AU, is about 4 times larger than . In other words, when the disk material transported vertically from the 20 K layer to the 13 K layer, gaseous CO is times the canonical value.
It should be noted that the column density of CO gas with K is given by , where is the number density of CO molecule at the 20 K layer (). At the radius of 400 AU, for example, is about 10 AU, and (CO) is cm-3. Then the column density of 12CO with K is cm-2, which corresponds to the opacity of for the emission line of 13CO, assuming the isotope abundance ratio of CO)/CO). Therefore, the amount of cold 13CO produced by the turbulent mixing is high enough to account for the observation by Dartois et al. (2003).
Finally, it is obvious from the equation (6) that in the disks with larger (smaller) , is larger (smaller), and thus the cold CO is more (less)abundant.
3.2 Effect of grain growth
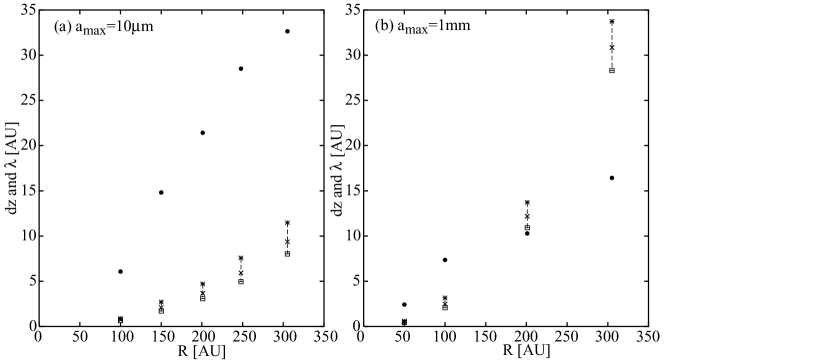
So far, we have assumed that dust grains in disks are similar to the interstellar grains. However, observations suggest grains in disks are larger than the interstellar grains. Dust lane width of edge-on disks is smaller than that of model disks with interstellar grains. The SED is better reproduced by the disk models with the maximum grain radius in millimeter range (D’Alessio et al., 2001). In this subsection, we compare the decay length and the vertical temperature gradient in the disk models of Aikawa & Nomura (2006). They investigated the effect of grain growth on disk structure ( and ); the number density of grains with radius is assumed to be proportional to , and the maximum size is varied with the dust/gas mass ratio fixed.
Figure 2 compares and in the models with (a) m and (b) 1 mm. Compared with the case of uniform grain size (m), the total surface area of grains is smaller by a factor of (a) 0.3 and (b) 0.03. Because of the smaller total surface area of grains, the adsorption time scale and thus are larger in the model with mm (see eq. 6). On the other hand, is smaller in mm model than in m model at AU. Temperature in the disk atmosphere is lower, and hence the vertical width of the disk is smaller in the model with larger , because of the reduced number of small grains which mainly contribute to the absorption of stellar light. At AU, the temperature in the midplane layer increases with grain growth, and is slightly larger in the mm model. We can conclude that at AU the amount of cold CO gas increases as the increases from m to 1 mm.
4 Discussion
Recently Semenov et al. (2006) investigated the molecular evolution in a turbulent disk by coupling the chemical reaction network and turbulent diffusion. They showed that the two-dimensional diffusion increases the amount of cold CO, but the amount is too small to account for the observation by Dartois et al. (2003). Why is the cold CO much less abundant in their model than estimated in the present work?
We suspect that the deficiency of cold CO is caused by the too efficient grain-surface reactions. Even in the K region in their static model, CO abundance is much smaller than the canonical value. Inclusion of the vertical diffusion reduces the cold CO, because more CO is converted to H2CO by grain-surface reactions (see their §3). Since the sublimation temperature of H2CO is higher than that of CO, the hydrogenation depletes CO at K. The rate of hydrogenation, however, seems to be overestimated in their model, as discussed below.
In the layer of K at AU, we estimate the number density of H atoms (not included in H2) in the gas phase to be cm-3, referring to the model of Aikawa & Nomura (2006) with m. The number of H atoms accreting onto a grain with radius is
| (9) |
The desorption rate, on the other hand, is
| (10) |
where is the number density of adsorption sites on a grain ( cm-2), and is the adsorption energy (Herbst, 1993). If is 350 K (Hasegawa & Herbst, 1993), the desorption rate is s-1 at 20 K. Hence a number of H atoms on a dust grain is much smaller than unity even for grains with m. With such a low H atom abundance on a grain, the hydrogenation rate is limited by the accretion rate rather than determined by a migration rate on a grain (Caselli et al., 1998). According to the model description of Semenov et al. (2006), they seems to have estimated the hydrogenation rate using the migration rate, which can be an overestimate.
Reality can be more complex than the above argument. For example, grains are not spherical but would be porous, which will enhance the possibility of reaction before desorption (Perets & Biham, 2006). On the other hand, laboratory experiment suggests that CO is hydrogenated only in the surface layer of the ice mantle (Watanabe et al., 2003). Most of the currently-available astrochemistry models may overestimate the hydrogenation rates, since they do not discriminate the surface species from species inside ice mantle. Modeling the grain-surface reactions is still a challenging subject in the astrochemical studies.
However, it is an observational fact that cold ( K) CO gas exists in the disk. If the CO depletion is caused by hydrogenation in the model by Semenov et al. (2006), it tells us even the abundance of simple gaseous species can be dependent on how we model the grain-surface reactions – an important caution for future models.
5 Summary
We have shown that in protoplanetary disks the turbulent diffusion can produce observable amount of CO that is colder than the sublimation temperature. As disk material is transported to the layer with K, freeze out proceeds with timescale of . Since the gas migrates over a distance of AU within this timescale, CO gas of column density cm-2 exists in the cold ( K) layers, which explains the observation by Dartois et al. (2003). As the dust grains in the disk become larger by coagulation, the freeze-out time scale increases, and the vertical temperature gradient at K gets steeper. Hence, the apparent CO temperature decreases as the maximum grain size increases from m-size to mm-size.
References
- Aikawa & Herbst (1999) Aikawa, Y. & Herbst. E. 1999, A&A, 351, 233
- Aikawa & Nomura (2006) Aikawa, Y. & Nomura, H. 2006, ApJ, 642, 1152
- Aikawa et al. (2002) Aikawa, Y., van Zadelhoff, G. J., van Dishoeck, E. F., & Herbst, E. 2002, A&A, 386, 622
- Bergin et al. (2006) Bergin, E. A., Aikawa, Y., van Dishoeck, E. F., & Blake, G. A. 2006, in Protostars and Planets V, ed. B. Reipurth (Tucson: Univ. Arizona Press), in press
- Caselli et al. (1998) Caselli, P., Hasegawa, T. I., & Herbst, E. 1998, ApJ, 495, 309
- Ceccarelli et al. (2005) Ceccarelli, C., Dominik, C., Caux, E., Lefloch, B., & Caselli, P. 2005, ApJ, 631, L81
- D’Alessio et al. (1999) D’Alessio, P., Calvet, N., Hartmann, L., Lizano, S., & Cantó, J. 1999, ApJ, 527, 893
- D’Alessio et al. (2001) D’Alessio, P., Nuria, C., & Hartmann, L. 2001, ApJ, 553, 321
- Dartois et al. (2003) Dartois, E., Dutrey, A., & Guilloteau, S. 2003, A&A, 399, 773
- Dutrey et al. (1997) Dutrey, A., Guilloteau, S., Gulin, M. 1997, A&A, 317, L55
- Guilloteau & Dutrey (1998) Guilloteau, S. & Dutrey, A. 1998, A&A 339, 467
- Hasegawa & Herbst (1993) Hasegawa, T. I., & Herbst, E. 1993a, MNRAS, 261, 83
- Herbst (1993) Herbst, E. 1993, in Dust and Chemistry in Astronomy, eds. Millar, T. J., & Williams, D. A. (Institute of Physics Publishing), p. 183
- Mathis et al. (1997) Mathis, J. S., Rumpl, W., & Nprdsieck, K. H. 1977, ApJ, 217, 425
- Perets & Biham (2006) Perets, H. B. & Biham, O. 2006, MNRAS, 365, 801
- Qi et al. (2003) Qi, C., Kessler, J. E., Koerner, D. W., Sargent, A. I., & Blake, G. A. 2003, ApJ, 597, 986
- Rodmann et al. (2006) Rodmann, J., Henning, Th., Chandler, C.J., Mundy, L., & Wilner, D.J. 2006, A&A, 446, 211
- Semenov et al. (2006) Semenov, D., Wiebe, D., & Henning, Th. 2006, ApJL, in press
- Shakura & Sunayev (1973) Shakura, N.I. & Sunyaev, R.A. 1973, A&A 24, 337
- Thi et al. (2004) Thi, W. F., van Zadelhoff, G. J., & van Dishoeck, E. F. 2004, A&A, 425, 955
- Watanabe et al. (2003) Watanabe, N., Shiraki, T. & Kouchi, A. 2003, ApJL, 588, L121
- Willacy & Langer (2000) Willacy, K., & Langer, W. D. 2000, ApJ, 544, 903
- Willacy et al. (2006) Willacy, K., Langer, W., Allen, M., & Bryden, G. 2006, ApJ, 644, 1202