Weak Lensing of Galaxy Clusters in MOND
Abstract
We study weak gravitational lensing of galaxy clusters in terms of the MOND (MOdified Newtonian Dynamics) theory. We calculate shears and convergences of background galaxies for three clusters (A1689, CL0024+1654, CL1358+6245) and the mean profile of 42 SDSS (Sloan Digital Sky Survey) clusters and compare them with observational data. The mass profile is modeled as a sum of X-ray gas, galaxies and dark halo. For the shear as a function of the angular radius, MOND predicts a shallower slope than the data irrespective of the critical acceleration parameter . The dark halo is necessary to explain the data for any and for three interpolation functions. If the dark halo is composed of massive neutrinos, its mass should be heavier than eV. However the constraint still depends on the dark halo model and there are systematic uncertainties, and hence the more careful study is necessary to put a stringent constraint.
1 Introduction
MOND (MOdified Newtonian Dynamics) 111The phrase MOND is used here to refer to modified Newtonian gravity models without any dark matter. is a theoretical alternative to Newtonian dynamics, proposed by Milgrom (1983). The theory itself strengthens gravitational force at large distances (or small accelerations) to explain galactic dynamics without dark matter. The equation of motion is changed if the acceleration is lower than the critical value . It is well known that this theory can explain galactic rotation curves with only one free parameter: the mass-to-light ratio (see review Sanders & McGaugh 2002). There are two motivations to study such an alternative theory: (i) General Relativity (GR) has not been tested accurately at much larger scale than AU (ii) dark matter particles have not been directly detected and their nature still eludes us. Under these circumstances, several authors have recently studied alternative theories to GR (e.g. Aguirre 2003).
Bekenstein (2004) recently proposed a relativistic covariant formula of MOND (called TVS) by introducing several new fields and parameters. Following this, many authors began discussing relativistic phenomena such as parameterised Post-Newtonian formalism in the solar system Bekenstein (2004), gravitational lensing (e.g. Zhao et al. 2006), cosmic microwave background and large scale structure of the Universe Slosar et al. (2005); Skordis (2005); Skordis et al. (2006); Dodelson & Liguori (2006). In this paper, we discuss weak gravitational lensing of galaxy clusters.
Weak lensing provides an important observational method with which to test MOND. This is because weak lensing probes the lens potential outside of the Einstein radius, , where is the lens mass and is the distance to the source. The gravitational law changes outside the MOND radius, , where the acceleration is less than . Since , the Einstein radius is a few times smaller than the MOND radius , by a factor 2 at least, in the cosmological situation. Hence, we can test the MOND-gravity regime by weak lensing.
Weak lensing is superior to X-rays as a means of probing the outer region of clusters. The lensing signal (strength of the shear) is proportional to the surface density . On the other hand, the X-ray luminosity is proportional to the density squared and hence X-rays can probe the inner regions of clusters. Hence, the outer region of the clusters can be probed with weak lensing.
The gravitational lensing in MOND has been studied by many authors. Before Bekenstein proposed the relativistic formula, some assumptions were made222For example, Qin et al. (1995) assumed that the bending angle is times larger than that for massive particles in the limit of by analogy with GR. to calculate the lensing quantities Qin et al. (1995); Mortlock & Turner 2001a ; 2001b ; White & Kochanek (2001); Gavazzi (2002). Just after Bekenstein’s proposal, Chiu et al. (2006) and Zhao et al. (2006) first studied the lensing in detail and tested MOND with strong lensing data of galaxies. Zhao and his collaborators studied the gravitational lens statistics Chen & Zhao (2006) and investigated a non-spherical symmetric lens Angus et al. (2006). Recently, Clowe et al. (2006) indicated that a merging cluster 1E 0657-558 cannot be explained by MOND because the weak lensing mass peak is spatial offset from the baryonic peak (= mass peak of X-ray gas). However, Angus et al. (2007) noted that MOND can explain the data if the neutrino halo is included (see also Feix et al. 2007). Furthermore, the high observed collision velocity of the bullet clusters (shock velocity of ) is more readily obtained in MOND than CDM Angus & McGaugh (2007).
Jee et al. (2007) recently found a ring like dark matter structure at in CL0024+1654 by analysing strong and weak lensing data. They suggested that the ring was formed by the line-of-sight collision of two clusters, like the bullet cluster 1E 0657-558. Just after their discovery, Famaey et al. (2007) noted that MOND can easily explain the density of the ring by adding the massive neutrino of eV.
In this paper, we study three clusters (A1689, CL0024+1654, CL1358+6245) and mean profile of 42 SDSS (Sloan Digital Sky Survey) clusters. We calculate shears and convergences for these clusters and compare them with the observational data. We perform a fit of the data to give a constraint on the dark halo profile and the neutrino mass. Throughout this paper, we use the units of .
2 Basics
We briefly review the basics of gravitational lensing based on the relativistic MOND theory for a spherically symmetric lens model. Detailed discussions are given in Bekenstein (2004) and Zhao et al. (2006).

When a light ray passes through a lens with the impact parameter , the deflection angle is
| (1) |
where is the distance along the light path and is the distance from the lens center, (see Fig.1).
The gravitational force due to the lens is
| (2) |
where is the usual Newtonian acceleration and is the lens mass enclosed inside a radius . We use a standard interpolation function333 We also examine other interpolation functions to study its dependence in section 4. with . Then, (i.e. ) for , while (i.e. ) for .
The lens equation is
| (3) |
Here, and are the angular positions of the source and the image, and and are the angular diameter distances between the observer, the lens and the source.444We use the distance in the usual FRW (Friedmann-Robertson-Walker) model with and . The distance in MOND is almost the same as that in the FRW model Bekenstein (2004). The shear and the convergence are given by,
| (4) |
We note that if the mass increases as with , the shear and the convergence decrease as
| (5) |
from Eqs.(1)-(4). The slopes of and for are steeper than that for . This is because the gravitational force is proportional to for , and hence the force decreases more slowly at larger distances. Comparing the slope in Eq.(5) with the observational data, we can test MOND.
3 Analysis with Cluster Data
We calculate the shear and the convergence based on the MOND theory for the three clusters, A1689, CL0024+1654, CL1358+6245, and the mean profile of 42 SDSS clusters. The mass profiles of these clusters have been measured by gravitational lensing for a wider range of angular diameters, and hence these clusters are an appropriate system to investigate the angle-dependence of the shear and the convergence.
3.1 A1689
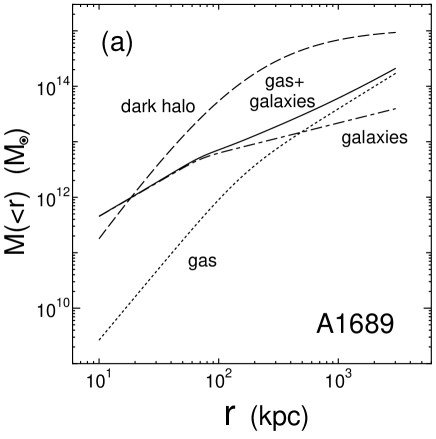
Several authors have been studying the mass profile of the rich cluster A1689 at 555 corresponds to kpc. by strong and weak lensing, X-ray emission of gas, and dynamics of cluster members (e.g. Limousin et al. 2006 and references therein). The analysis of lensing data shows a small ellipticity ( in Halkola et al. 2006) and supports the assumption of quasi-circular symmetry (Umetsu, Takada & Broadhurst 2007). Andersson & Madejski (2004) provided the hot gas mass profile (40kpc 1Mpc) directly determined by X-ray observational data of the XMM-Newton telescope. Zekser et al. (2006) gave the galaxy mass profile (20kpc 260kpc) from the surface brightness profile, assuming the constant mass-to-light ratio (B-band). Fig.2(a) shows the mass profiles of the gas (dotted), the galaxies (dashed), and the sum of them (solid line). We also show the dark halo profile which will be needed to match the observational data (we will discuss this later).
Fig.2(b) shows the Newtonian gravitational acceleration normalized to . As shown in this panel, the transition radius corresponding to (denoted by a horizontal dotted line) is kpc for the gas + galaxies and is at kpc if the dark halo is added.
Broadhurst et al. (2005a) measured the distortions of red galaxies over by the wide field camera, Suprime-Cam, of the Subaru telescope. Panel (c) shows their results, reduced shear profile . The mean source redshift is based on a photo-z estimation for deep field data. The solid line is the MOND theoretical prediction with . The gravitational source is only baryonic component (gas + galaxies). We note that for the solid line is clearly smaller than the data. This indicates that the gravitational force is too weak to explain the data. In order to solve this discrepancy, we need a very high mass-to-right ratio 666The shear and the convergence are proportional to the mass-to-light ratio for , while for .. Even if the critical acceleration value increases, the discrepancy could not be resolved. In this case, the amplitude of the shear increases but the slope is too shallow to fit the data. MOND predicts shallower slope than for (since in Eq.(5)), while the data in panel (c) clearly shows a steeper slope than this. Hence MOND cannot explain the data for any mass model and any acceleration parameter in the low acceleration region .
We comment on the dependence of the source redshift on the above results. The quantities and depend on through a combination of , , from Eqs.(3) and (4). Hence these slopes are independent of and the above results do not change. Furthermore the quantity is not sensitive to for relatively low lens redshift ( for this cluster).
Previously, Aguirre, Schaye & Quataert (2001), Sanders (2003), and Pointecouteau & Silk (2005) reached the same conclusion as ours by studying temperature profiles of clusters. They indicated that the temperature data near the core is higher than the MOND prediction. Sanders (2003) noted that if the dark matter core were added, this discrepancy could be resolved. Following the previous studies, we include the dark halo to explain the observational data. We use the dark halo with a flat core :
| (6) |
Here is the core radius and the density steeply decreases with proportional to for : . We perform a fit of the data in order to determine the parameters and . We also use the strong lens data (convergence field ) from Broadhurst (2005b) in panel (d) in order to put a strong constraint on the core radius. They constructed the convergence field at from 106 multiply images of 30 background galaxies by Hubble Space Telescope Advanced Camera for Surveys. The is given by where is the reduced shear and the convergence at the -th angle, is the data and is the standard deviation. The best fitted model is and kpc. These relative errors are less than because of combining the strong and weak lensing data. The minimized -value per degree of freedom (dof) is /dof . The results are insensitive to the mass-to-light ratio. As shown in panels (c) and (d), this model (dashed line) fits the data well. The dashed line in panel (c) is steeper than the solid line, since is the high acceleration region from panel (b) and hence the slope is steeper, as can be seen in Eq.(5).
We also try to fit the data by the other halo profiles : Navarro-Frenk-White (NFW) model , Hernquist model , isothermal (IS) with a core . The minimum are for NFW, for Hernquist, and for IS with core which are larger than for our model in Eq.(6). This is because the convergence data favor a flat core and the shear data favor a steeply decreasing profile.


3.2 CL0024+1654
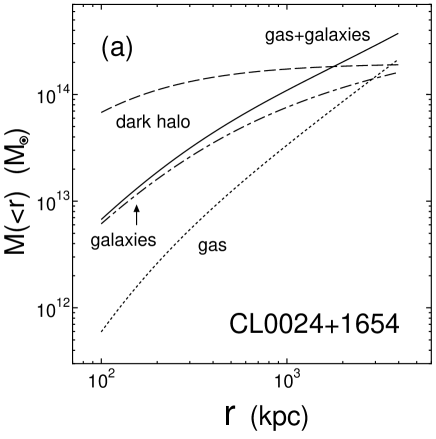
CL0024 is a rich cluster at ( corresponds to kpc) with a velocity dispersion of Dressler & Gunn (1992). Fig.3 (a) shows the mass profiles of the gas determined by the XMM-Newton telescope Zhang et al. (2005), the galaxies with a mass-to-right ratio (K-band) Kneib et al. (2003), and the dark halo. For the larger radius Mpc the baryonic mass exceeds the dark halo mass. This is because we extrapolate the gas profile (fitted by isothermal model for Mpc) to the larger radius. Kneib et al. (2003) provided the reduced shear profile up to measured by the Hubble Space Telescope as shown in panel (c). The mean source redshift is . We also use a constraint from an angular position of Einstein radius at (denoted by a black square ) based on an observation of giant arcs of distant galaxy at Smail et al. (1996); Broadhurst et al. (2000). The angular position of arcs is used to set a constraint on the enclosed mass within ( kpc). Similar to the previous case of A1689, for the solid line is smaller than the data, and we need the to solve this discrepancy. The best fitted halo model is and kpc in Eq.(6) with /dof . We caution that the core radius in the best fitting model is smaller than the inner most data point ( kpc), and hence this result has little meaning. It only means that the enclosed mass is inside of 140 kpc.


3.3 CL1358+6245
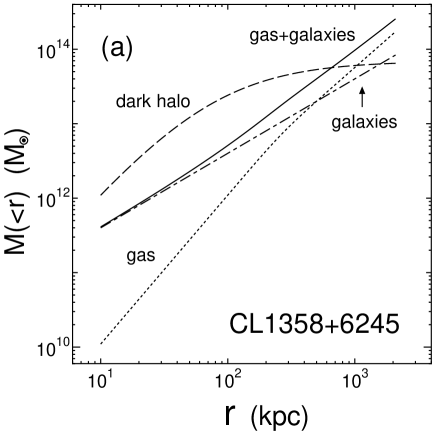
The redshift of CL1358 is and corresponds to kpc. Fig.3(a) shows the mass distribution of the gas Arabadjis et al. (2002), the galaxies with a mass-to-right ratio (V-band) Hoekstra et al. (1998), and the dark halo. Hoekstra et al. (1998) presented the reduced shear profile () measured by HST as shown in panel (c). They fitted the data by the isothermal sphere model with the velocity dispersion of km/s. The solid line is the MOND prediction with . We need the to fit the data if we assume only baryonic components. The best fitted model is and with kpc with /dof . Same as the case for CL0024, the core radius is smaller than the inner most data point. Although the discrepancy between the MOND prediction and the data is not so large in comparison with the previous cases, the dark halo model is better.


3.4 SDSS clusters
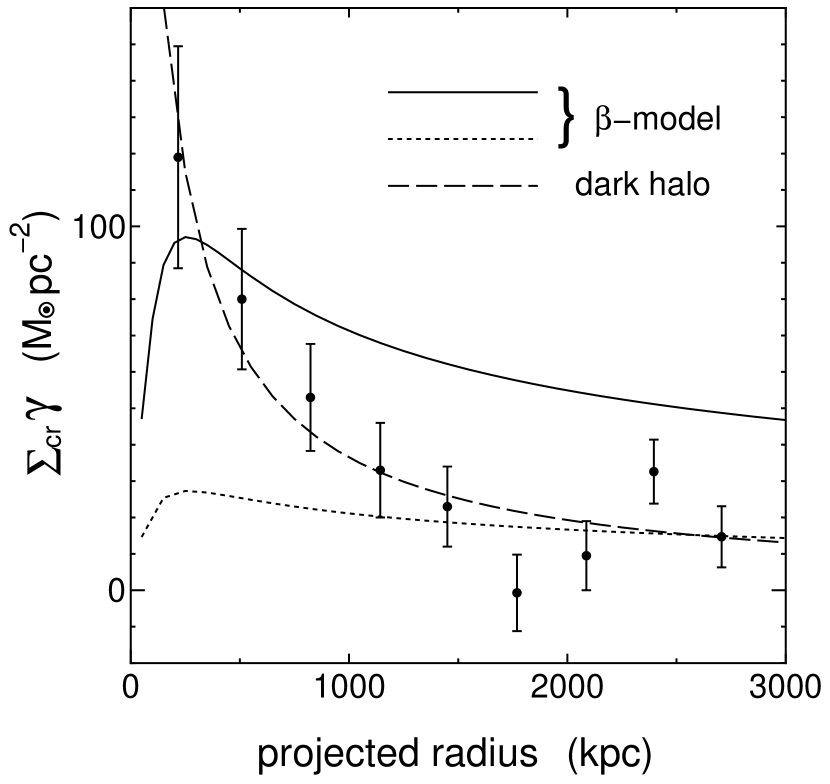
Sheldon et al. (2001) studied weak lensing of clusters in SDSS data. They provided the mean shear of clusters up to the radius of kpc as shown in Fig.5. The vertical axis is , where is the critical surface density, and the horizontal axis is the projected radius777The quantity is related to the surface density of the lens in GR : .. Here, does not depend on the source redshift. The data is well fitted by a power law with index Sheldon et al. (2001). On the solid and dotted lines, we consider only the gas component, given by the isothermal beta model:
| (7) |
with , kpc, (solid line) and (dotted line), here is the critical density at the present. As shown in the figure, the fit is poor. This is because the slope of the shear is for and it is flatter than the data. The dashed line is the dark halo model (given in Eq.(6)). The best fitted model is and kpc with /dof . The dashed line fits the data well.
4 Limit on Neutrino Mass
In previous studies, several authors assumed a massive neutrino with a mass of eV as the dark matter to explain the observational data (e.g. Sanders 2003; Skordis et al. 2006). In this section, we put a constraint on its mass from the weak lensing of clusters.
The neutrino oscillation experiments provide the mass differences between different species : . Here we consider massive neutrinos whose masses are much heavier than and assume they are degenerate: they have (almost) the same mass, independent of species. Using the maximum phase space density , the maximum density of the neutrino dark halo is given by (Tremaine & Gunn 1979; Sanders 2003; 2007) 888Sanders (2007) recently revised his calculation and gave times smaller density than Sanders (2003). We confirm his calculation. Then the minimum neutrino mass is times larger. Although Sanders (2007) is not yet published and there may be some ambiguities about the factor, we adopt his revised model.,
| (8) |
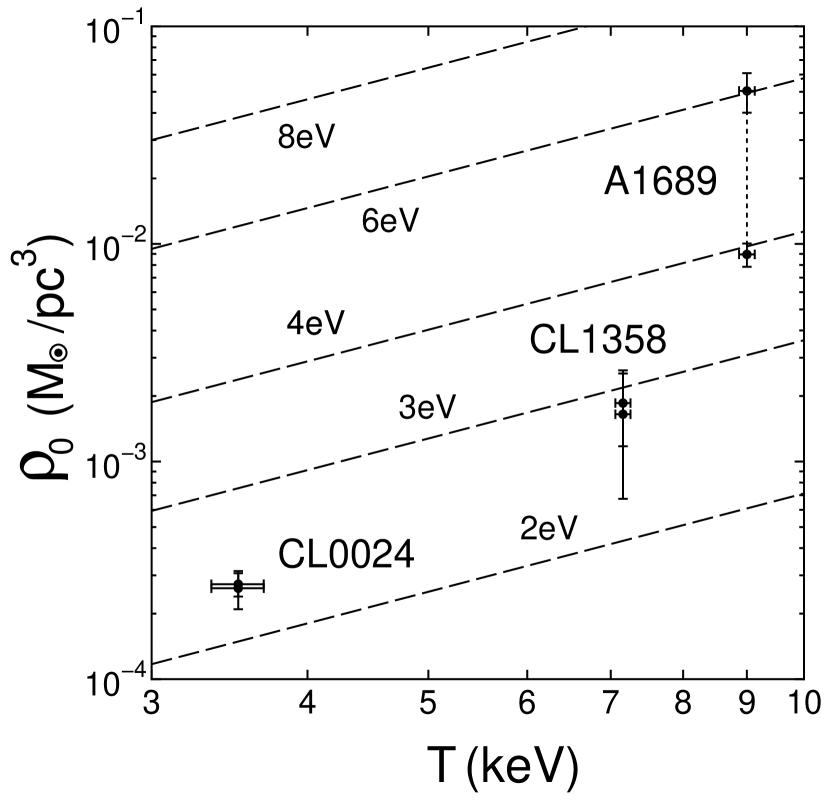
where is the X-ray temperature : keV for A1689 Andersson & Madejski (2004), keV for CL0024 Zhang et al. (2005), and keV for CL1358 Arabadjis et al. (2002).
For A1689, the core density of the neutrino halo is from Eq.(6). For CL0024 and CL1358, as we noted, the core radius in the best fitting model is smaller than the inner most data point. Hence, in order to put a conservative bound, we use the mean density inside the second innermost data point , . Since , we obtain a lower bound of from Eq.(8). The results of and are shown in Table 1. The lower row in each cluster is the case of another halo model instead of Eq.(6). We try out this model in order to study the halo model dependence. For A1689 changes by a factor , and hence it depends on the halo profile. However for other clusters changes slightly (less than a factor ), because there are no data point near the core radius and only is determined through the amplitude of the shear.
In Fig.6 we show the density vs. the temperature to put a constraint on the neutrino mass. The dashed lines correspond to neutrino mass in Eq.(8). From the figure, the minimum neutrino mass is eV for CL0024 and CL1358. The above results are consistent with the previous X-ray measurements Sanders (2003, 2007). Since the current limit is eV from tritium decay999Particle Data Group Home Page : http://pdg.lbl.gov/, these values are comparable to or larger than this limit.
The mean density inside the innermost, not second innermost, data point is much higher than . The neutrino masses are eV for CL0024 and eV for CL1358 in this case. Hence there is an ambiguity about the definition of the central density for these clusters.
The core density of A1689 is highest and the minimum neutrino mass reaches eV. To check our result, we compare the core density with the previous studies in GR. Since for from Fig.2(b), GR is valid near the core. Halkola et al. (2006) gave central mass distribution by analyzing multiple images of background galaxies. Their mass distribution is consistent with Broadhurst et al. (2005b) (see Fig.17 of Halkola et al. (2006)). From a velocity dispersion of km/s and the core radius kpc, the core density is . This is roughly consistent with our result.
Allen (1998) suggests that the lensing core mass is generally a few times larger than X-ray core mass for non-cooling flow clusters (see also Clowe & Schneider 2001 in the case for A1689). Some ideas are proposed to explain the discrepancies : clusters are not in dynamical equilibrium, non-thermal pressure such as turbulent and magnetic pressure plays an important role, elongation of the cluster or substructures along a line-of-sight (e.g. Hattori, Kneib & Makino 1999). In fact, Lokas et al. (2006) show that A1689 is surrounded by a few substructures aligned along a line-of-sight, by studying the galaxy kinematics. CL0024 has a second mass clump which is separated at from the center and has of total cluster mass Kneib et al. (2003). Jee et al. (2007) recently suggest that CL0024 would be the merging cluster in line-of-sight direction. These systematics would affect our results and change the neutrino mass limit by factor (since is not very sensitive to , from Eq.(8)).
| A1689 | |||
| CL0024 | |||
| CL1358 | |||
Note. — The best fitting parameters and . The density is the core density for A1689 and the mean density inside the second innermost data point for the others. The upper row is the case of the halo profile given in Eq.(6), while the lower row is .
5 Results by Other Interpolation Functions
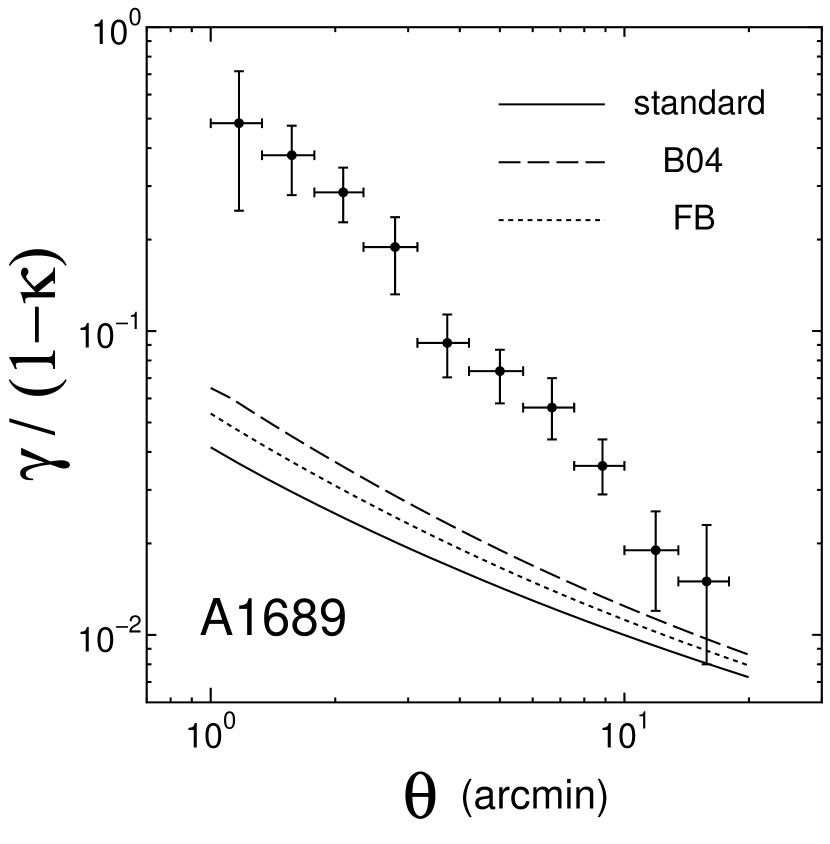
So far, we used a standard interpolation function alone. However the standard is not consistent with TVS Bekenstein (2004). In this section, we also examine other interpolation functions, Bekenstein’s toy model in TVS and simple model in Famaey & Binney (2005), in order to study the robustness of our results. Since the clusters have from Figs.2-4 (b), our conclusions may depend on the choice of .
In Fig.7, we show the MOND predication for A1689 for the three types of . The solid line is the standard model, the dashed line is the Bekenstein’s toy model (B04), and the dotted line is the Famaey & Binney’s model (FB). The standard model predicts the lowest value, because is highest at . B04 and FB show several times higher values than the standard model.
The minimum neutrino mass only changes and the choice of is not crucial.
6 Conclusion
We have studied the weak lensing of galaxy clusters in MOND. We calculate the shears and the convergences of the background galaxies for three clusters (A1689, CL0024, CL1358) and the mean profile of 42 SDSS clusters, and compare them with the observational data. It turns out that the MOND cannot explain the data irrespective of unless a dark matter halo is added. We also examine the three types of interpolation function, but the conclusion does not change. The above results are consistent with those of previous studies (e.g. Aguirre, et al. 2001; Sanders 2003). If the dark halo is composed of massive neutrinos, its minimum mass is eV for A1689 and eV for CL0024 and CL1358. However our results still depends on the dark halo model and inner data points. Even for A1689, the system with the most constraining data, the systematic is more important than random errors as shown in Fig.6. In addition, there are some systematic uncertainties such as an elongation of cluster along line-of-sight. These effects would reduce the minimum mass by a factor of . In the low acceleration region (), the external gravitational field becomes important and would affect the outer shear profile Bekenstein & Milgrom (1984); Wu et al. (2007).
In conclusion, the more careful study is necessary to put a stringent constraint, for example, a combination of the weak and strong lensing, X-ray gas and galaxy dynamics. However, it is beyond the scope of this paper and we will study as an future work. Even so, at present, we find that there is some tension between the lower bound of neutrino mass in neutrino dark halo model in MOND and the upper bound by experiments.
References
- Aguirre et al. (2001) Aguirre, A., Schaye, J. & Quataert E. 2001, ApJ, 561, 550
- Aguirre (2003) Aguirre, A. 2003, in Proc. the IAU Symposium 220 ”Dark Matter in Galaxies”, ed. by S. Ryder, D.J. Pisano, M. Walker and K. Freeman, 17
- Allen (1998) Allen, S.W. 1998, MNRAS, 296, 392
- Andersson & Madejski (2004) Andersson, K.E. & Madejski, G.M. 2004, ApJ, 607, 190
- Angus et al. (2006) Angus, G.W., Famaey, B. & Zhao, H.S. 2006, MNRAS, 371, 138
- Angus et al. (2007) Angus, G.W., Shan, H.Y., Zhao, H.S. & Famaey, B. 2007, ApJ, 654, L13
- Angus & McGaugh (2007) Angus, G.W. & McGaugh, S.S. 2007, arXiv:0704.0381, submitted to MNRAS
- Arabadjis et al. (2002) Arabadjis, J.S. Bautz, M.W. & Garmire, G.P. 2002, ApJ, 572, 66
- Bekenstein & Milgrom (1984) Bekenstein, J.D. & Milgrom, M. 1984, ApJ, 286, 7
- Bekenstein (2004) Bekenstein, J.D. 2004, Phys. Rev. D, 70, 083509
- Broadhurst et al. (2000) Broadhurst, T., Huang, X., Frye, B. & Ellis, R. 2000, ApJ, 534, L15
- (12) Broadhurst, T. et al. 2005a, ApJ, 619, L143
- (13) Broadhurst, T. et al. 2005b, ApJ, 621, 53
- Chen & Zhao (2006) Chen D.-M. & Zhao, H.S. 2006, ApJ, 650, L9
- Chiu et al. (2006) Chiu, M.-C., Ko, C.-M. & Tian, Y. 2006, ApJ, 636, 565
- Clowe & Schneider (2001) Clowe, D. & Schneider, P. 2001, A&A, 379, 384
- Clowe et al. (2006) Clowe, D. et al. 2006, ApJ, 648, L109
- Dodelson & Liguori (2006) Dodelson, S. & Liguori, M. 2006, Phys. Rev. Lett., 97, 231301
- Dressler & Gunn (1992) Dressler, A. & Gunn, J.E. 1992, ApJS, 78, 1
- Famaey & Binney (2005) Famaey, B. & Binney, J. 2005, MNRAS, 363, 603.
- Famaey et al. (2007) Famaey, B., Angus, G.W., Gentile, G. & Zhao, H.S. 2007, arXiv:0706.1279, submitted to A&A
- Feix et al. (2007) Feix, M., Fedeli, C., and Bartelmann, M. 2007, arXiv:0707.0790, submitted to A&A
- Gavazzi (2002) Gavazzi, R. 2002, New A Rev., 46, 783
- Halkola et al. (2006) Halkola, A., Seitz, S., & Pannella, M. 2006, MNRAS, 372, 1425
- Hattori et al. (1999) Hattori, M., Kneib, J.P. & Makino, N. 1999, Prog.Theor.Phys.Suppl., 133, 1
- Hoekstra et al. (1998) Hoekstra, H., Franx, M., Kuijken, K., & Squires, G. 1998, ApJ, 504, 636
- Jee et al. (2007) Jee, M.J., et al. 2007, ApJ, 661, 728
- Kneib et al. (2003) Kneib, J.P. et al. 2003, ApJ, 598, 804
- Limousin et al. (2006) Limousin et al. 2006, astro-ph/0612165
- Lokas et al. (2006) Lokas et al. 2006, MNRAS, 366, L26
- Milgrom (1983) Milgrom, M. 1983, ApJ, 270, 365
- (32) Mortlock, D.J. & Turner, E.L. 2001, MNRAS, 327, 552
- (33) Mortlock, D.J. & Turner, E.L. 2001, MNRAS, 327, 557
- Pointecouteau & Silk (2005) Pointecouteau, E. & Silk, J. 2005, MNRAS, 364, 654
- Qin et al. (1995) Qin, B., Wu, X.P. & Zou, Z.L. 1995, A&A, 296, 264
- Sanders & Mcgaugh (2002) Sanders, R.H. & McGaugh S.S. 2002, ARA&A, 40, 263
- Sanders (2003) Sanders, R.H. 2003, MNRAS, 342, 901
- Sanders (2007) Sanders, R.H. 2007, submitted to MNRAS, astro-ph/0703590
- Sheldon et al. (2001) Sheldon, E.S. et al. 2001, ApJ, 554, 881
- Slosar et al. (2005) Slosar, A., Melchiorri, A. & Silk, J.I. 2005, Phys. Rev. D, 72, 101301
- Skordis (2005) Skordis, C. 2005, submitted to Phys. Rev. D, astro-ph/0511591
- Skordis et al. (2006) Skordis, C., Mota, D.F., Ferreira, P.G., & Boehm C. 2006, Phys. Rev. Lett., 96, 011301
- Smail et al. (1996) Smail, I. et al. 2006, ApJ, 469, 508
- Tremaine & Gunn (1979) Tremaine, S. & Gunn, J.E. 1979, Phys. Rev. Lett., 42, 408
- Umetsu et al. (2007) Umetsu, K., Takada, M. & Broadhurst, T. 2007, submitted to Mod. Phys. Lett. A, astro-ph/0702096
- Zekser et al. (2006) Zekser, K.C. et al. 2006, ApJ, 640, 639
- Zhang et al. (2005) Zhang, Y.-Y. et al. 2005, A&A, 429, 85
- Zhao et al. (2006) Zhao, H.S. et al. 2006, MNRAS, 368, 171
- White & Kochanek (2001) White, M. & Kochanek, C.S. 2001, ApJ, 560, 539
- Wu et al. (2007) Wu, X. et al. 2007, arXiv:0706.3703, submitted to ApJ