22institutetext: Dipartimento di Astronomia, Università di Padova, vicolo dell’Osservatorio 3, I-35122 Padova, Italy
33institutetext: Scuola Galileiana di Studi Superiori, via VIII Febbraio 2, I-35122 Padova, Italy
The search for inner polar disks with integral field spectroscopy: the case of NGC 2855 and NGC 7049††thanks: Based on observations carried out at the European Southern Observatory (ESO 73.B-0803).
Abstract
Context. The presence of non-circular and off-plane gas motions is frequently observed in the inner regions of disk galaxies.
Aims. We have measured with integral-field spectroscopy the surface-brightness distribution and kinematics of the ionized gas in NGC 2855 and NGC 7049. These two early-type spiral galaxies were selected to possibly host a kinematically-decoupled gaseous component in orthogonal rotation with respect to the galaxy disk.
Methods. We have modeled the ionized-gas kinematics and distribution of both galaxies assuming that the gaseous component is distributed either on two orthogonally-rotating disks or in a single and strongly warped disk.
Results. In both galaxies the velocity field and distribution of the inner gas are consistent with the presence of an inner polar disk. In NGC 2855 it correponds to the innermost and strongly warped portion of the main disk. In NGC 7049 it is a central and geometrically-decoupled disk, which is nested in the main disk.
Key Words.:
galaxies: kinematics and dynamics – galaxies: spirals – galaxies: structure – galaxies: individual: NGC 2855, NGC 7049e-mail: coccato@astro.rug.nl
1 Introduction
In a recent paper we pointed that about of bright unbarred galaxies show a remarkable gas velocity gradient along the optical minor axis (Coccato et al. 2004). This phenomenon is observed all along the sequence of disk galaxies from S0’s to Sm’s. Since minor-axis velocity gradients are unexpected if the gas is moving onto circular orbits in a disk coplanar to the stellar one, we concluded that non-circular and off-plane gas motions are not rare in the inner regions of disk galaxies. Further support to this picture is given by the analysis of the velocity fields of large samples of lenticular galaxies (Sarzi et al. 2006), early (Falcón-Barroso et al. 2006) and late-type spirals (Ganda et al. 2006) observed with integral-field spectroscopy.
The presence of a velocity gradient along the minor axis is characteristic of galaxies hosting an inner polar disk (IPD hereafter). IPDs are small disks of gas and/or stars ( pc), which are located in the center of lenticular and spiral galaxies and are rotating in a plane perpendicular to that of the main disk of their host. We call them IPDs instead of inner polar rings (Sil’chenko 2006) since there is no clearcut evidence they have an anular structure. Most of these orthogonally-rotating disks have been discovered in last few years (Corsini et al. 2003; Sil’chenko & Afanasiev 2004; Shalyapina et al. 2004; Sil’chenko & Moiseev 2006; Coccato et al. 2005). The acquisition of external gas via merging or accretion on nearly polar orbits by a pre-existing galaxy, and the transfer of gas onto highly-inclined anomalous orbits of a triaxial bulge or a bar, which is tumbling about its short axis, are both viable mechanism to build a orthogonally-rotating disk. According to these different scenarios, it can be either a geometrically-decoupled structure or the inner portion of a strongly warped and larger gaseous disk, respectively. Therefore, constraining the structural properties of a sample of IPDs will give the clues to understand the processes driving their formation (see Sil’chenko 2006 for a review).
| Parameters | Channels | |||
|---|---|---|---|---|
| 1 | 2 | 3 | 4 | |
| Grism | HR_red | HR_red | HR_red | HR_orange |
| Order sorting filter | GG475 | GG475 | GG475 | GG435 |
| Spatial resolution (′′ fiber-1) | 0.67 | 0.67 | 0.67 | 0.67 |
| Reciprocal dispersion (Å pixel-1) | 0.58 | 0.58 | 0.58 | 0.62 |
| Readout noise (e-) | 4.5 | 3.2 | 3.2 | 3.7 |
| Gain (e- ADU-1) | 1.9 | 1.8 | 1.7 | 2.0 |
| Wavelength range (Å) | 6300 – 8700 | 6300 – 8700 | 6300 – 8700 | 5200 – 7600 |
| Instrumental FWHM at H () | 68 | 68 | 68 | 70 |
Over the course of the last few years, we have undertaken a program aimed at detecting IPDs in disk galaxies using long-slit spectroscopic observations (Bertola et al. 1999; Sarzi et al. 2000; Corsini et al. 2002, 2003; Coccato et al. 2004, 2005). In long-slit spectra the kinematic signature of an IPD is the presence of a central velocity gradient along the disk minor axis and a zero-velocity plateau along the disk major axis, respectively. On the contrary, the presence of a gas velocity gradient along both major and minor axis is characteristic of gas moving onto elliptical orbits in the disk plane of a triaxial bulge (de Zeeuw & Franx 1989; Corsini et al. 2003). Our goal was to identify galaxies, which are good candidates to host a IPD, to be followed up with integral-field spectroscopy at high spatial resolution in order to determine the size and orientation of such a kinematically-decoupled component.
In this paper we present the analysis of the bidimensional kinematics and distribution of the ionized-gas component of the two most promising objects we found in our investigation. They are the nearby early-type spirals NGC 2855 and NGC 7049. For both galaxies the presence of a major-axis velocity plateau together with a minor-axis velocity gradient is suggestive of an IPD as discussed by Corsini et al. (2002, 2003). The reader is refereed to them for a summary of the main properties of the two galaxies. The paper is organized as follows. The integral-field spectroscopic observations and data reduction are described in Sect. 2. We present and model the ionized-gas kinematics and distribution in Sect. 3 and 4, respectively. Our conclusions are discussed in Sect. 5.
2 Observations and data reduction
The integral-field spectroscopic observations of NGC 2855 and NGC 7049 were carried out with the Very Large Telescope (VLT) at the European Southern Observatory (ESO) in Paranal (Chile) on February 26–27, 2004 and May 13–14, 2004. The Unit Telescope 3 (Melipal) mounted the Visible Multi Object Spectrograph (VIMOS) in the Integral Field Unit (IFU) configuration. The field of view of the four VIMOS channels was and it was projected onto a microlenses array. This was coupled to optical fibers which were rearranged on a linear set of microlenses to produce an entrance pseudoslit to the spectrograph. The pseudoslit was wide and generated a total of 1600 spectra covering the field of view with a spatial resolution of per fiber. Each channel was equipped with either the HR_red or HR_orange high resolution grism and a thinned and back illuminated EEV44 CCD with pixels of m2. The details of the instrumental setup are given in Table 1.
For each galaxy we obtained -min exposures. They were taken in service mode by executing two different observing blocks of two exposures each, as listed in Table 2. Different quarz and arc lamp spectra were taken after every object exposure to ensure accurate flatfield correction and wavelength calibration, respectively. During observations seeing FWHM ranged between and as measured by the ESO Differential Image Meteo Monitor.
| Galaxy | Date | Observing block | Exposure time |
|---|---|---|---|
| NGC 2855 | 27 Feb 2004 | 154289 | min |
| NGC 2855 | 27 Feb 2004 | 154292 | min |
| NGC 7049 | 13 May 2004 | 154293 | min |
| NGC 7049 | 14 May 2004 | 154296 | min |
Notes – During the execution of the observing block 154293 (13 May 2004) the data of channel 4 were lost because the Grism Exchange Unit of channel 4 was out of order.
For each VIMOS channel all the spectra were traced, identified, bias subracted, flatfield corrected, corrected for relative fiber transmission, and wavelength calibrated using the routines of the ESO Recipe Execution pipeline111ESOREX and MIDAS are developed and maintained by the European Southern Observatory. Cosmic rays and bad pixels were identified and cleaned using standard MIDAS routines. We checked that the wavelength rebinning was done properly by measuring the difference between the measured and predicted wavelength for the brightest night-sky emission lines in the observed spectral ranges (Osterbrock et al. 1996). The resulting accuracy in the wavelength calibration is better than 5 . The intensity of the night-sky emission lines was used to correct for the different relative transmission of the VIMOS channels. The contribution of the night-sky emission lines was determined from a number of spectra by fitting a Gaussian to each line and a straight line to the adjacent continuum. We selected spectra where the night-sky emission lines did not overlap with the [N II] and H emission lines of the galaxy. Then night-sky emission lines were subtracted from all the available spectra. It was not possible to subtract the contribution of the night-sky continuum alone since both galaxies covered the entire field of view of the integral field unit. The processed spectra were organized in a datacube using the tabulated correspondence between each fiber and its position in the field of view. From the two exposures of each observing block we built a single datacube. In fact, the two spectra taken by the same fiber were coadded after checking that there was no pointing offset between the two exposures. This was done by comparing the position of the intensity peaks of the two reconstructed images obtained by collapsing the datacubes along the wavelength direction. Finally, for each galaxy we coadded the two available datacubes by using the intensity peaks of the flux maps as a reference for the alignment. In this way we produced a single datacube to be analyzed in order to derive the surface brightness and kinematic maps.
3 Kinematics and distribution of the ionized gas
3.1 Analysis
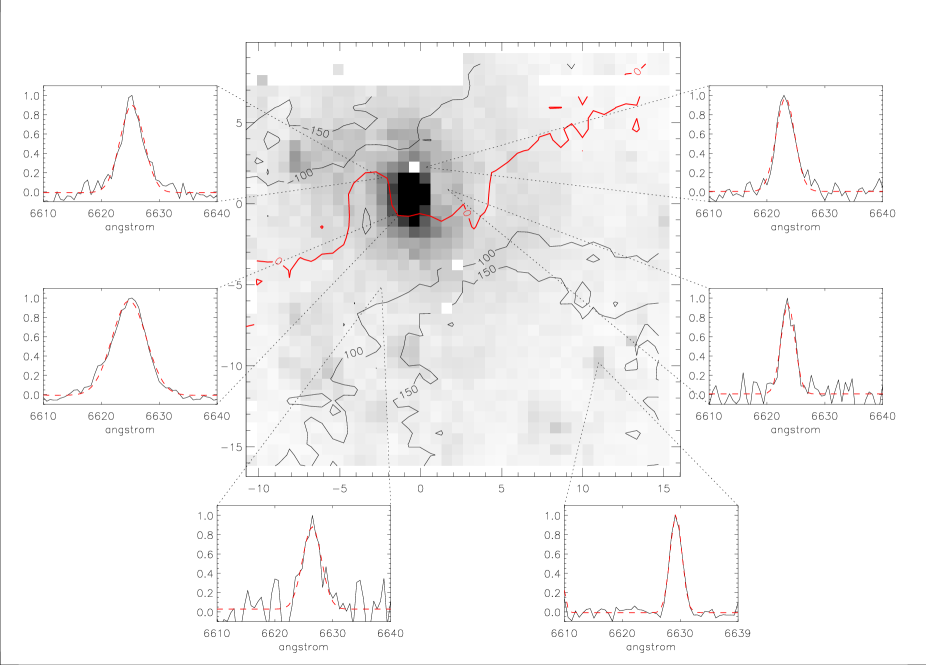
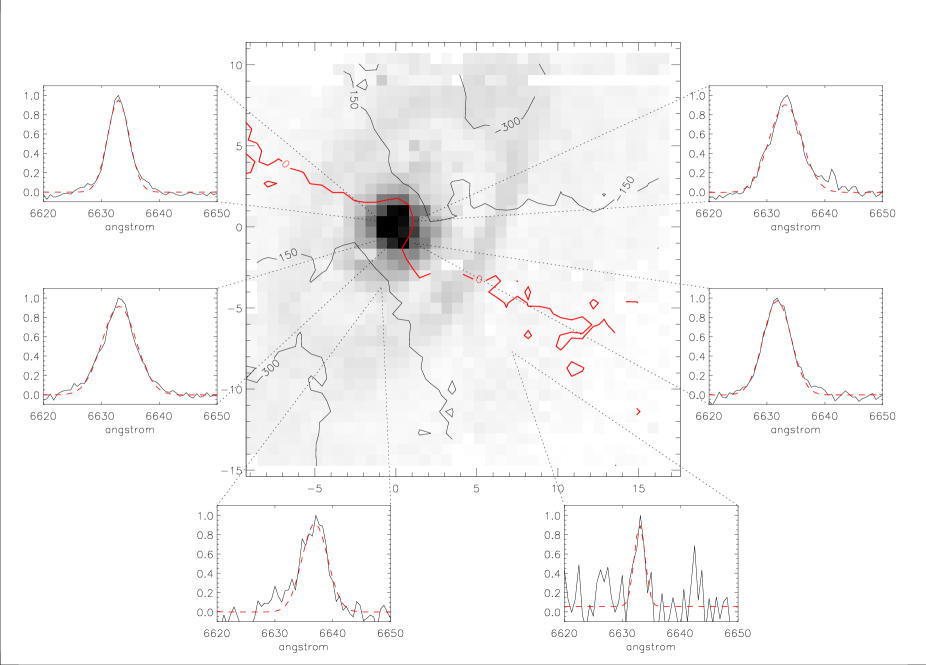
In the coadded spectrum of the galaxy datacube we measured the position, full width at half maximum (FWHM), and uncalibrated flux of the H and [N II] emission lines by fitting a Gaussian to each line and a straight line to the adjacent continuum. This includes the contributions of both galaxy and night sky. No double-peaked emission line was observed. We neglected the [N II] line because it was not clearly detected in all the spectra, and we averaged the spectra of adjacent fibers in the outer regions where the intensity of the H and [N II] lines was low. We performed a binning in order to reach a minimum signal-to-noise ratio . To assess the data quality we show some examples of the profile of the [N II] emission line and its Gaussian fit in different regions of the two galaxies. They are plotted in Figs. 3 and 4 for NGC 2855 and NGC 7049, respectively. The central wavelength of the fitting Gaussian was converted into line-of-sight velocity in the optical convention. The standard heliocentric correction was applied. The Gaussian FWHM was corrected for the instrumental FWHM and then converted into the intrisic line-of-sight velocity dispersion. The flux of the fitting Gaussian was converted into surface brightness according the fiber area. No flux calibration was performed.


To study the distribution of the ionized gas we fitted elliptical isophotes to the [N II] surface brightness map by means of the IRAF222IRAF is distributed by National Optical Astronomy Observatories, which is operated by Association of Universities for Research in Astronomy, Inc. under cooperative agreement with the National Science Foundation. taks ELLIPSE. We first fitted ellipses allowing the center to vary to test the regularity of the gas distribution. We found no evidence of a varying center with the fits for NGC 2885. The ellipse fits were then repeated with the ellipse center fixed. This was not the case of NGC 7049. The position of center was constant within the errors only for , while it changed by at larger radii. The radial profiles of the surface brightness, ellipticity and position angle derived from the [N II] surface-brightness map are shown in Figs. 5 and 6 for NGC 2855 and NGC 7049, respectively.


3.2 Results
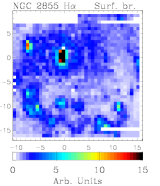
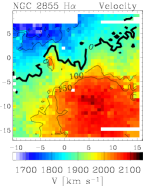
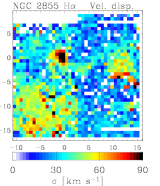
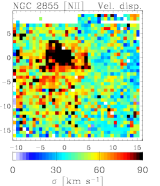
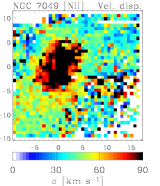
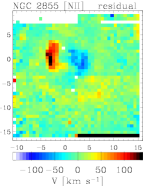
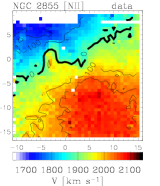
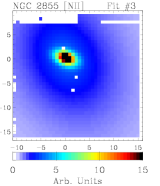
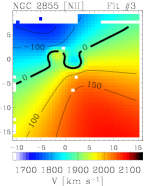
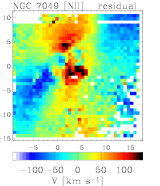
In NGC 2855 the ionized gas is concentrated in the nucleus and its distribution at larger radii follows the spiral pattern of the galaxy (Fig. 1). The abrupt change of ellipticity (from 0.05 to 0.45) and position angle (from to ) of the ellipses fitting the [N II] surface-brightness map (Fig. 5) are the photometric signatures of such a distribution of the gaseous component. The gas velocity field is complex. It is characterized by a S-shaped zero velocity line in the nuclear region. In the outer region it shows a regular rotation around the galaxy minor axis. The velocity dispersion increases from the outer parts towards the center. It peaks to 120 in H and to in [N II] and is systematically smaller for H with respect to [N II] (Fig. 1).
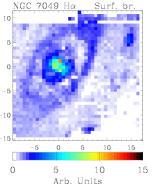
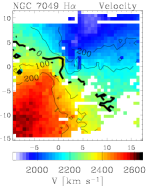
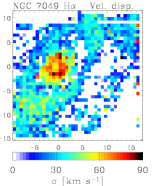
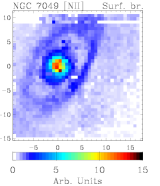
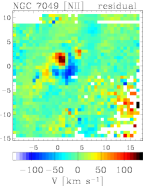
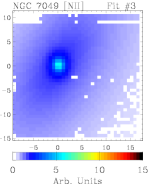
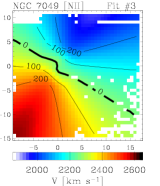
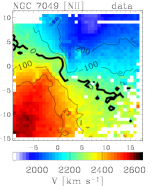
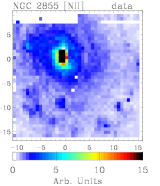
In NGC 7049 the gas is mostly concentrated in the nucleus and in a ring-like structure (Fig. 2). This corresponds to the prominent dust lane, which is visible in the optical images of the galaxy (Sandage & Bedke 1994, Panel 74). The photometric profiles derived from the [N II] surface-brightness map (Fig. 6) allows to constrain the different shape and orientation of the nuclear (, PA) and ring (, PA) regions. The gas velocity field of NGC 7049 is similar to that of NGC 2855, displaying a S-shaped distortion in the nucleus and regular rotation around the galaxy minor axis at large radii. The velocity dispersion is systematically lower in H than in [N II]. In the nuclear region shows a central dip surrounded by a double peak where it reaches 120 in H and 170 in [N II]. Outwards it decreases smoothly with radius (Fig. 2).
In both galaxies the line-of-sight velocities measured from H and [N II] are consistent within the measurement errors. For this reason we modeled only the velocity field and surface-brightness distribution derived from the [N II] line. Typical errors on the line-of-sight velocity and velocity dispersions were and , including the uncertainties due to wavelength calibration.
4 Analysis of the velocity field of the ionized gas
The field of view of VIMOS/IFU allows us to map the velocity field of the kinematically-decoupled gaseous component, as well as that of the gas residing in the main disk of the galaxy. As a first step, we fit the whole velocity field by assuming that the gas is moving onto circular and coplanar orbits (Sec. 4.1). To this aim we masked the central region, where the S-shaped distorsion of the isovelocity countours is observed. We adopted the results of the circular velocity model to constrain the orientation and inclination of the main disk of the galaxy. Then we modeled the complex gas kinematics and surface-brightness distribution of the inner regions. We assumed that the gaseous component was distributed either on two distinct and orthogonally-rotating disks (Sec. 4.2) or onto a single and strongly warped disk (Sec. 4.3).
In our analysis we fitted iteratively a model to the observed velocity field and surface-brightness distribution of the [N II] line using a non-linear least-squares minimization method. It was based on the robust Levenberg-Marquardt method implemented by Morè et al. (1980). The actual computation was done using the MPFIT algorithm implemented by C. B. Markwardt under the IDL environment333The updated version of this code is available on http://cow.physics.wisc.edu/ craigm/idl/idl.html. During each iteration the model was calculated on a subsampled pixel grid with the bin size of (i.e., a subsampling factor of relative to the VIMOS pixel scale). This resulted the best compromise between good sampling and reasonable computational time. The model was rebinned on a spatial scale of and the seeing effects were taken into account by convolving the model with a Gaussian kernel with . Finally, the model was compared to the observed velocity field and surface-brightness distribution.
4.1 Single rotating disk
4.1.1 Model calculation
The model of the gas velocity field is generated assuming that the ionized-gas component is moving onto circular orbits in an infinitesimally thin disk with a negligible velocity dispersion. Hereafter this will be considered as the main disk of the galaxy.
Let be Cartesian coordinates with the origin in the center of the gaseous disk, the axis aligned along the line of nodes, and the disk plane confined to the plane. We can consider the gas motion in this plane by introducing the polar coordinates with origin in the center of the gaseous disk. It is (or if the coordinates of the kinematic and geometric center of the gaseous disk are different) and with counted counter-clockwise from axis. We assume that the gas circular velocity at a given radius is
| (1) |
where and are the maximal velocity and a scale radius, respectively. This empirical function has been proved to reproduce fairly well the shape of optical rotation curves with the smallest number of free parameters (Courteau 1997).
We now project the velocity field of the gaseous disk on the plane of the sky. Let be Cartesian coordinates with the origin in the center of the gaseous disk, the axis pointing eastwards, the axis pointing northwards, and the axis along the line of sight directed toward the observer. The sky plane is confined to the plane. In the reference frame of the sky , the gaseous disk is inclined by the zenithal and azimuthal angle and , respectively. These angles correspond to the inclination of the disk (with corresponding to the face-on case) and position angle of its line of nodes (with counted counter-clockwise from the axis and corresponding to the case with the line of nodes pointing northward). The transformation of the coordinates of the main disk from its reference frame to the reference frame of the sky is given by
| (2) |
where
| (3) |
which leads to the usual equations in the sky plane :
The ionized-gas velocity measured along the line of sight at a given sky point is
| (4) |
where the circular velocity is given in Eq. 1, and is the systemic velocity of the galaxy.
The parameters of our model are the maximal velocity , scale radius , inclination and position angle of the gaseous disk, and the systemic velocity of the galaxy. The best-fitting model was obtained by masking the region of the observed velocity field characterized by the S-shaped distorsion of the isovelocity countours. The area of the masked region was pixels and pixels in NGC 2855 and NGC 7049, respectively.


4.1.2 Results
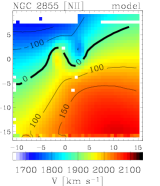
The velocity fields of the best-fitting disk models are compared to observed ones in Fig. 7. Best-fitting parameters are given in Table 3.
| Parameter | NGC 2855 | NGC 7049 |
|---|---|---|
| [pixel] | 0.40.5 | 0.20.3 |
| [pixel] | 0.40.6 | 0.60.3 |
| [] | 18936 | 22305 |
| [∘] | 116.60.8 | 58.10.7 |
| [∘] | 424 | 602 |
| [] | 34422 | 459 13 |
| [′′] | 3.90.7 | 3.50.4 |
For the gaseous disk of NGC 2855, the position angle and inclination measured at large radii with the isophotal analysis (Sec. 3.1) are not consistent with that derived from the kinematic model (Tab. 3). We explain such a discrepancy as due to the presence of the patchy spiral arm pattern, which characterizes the surface brightness distribution of the [N II] line at . This makes the photometric parameters not reliable to describe the geometry of the disk. The coordinates of the disk centers derived in the photometric and kinematic analysis (Tab. 3) coincide within a pixel.
The position angle, inclination and center derived from the photometric and kinematic analysis of the gaseous disk of NGC 7049 are consistent within the errors.
In the rest of the paper we adopt as position angle and inclination of the main gaseous disks of NGC 2855 and NGC 7049 the values we derived from the kinematic model.
4.2 Orthogonally-rotating disks
4.2.1 Model calculation
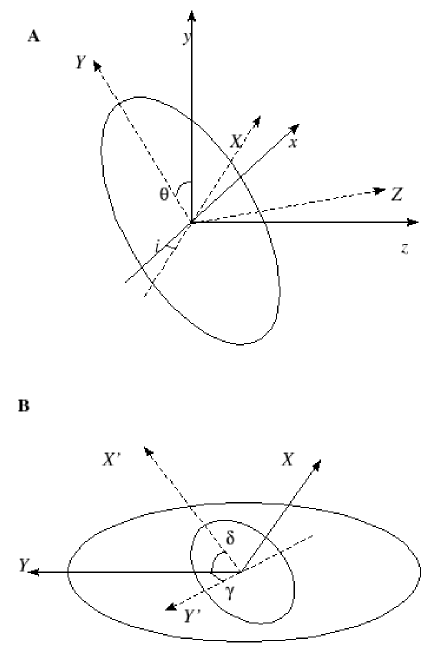
The model of the gas velocity field is generated assuming that there are two different ionized-gas components which are moving onto circular orbits in two orthogonally-rotating disks. They are the main galactic disk studied in Sect. 4.1 and an inner orthogonal disk. Both disks have the same center, are infinitesimally thin, and have a negligible velocity dispersion.
Let be Cartesian coordinates with the origin in the center of the orthogonal disk, the axis aligned along the line of nodes (defined as the intersection between the plane of the orthogonal disk and that of the main disk), and the plane of the orthogonal disk confined to the plane. In the reference frame of the main disk , the orthogonal disk is inclined by the zenithal and azimuthal angle and , respectively. These angles are the inclination of the inner disk (with corresponding to the case of an orthogonal disk) and position angle of its line of nodes (with counted counter-clockwise from the axis and corresponding to the case with the line of nodes of the orthogonal disk pointing in the same direction as the line of nodes of the main disk). A sketch of the orthogonal disk in the reference frames and is shown in Figure 8.
We assumed that the circular velocity of the gaseous component in the main disk and in the orthogonal disk are given by Eq. 1 and
| (5) |
respectively. and are the maximal velocity and scale radius of the orthogonal disk. It is and with counted counter-clockwise from axis.
The flux radial profile of the main gaseous disk was assumed to be exponential
| (6) |
For the flux radial profile of the orthogonal disk we assumed a truncated exponential function
| (7) |
where corresponds to the radial extension of the orthogonal gaseous component.
We now project the velocity field of the two gaseous disks on the plane of the sky. The transformation of the coordinates of the inner polar disk from its reference frame to the reference frame of the main disk is given by
| (8) |
where
| (9) |
The transformation of the coordinates of the main disk from its reference frame to the reference frame of the sky is given by
| (10) |
where
| (11) |
The transformation of the coordinates of the orthogonal disk from its reference frame to the reference frame of the sky is given by
| (12) |
where .
The inclination of the orthogonal disk with respect to the sky plane is given by the direction cosine between the axis of the line of sight and the axis of the orthogonal disk
| (13) |
The line of nodes of the orthogonal disk, defined as the intersection between the disk plane and the sky plane, is
| (14) |
where denotes the inverse of . In the sky plane it is
| (15) |
and therefore the position angle of the apparent major axis of the orthogonal disk with respect to the axis is given by . This is
| (16) |
The ionized-gas velocity measured along the line of sight at a given sky point is
| (17) |
where
| (18) | |||||
| (19) |
are the line-of-sight velocity and surface brightness of the main disk,
| (20) | |||||
| (21) |
are the line-of-sight velocity and surface brightness of the orthogonal disk, and is the observed surface brightness.
For the main disk we adopted the inclination and position angle derived in Sect. 4.1 and we assumed the inner disk to be orthogonal with respect to the main one within . Therefore the parameters of our model are , , , , and for the main disk, , , , , , , (with ) and for the orthogonal disk, and the systemic velocity of the galaxy.
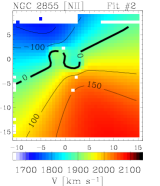
We started fitting a model only to the observed [N II] surface-brighteness distribution (Fit #1 hereafter). Then we fitted a model only to the observed velocity field adopting for the main disk the maximal velocity and scale radius derived in Sect. 4.1 and for the orthogonal disk the inclination and position angle derived in Fit #1 (Fit #2 hereafter). Finally, we fitted simultaneously both the velocity field and surface-brightness distribution (Fit #3 hereafter).
4.2.2 Results
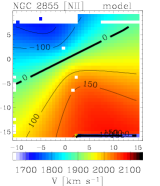
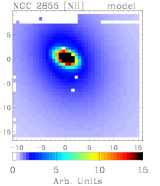
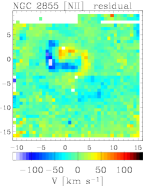
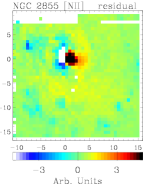
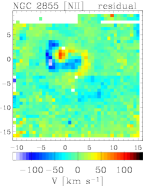
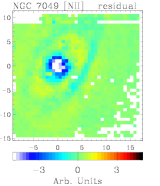
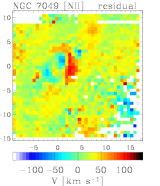
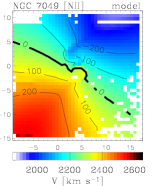
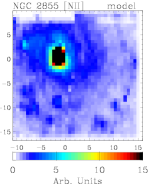
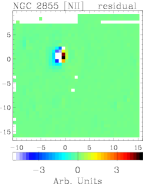
The surface-brightness distribution of the best-fitting models built in Fit #1 are shown in Fig. 9. The radial profiles of the surface brightness, ellipticity, and position angle derived from the model are compared to those from the isophotal analysis in Fig. 5 and Fig. 6 for NGC 2855 and NGC 7049, respectively. The velocity field of the best-fitting models built in Fit #2 are shown in Fig. 11. The surface-brightness distribution and velocity field of the best-fitting models built in Fit #3 are compared to observations in Fig. 12 and 13.
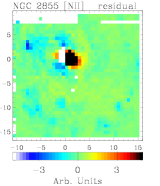
The surface-brightness distribution and velocity field of NGC 2885 can not be interpreted as due to presence of two different orthogonally-rotating disks of gas. The largest deviations in the residual maps are observed in the nuclear region.
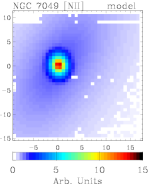
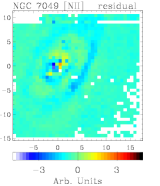
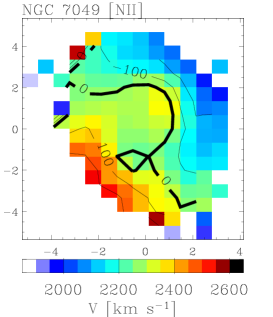
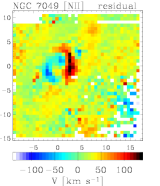
For NGC 7079 the surface-brightness distribution of the model built in Fit #1 is consistent with observations suggesting the presence of an inner gaseous component which is orthogonal with respect to the main gaseous disk of the galaxy. However, as in the case of NGC 2855, the observations are not reproduced by the models built in Fit #2 and #3. We conclude that the circular velocity curve of the orthogonal disk differs from Eq. 5. We derive the velocity field of the orthogonal disk as
| (22) |
and show it in Fig. 10. We tested different parametric prescriptions (Brandt 1960; Freeman 1970; Bertola et al. 1991; Persic et al. 1996) to fit the velocity field assuming the ionized gas is on circular orbits on a plane. But none of them gave better results than that obtained adopting Eq. 5. This suggests that probably the gas kinematics plotted in Fig. 10 is not characterized by circular motions. The limited radial extension of the region does not allow us to adopt more complicated functions as well as a larger number of free parameters to take into account for non-circular motions.


| Parameter | |
|---|---|
| 0.010.01 | |
| 1.60.2 | |
| [′′] | 152 |
| 0.010.01 | |
| 221 | |
| [′′] | 1.130.08 |
| [deg] | 234 |
| [deg] | 911 |
| [′′] | 3.60.1 |
4.3 Warped disk
4.3.1 Model calculation
The model of the gas velocity field is generated approximating the warped gas distribution with a series of concentric and circular wires.
Let be Cartesian coordinates with the origin in the center of the th wire, the axis aligned along the line of nodes defined as the intersection between the plane of the wire and that of the main disk . In the reference frame of the sky , the wire is inclined by the zenithal and azimuthal angle and , respectively.
The transformation of the coordinates of the th wire from its reference frame to the reference frame of the sky is given by Eq. 12, where and are replaced by and , respectively. Similarly, the inclination and the position angle of the apparent major axis of the th wire are given by
| (23) |
and
| (24) |
We assumed that the circular velocity of the gaseous component in the warped disk and is given by
| (25) |
where and are the maximal velocity and scale radius of the warped disk. It is and with counted counter-clockwise from axis.
The ionized-gas velocity and flux measured along the line of sight at a given sky point where wires are observed are given respectively by
| (26) |
and
| (27) |
where
| (28) |
is the line-of-sight velocity and is the line-of-sight flux of the th wire. Eq. 27 implies that all the wires observed at a given position on the sky give the same contribution to the observed surface brightness. This is supported by the fact that all the wires observed at a given position are supposed to have similar radii, warping and twisting. Moreover, this choice allowed to better reproduce the inhomogeneous distribution of surface brightness due to the spiral arms of NGC 2855 and ring-like structure of NGC 7049. The attempt to model the surface-brightness distribution adopting an exponential radial profile was not successful.
We evaluated the warping and twisting of the gaseous component from the radial profiles of ellipticity and position angle obtained from the isophotal analysis of the surface-brightness map of the [N II] line in Sect. 3.1. We found that the following empirical functions
| (29) |
and
| (30) |
reproduced fairly well the radial profiles of and we derived from Eq. 23 and Eq. 24 by adopting for and the values of the main disk fitted in Sect. 4.1. This constraints the warped structure to be confined in the inner region of the galaxy.
Therefore the parameters of our model are and for the circular velocity, , , and for warping, and for twisting, and for systemic velocity. Forty wires were used to build the warped structure and cover the whole velocity field with at least one wire for each pixel bin.
4.3.2 Results
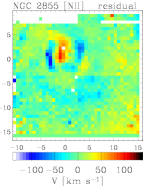
The velocity fields of the best-fitting models and their residuals are are shown in Fig. 14. Best-fitting parameters are given in Table 5.
The warped model is able to reproduce the S-shaped zero velocity line we observed in the nuclear region of NGC 2855 with velocity residuals lower than a few tens of . At large radii the position angle and inclination of the warped disk are consistent with those of the main disk of the galaxy. At small radii, the warped disk is almost orthogonal to the main disk (Fig. 15).
The velocity field of NGC 7049 can not be interpreted as due to presence of a single gaseous component distributed in a warped disk. In fact, the deviations of the residual map are larger than those we found for the models with both a single disk and two orthogonally-rotating disks.

| Parameter | |
|---|---|
| [] | 16 |
| [′′] | 4.30.6 |
| [′′] | 3.40.1 |
| [′′] | 0.820.03 |
| [deg] | 79.02 |
| [deg] | 85.70.7 |
| [deg/′′] | 10.110.07 |
| [] | 18853 |
5 Conclusions
We have measured with integral-field spectroscopy the surface-brightness distribution and kinematics of the ionized gas in NGC 2855 and NGC 7049. These two early-type spiral galaxies were selected to possibly host an IPD on the basis of the analysis of their long-slit spectra (Corsini et al. 2002, 2003).
In NGC 2855 the ionized-gas distribution peaks in the nucleus and follows the patchy spiral pattern of the galaxy. In NGC 7049 the gas is mostly concentrated in the nucleus and in a ring-like structure. The ionized-gas velocity field of both galaxies is characterized by a S-shaped line of zero velocity. It is aligned with the disk minor axis in the inner regions () and with the disk major axis at larger radii. This remarkable misalignement between the kinematical and photometrical major axes gives rise to the central velocity gradient and zero-velocity plateau observed along the disk minor and major axis, respectively. These kinematical features can not be explained as due to non-circular gas motions in the principal plane of the disk caused by the triaxial potential of the bulge or a bar (de Zeeuw & Franx 1989; Corsini et al. 2003).
As a first step we modeled the velocity field, except for the inner region where the S-shaped distorsion of the isovelocity countours is observed. We assumed that the gas is moving onto circular orbits in an infinitesimally thin disk with a negligible velocity dispersion. This allowed us to constrain the orientation and inclination of the main disk of the galaxy. Then we modeled the ionized-gas kinematics and distribution of both the inner and outer regions. We assumed that the gaseous component is distributed either on two orthogonally-rotating disks or in a single and strongly warped disk. In both galaxies the velocity field and distribution of the inner gas are consistent with the presence of an IPD, which is in orthogonal rotation with respect to the outer gas. In NGC 2855 the IPD correponds to the innermost and strongly warped portion of the main disk. In NGC 7049 it is a central and geometrically-decoupled disk, which is nested in the main disk.
We exclude that warped gaseous disk of NGC 2855 is due moving onto anomalous orbits in the triaxial bulge or in bar that is tumbling around the minor axis. In fact, we do not observe any bar structure neither in optical (Corsini et al. 2002) nor in near-infrared images (Peletier et al. 1999; Möllenhoff & Heidt 2001) of the galaxy. Moreover, there is no evidence of gas in retrograde motion relative to the stars at large radii from the galaxy center, where the gas orbits are expected to be highly inclined with respect to the figure rotation (van Albada et al. 1982; Friedli & Benz 1993). On the other hand, the galaxy is acquiring external material in a direction close to the disk minor axis (Malin & Hadley 1997). We suggest that the central portion of the warped disk is composed by accreted gas, which is settling in the plane perpendicular to the long axis of the bulge. It is in orthogonal rotation with respect to the outer gaseous component, which lies on the plane perpendicular to the long axis of the bulge. This is the one containing the main disk of the galaxy. In NGC 7049 the two orthogonally-decoupled gaseous components are already settled onto the principal planes of the triaxial bulge.
To date the presence of an inner polar disk has been confirmed by means of integral-field spectroscopy in more than 20 early-type disk galaxies (Sil’chenko 2006 and this paper). In spite of the growing statistics, the question about their formation is still open. Different qualitative arguments support either an external or internal origin. They are the acquisition of external gas via accretion on nearly polar orbits by the triaxial bulge of a pre-existing galaxy, and the transfer of gas onto highly-inclined anomalous orbits of a triaxial tumbling bulge or bar, respectively. The comparison between the observed kinematics and distribution of gas in bulges and bars hosting an inner polar disk with gas dynamical models including external acquisition and internal evolution in a variety of triaxial potentials are now required to address this issue.
Acknowledgements.
We kindly acknowledge Michele Cappellari, Katia Ganda, Marc Sarzi, and Reynier Peletier for useful comments to paper. We thank the anonymous referee for suggestions that improved the paper. LC thanks Sandro D’Odorico and Carlo Izzo for their hints during the early stages of data reduction. EMC acknowledges the Kapteyn Astronomical Institute for the hospitality while this paper was in progress. This work was made possible through grant PRIN 2005/32 from Istituto Nazionale di Astrofisica (INAF).References
- (1) Bertola, F., Bettoni, D., Danziger, J. et al. 1991, ApJ, 373, 369
- (2) Bertola, F., Corsini, E. M., Vega Beltrán, J. C. et al. 1999, ApJ, 519, 127
- (3) Brandt, J. C. 1960, ApJ, 131, 293
- (4) Coccato, L., Corsini, E. M., Pizzella, A., et al. 2004, A&A, 416, 507
- (5) Coccato, L., Corsini, E. M., Pizzella, A., & Bertola. F. 2005, A&A 2005, A&A, 440, 107
- (6) Corsini, E.M., Pizzella, A., & Bertola, F. 2002, A&A, 382, 488
- (7) Corsini, E. M., Pizzella, A., Coccato, L., & Bertola, F. 2003, A&A, 408, 873
- (8) Courteau, S. 1997, AJ, 114, 2402
- (9) de Zeeuw, T., & Franx, M. 1989, ApJ, 343, 617
- (10) Falcón-Barroso, J., Bacon, R., Bureau, M., et al. 2006, MNRAS, 369, 529
- (11) Freeman, K. C. 1970, ApJ, 160, 811
- (12) Friedli, D., & Benz, W. 1993, A&A, 268, 65
- (13) Ganda, K., Falcón-Barroso, J., Peletier, R. F., et al. 2006, MNRAS, 367, 46
- (14) Malin, D. & Hadley, B. 1997, PASA, 14, 52
- (15) Merritt, D. & de Zeeuw, T. 1983, ApJ 267, L19
- (16) Möllenhoff, C., & Heidt, J. 2001, A&A, 368, 16
- (17) Osterbrock, D. E., Fulbright, J. P., Martel, A. R., et al. 1996, PASP, 108, 227
- (18) Peletier, R. F., Balcells, M., Davies, R. L., et al. 1999, MNRAS, 310, 70
- (19) Persic, M., Salucci, P., & Stel, F. 1996, MNRAS, 281, 27
- (20) Sandage, A. & Bedke, J. 1994, The Carnegie Atlas of Galaxies (Washington: Carnegie Institution of Washington)
- (21) Sarzi, M., Corsini, E. M., Pizzella, A., et al. 2000, A&A, 360, 439
- (22) Sarzi, M., Falcón-Barroso, J., Davies, R. L., et al. 2006, MNRAS, 366, 1151
- (23) Shalyapina, L. V., Moiseev, A. V., Yakovleva, V. A., Hagen-Thorn, V. A. & Barsunova, O. Yu. 2004, AstL, 30, 583
- (24) Sil’chenko O., 2006, In: Progress in Study of Astrophysical Disks, Ed, A. M. Fridman, M. Ya. Marov & I. G. Kovalenko, ASSL, Vol. 337, (Dordrecth: Springer) p. 275
- (25) Sil’chenko, O. K.& Afanasiev, V. L. 2004, AJ, 127, 2641
- (26) Sil’chenko, O. K.& Moiseev, A. V. 2006, AJ, astro-ph/0512431
- (27) van Albada, T. S., Kotanyi, C. G.& Schwarzschild, M. 1982, MNRAS, 198, 303