Discovery of Rapid Hard X-ray Variability and New Jet Activity in the Symbiotic Binary R Aqr
Abstract
Two observations of the R Aqr symbiotic binary system taken 3.3 years apart show dramatic changes in the X-ray morphology and spectral characteristics in the inner 500 AU of this system. The morphology of the soft X-ray emission has evolved from a nearly circular region centered on the binary system to an hourglass shape that indicates the formation of a new southwest jet. Synchrotron radiation from the new jet in contemporaneous VLA radio spectra implies the physical conditions in the early stages of jet development are different from those in the more extended outer thermal jets known to exist for decades in this system. The central binary source has two X-ray spectral components in each of the two epochs, a soft component and a highly absorbed hard component characterized by T 108 K if fit with a thermal plasma model. The spectrum hardened considerably between 2000.7 and 2004.0, primarily due to increased flux above 5 keV, suggesting a change in the accretion activity of the white dwarf on a timescale of a few years or less. Point-source Fe K emission is detected at the position of the central binary system in both observations. While the earlier observation shows evidence of only a single emission peak near Fe K at 6.4 keV, the later observation shows a more complex emission structure between 6 and 7 keV. Finally, we have discovered a modulation in the hard X-ray flux with a period of 1734 s at a 95% confidence level in the 2004 observation only. The modulation potentially arises from standing shocks in an accretion column and we have explored the possibility that the white dwarf in R Aqr is analogous to the magnetic white dwarfs in Intermediate Polars.
1 Introduction
R Aqr is a symbiotic system composed of a Mira variable (M7III) and a white dwarf (WD). The Mira variable has a well-established pulsation period of 387 days (Mattei & Allen, 1979). The orbital period has been more difficult to determine, with periods of 44 yr (Willson et al., 1981) and 20 yr (Kafatos et al., 1989) often cited, although the period determination is quite uncertain (Wallerstein, 1986). The existence of a hot companion to the red giant was suggested in optical data (Merrill, 1935, 1950), but confirmation required the availability of the ultraviolet (UV) data from the International Ultraviolet Explorer () (Michalitsianos et al., 1980; Kafatos et al., 1986). Polarimetry of the central source (Deshpande et al., 1987) also confirmed the binary nature of R Aqr. The binary system is associated with a compact H II region that is probably a dusty nebula produced by the Mira winds and ionized by the hot companion star UV radiation. R Aqr is a D-type symbiotic system, defined as having comparatively red infrared (IR) colors indicative of associated dust, as opposed to an S-type symbiotic system with IR colors consistent with an isolated field red giant. The temperature of the WD in R Aqr is estimated at T=50,000–60,000∘ K, with a comparatively small radius of 3 R☉ (Meier & Kafatos, 1995). The distance is 200 pc (van Leeuwen et al., 1997).
R Aqr is remarkable because of its jet-like structures that extend more than 1400 AU from the central source. A jet in the R Aqr system was first discovered in 1977 in optical wavelengths, appearing as a series of bright emission knots about 6″ NE of the central object (Wallerstein & Greenstein, 1980). A radio counterpart to the jet was found by Sopka et al. (1982). Hollis et al. (1991) derived a kinematic age of about 90 yr for the NE jet. A symmetrical jet in the SW direction about 10″ from the central object was detected by Kafatos et al. (1989); this jet is also suggested to be about 90 years old (Hollis et al., 1991). A stream of emission knots extends from both jets to the central object, implying collimated jet production occurring on several occasions in the last 90 yr. In the inner region within about 1″ of the central binary, evidence of the initiation of jet ejections toward the NE and SW has been seen in radio data (Kafatos et al., 1989; Dougherty et al., 1995).
Kafatos & Michalitsianos (1982) suggested that the jet production is associated with periastron of the system when the WD would be accreting matter from the wind of the Mira star at its maximum rate, resulting in the ejection of collimated high energy material from the accretion disk. In fact, Paresce & Hack (1994) found that the base of the northeast (NE) jet extends to within 15 AU of the Mira, confirming the central binary system as the source of the periodic jet production in this complex system. These authors also found that the jet is highly collimated even very close to the binary system, with an opening angle of about 15∘.
Collimated outflows, or jets, are associated with disk accretion onto black holes in both binaries and active galactic nuclei, neutron stars, and protostellar objects (Livio, 1997). Jets are also seen in two of the three major classes of accreting WDs (symbiotic stars and supersoft X-ray sources), as well as the hot central stars of some (possibly binary) planetary nebulae (Cowley et al., 1998; Corradi et al., 2001; Sokoloski et al., 2004). Although cataclysmic variable stars (CVs) produce bipolar disk winds, they have not been found to generate well-collimated jets (Knigge & Livio, 1998; Hillwig et al., 2004), perhaps because the accretion rate onto the WDs in CVs falls below some minimum value needed for jet production (e.g., Lasota & Soker (2005)). Two symbiotic-star jets have so far been detected in the X-rays: R Aqr (Kellogg et al., 2001) and CH Cyg (Galloway & Sokoloski, 2004). Galloway & Sokoloski (2004) noted that the spectral energy distributions of the CH Cyg and R Aqr outer jets are quite similar. The inner regions of WD X-ray jets, however, have heretofore not been explored. The only WD X-ray jet extended sufficiently to resolve the inner region is R Aqr.
The high resolution of imagery allows us to analyze the morphological and spectral changes of the R Aqr system on a small spatial scale in the X-ray regime, isolating changes in the jets from changes associated with the binary system. Analysis of the outer jet structures in the R Aqr system as seen in the data is reported in Kellogg et al. (2006, submitted). In this paper we focus on the observations of the central binary and the surrounding structure within 500 AU of the position of R Aqr. In Section 2, we present the observations for two epochs, 2000.7 and 2004.0. Section 3 describes the X-ray spectra of the central region and the new SW jet as well as model fits to the central source spectra. The analysis techniques used to identify the rapid variability of the hard X-ray emission are described in Section 4. Section 5 presents the VLA data that were acquired contemporaneously with the 2004.0 data. Interpretations of the data are discussed in Section 6. Conclusions are stated in Section 7.
2 Observations and Data Processing
An observation with the NASA X-ray Observatory of R Aqr was obtained on 2003 December 31 (2004.0) using the Advanced CCD Imaging Spectrometer (ACIS) with the target placed on one of the back-illuminated CCD chips, designated S3. The dataset, obsid 4546, had an exposure time of 36,534 s. In this paper, we compare this observation with an earlier observation of R Aqr taken 2000 September 10 (2000.7) that also used the ACIS S3 detector. The earlier observation, obsid 651, had an exposure time of 22,718 s (Kellogg et al., 2001). Both observations were made with ACIS timed, very-faint mode and have a pixel size of 0492. In ACIS timed mode the CCDs are read with a frame time of 3.2 seconds. The very-faint mode evaluates 5 5 pixel regions centered on the pixel of interest to determine the actual count rate of each pixel, using a grade system to determine the probability that a count is an actual X-ray event and not an artifact. The data from both of the observations were further processed using the Interactive Analysis of Observations (CIAO) analysis tools to apply consistent calibrations and data processing techniques. The calibration files used in this data processing are those available with Calibration Database (CALDB) 3.2.1. The event files were corrected for contamination of the optical/UV filter on ACIS that has been increasing since launch, reducing the low-energy quantum efficiency, and also corrected for a time-dependent detector gain, which is a correction for a secular drift in photon energy assignments. The Redistribution Matrix File (RMF) and Auxiliary Response File (ARF) were calculated specifically for each observation.
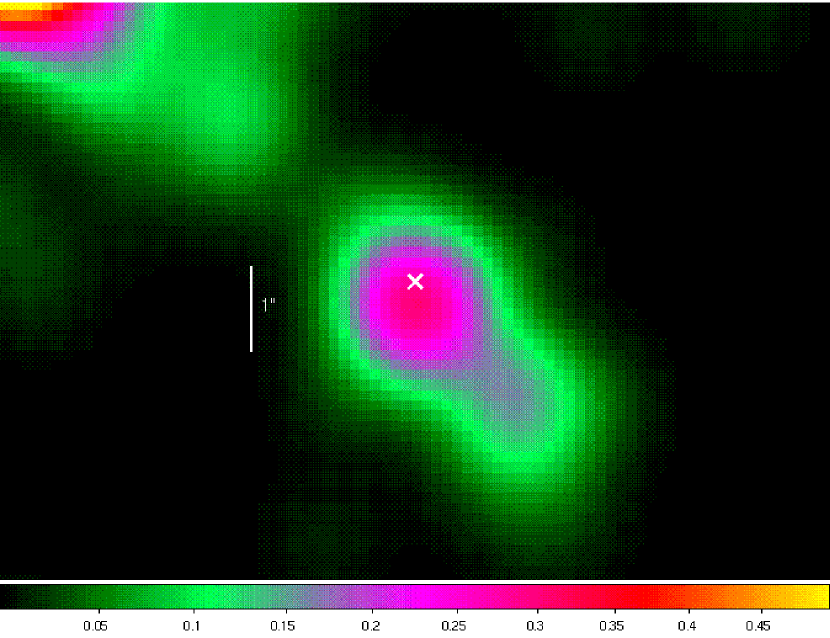
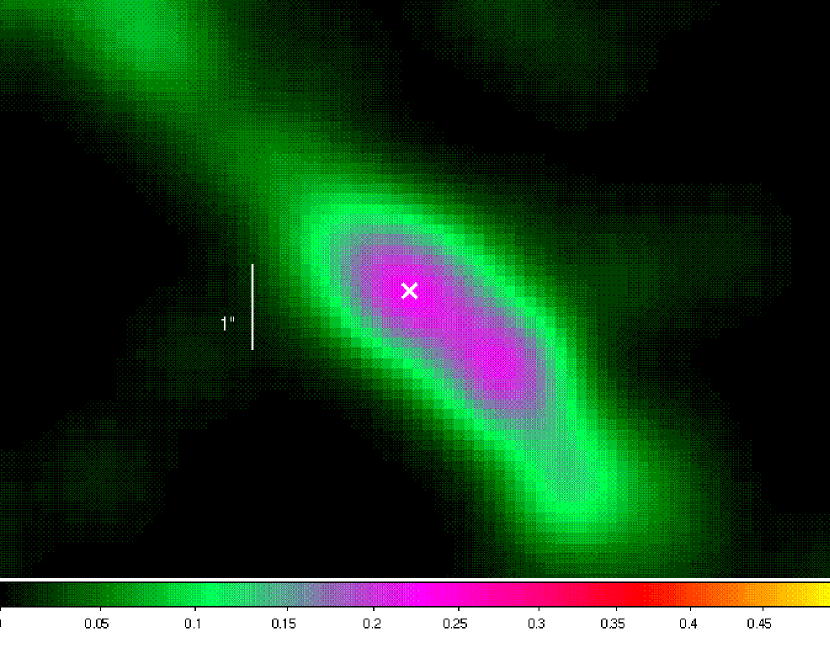
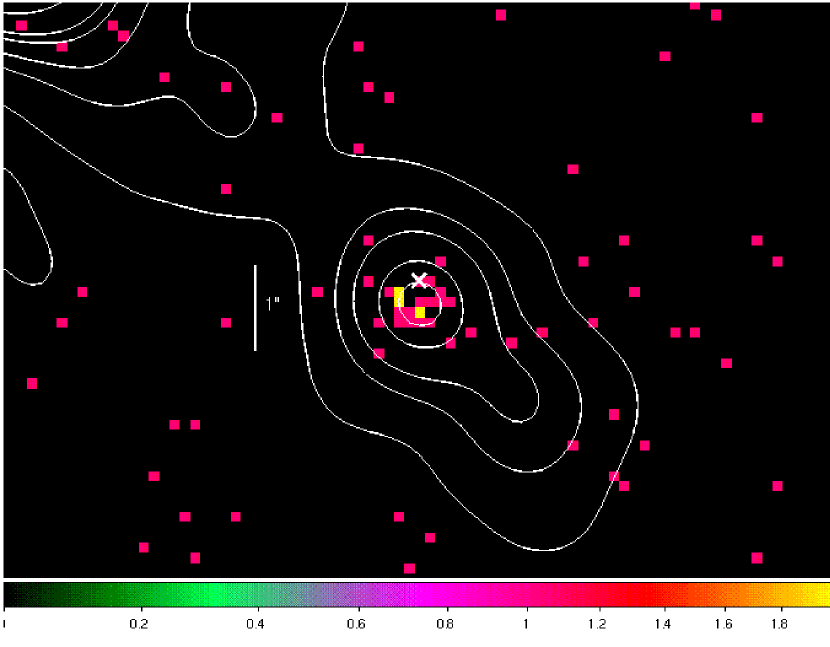
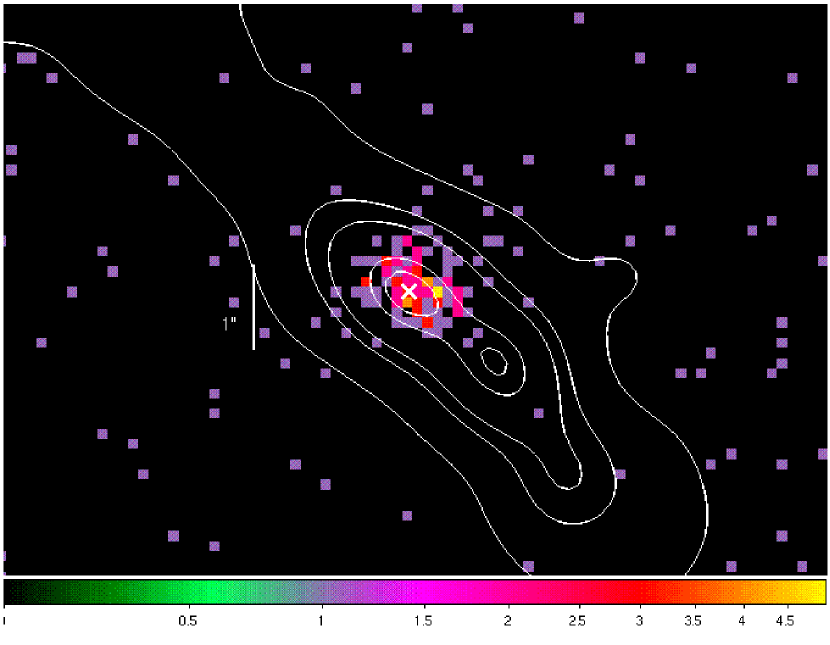
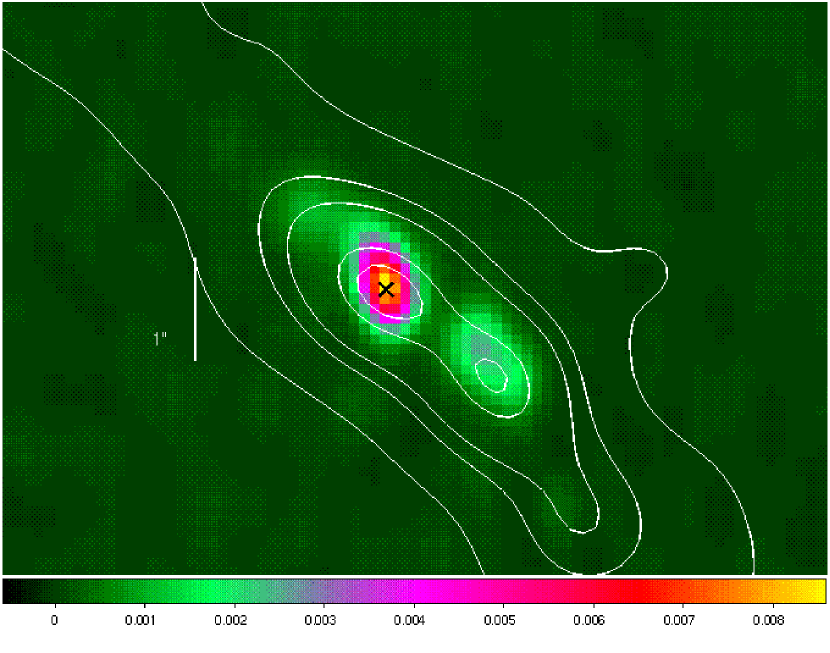
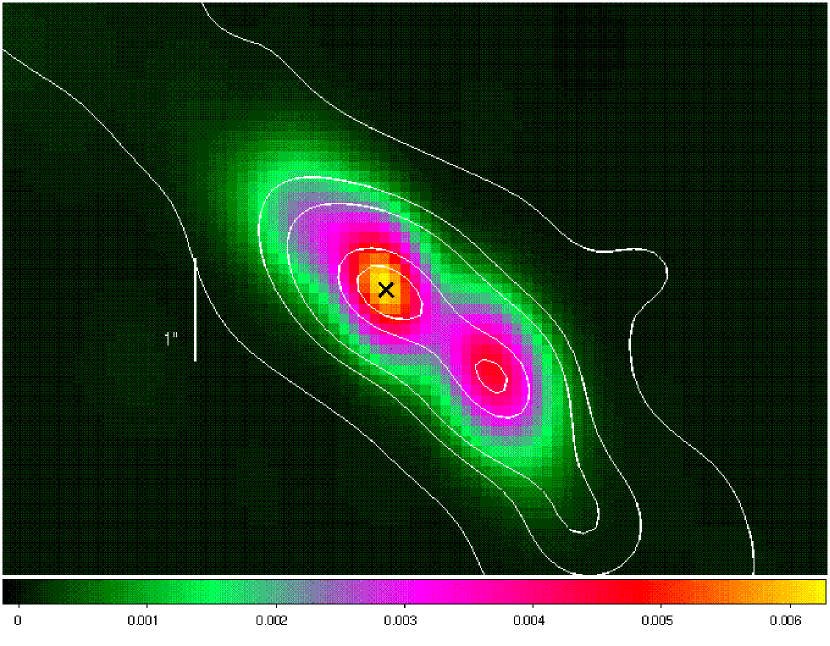
Images of the soft X-ray (E 2 keV) emission from the central region of R Aqr in 2000.7 and 2004.0 are shown in Figure 1. These images were created from the timed event lists for each observation. Using the floating point pixel position determined by applying the time-dependent correction for the spacecraft dither to the integer CCD chip pixel, sub-sampled images were created such that each pixel in the subsampled image has dimension 0.25 0.25 CCD chip pixel. The subsampling is effectively a hardware subsampling, with total counts preserved. The position of the Mira star (equivalent to the position of the binary system which is spatially unresolved at resolution) is marked with an ‘x’ on each image. A correction to the position of the Mira star has been made based on proper motion in the Hipparcos database. The accuracy of the pointing is 1″or better, so the position of the binary system is consistent with the position of the soft X-ray peak flux. Figure 2 presents adaptively smoothed versions of Figure 1, created using a Gaussian kernel of radius two subpixels with the CIAO csmooth tool. The soft X-ray emission is clearly more extended in the southwest/northeast direction in 2004.0 than in 2000.7.
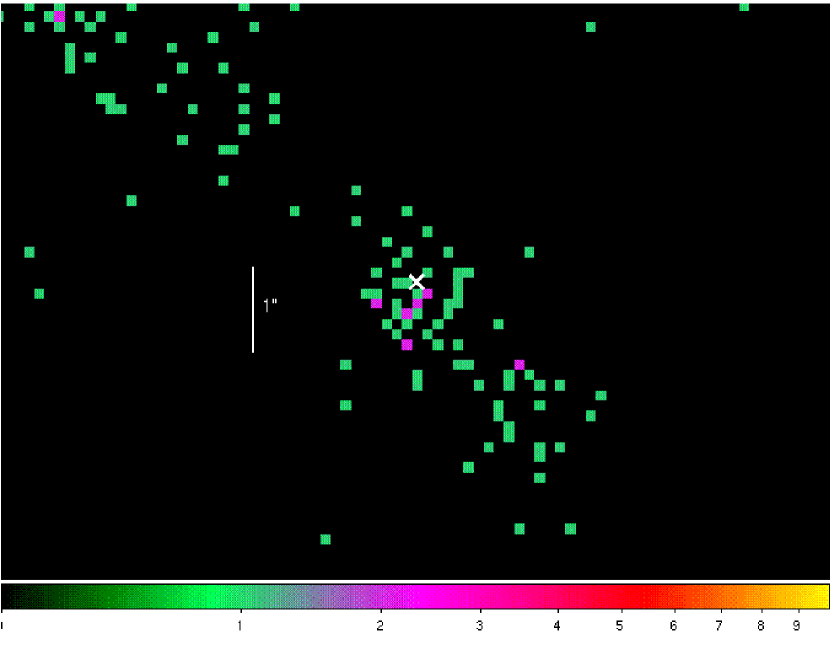
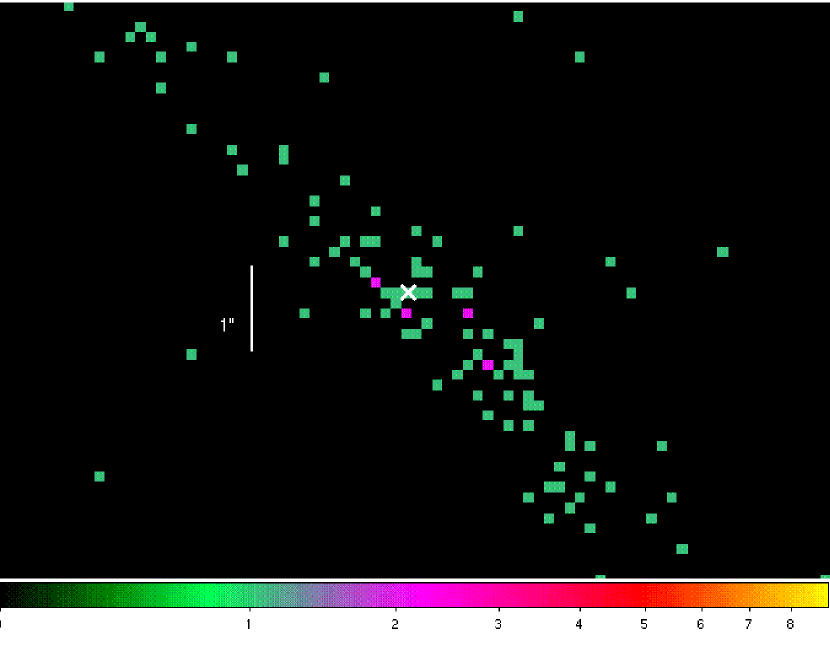
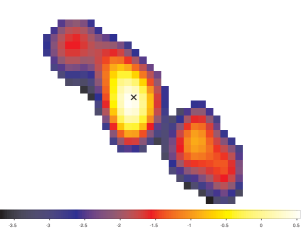
Images of hard X-ray emission (E 5 keV) of the central region for both observations are shown in Figure 3 with contours of the smoothed soft X-ray emission superposed for reference. For this figure, we show only the 0.25 pixel subsampled images without adaptive smoothing, due to the small spatial extent of the hard X-ray region. Although the spatial extent of the hard emission appears larger in 2004.0 than in 2000.7, in both cases it is consistent with a point source based on deconvolution of the point spread function with the measured flux.
3 X-ray Spectra
3.1 Central Source Spectra
For each epoch, we extracted spectra from an elliptical region at the position of the binary and another elliptical region circumscribing the extended soft emission to the SW. These two regions do not overlap spatially. We first discuss the spectra extracted from the region centered on R Aqr, with x-axis = 20, y-axis = 13, and position angle 31∘ south of west. The total number of counts in the spectra for the central source is low for both the 2000.7 observation (83 counts) and 2004.0 (195 counts). There are too few counts in either spectrum to bin the data at 10 counts per bin or higher in order to use statistics in evaluating the spectral fits. A bin size of 10 counts or higher leaves too few bins to yield a reasonable representation of the spectral morphology. Based on the significant changes between the 2000.7 and 2004.0 spectra in counts per second as well as in hard X-ray flux compared to soft X-ray flux, summing the spectra from the two epochs together to increase the statistics is not considered justified.
We used the C-statistic with the individual spectra binned at 3 counts per bin to evaluate the spectral fits. The background spectrum was fit independently from the source flux. Then the background components, scaled in normalization by the ratio of the background area to the source area, were fit simultaneously with the source flux. Simultaneous fitting of the background and the source is appropriate for C-statistic analysis rather than background subtraction because the C-statistic technique assumes Poisson statistic errors in the counts, which would be violated with background- subtracted data (Arnaud, 1996). The background flux is approximately a factor of 200 less than the source flux, so the influence on the fit is very small.
The 2004.0 central source spectrum with 195 counts was used to evaluate several spectral models to fit the data because the 2000.7 spectrum has too few counts to justify use in the selection of a model fit. For each trial fit, the goodness-of-fit calculation for the C-statistic as found in XSPEC was run with 2000 iterations, so that the percent of realizations parameter is expected to be accurate to about 2%. The soft portion of the 2004.0 central source spectrum (0.25-2.5 keV) was fit with three simple models including interstellar absorption: (1) powerlaw; (2) thermal emission APEC model; and (3) blackbody emission. The thermal plasma model consists of an emission spectrum from collisionally ionized gas, calculated using the APEC code v1.10 as implemented in XSPEC. All three of these models gave an acceptable value of best-fit C-statistics and percent of realizations using the C-statistic in XSPEC.
The hard portion of the 2004.0 spectrum (2.5-10 keV) was first fit with four models including interstellar absorption: (1) powerlaw; (2) thermal emission APEC; (3) blackbody emission; and (4) powerlaw plus thermal emission APEC. We rejected all of these four models for the hard emission using the rejection criterion defined as more than 90% of realizations less than best-fit C-statistics (Arnaud, K., 2006, private communication). These four models each had 100% of realizations less than the best-fit C-statistics of 158.34, 371.92, 199.74, and 158.71, respectively, resulting in rejection at greater than 2 sigma. However, five other models gave acceptable fits for the hard portion of the 2004.0 central source spectrum, all of which included interstellar absorption and a Gaussian Fe K line: (1) ionized absorption thermal emission APEC; (2) powerlaw; (3) neutral absorption powerlaw; (4) neutral absorption thermal emission APEC; and (5) neutral absorption blockbody emission. The first of these acceptable models has 6 free parameters, models (3)-(5) have 5 free parameters each, and model (2) has 4 free parameters. We note that model (2) has a powerlaw component with a negative slope.
In summary, we find that the central source spectrum for the 2004.0 data does not have sufficient counts to discriminate between several simple models. However, we can eliminate models that do not include a Gaussian component for the Fe K line. Also, all but one acceptable model for the hard component included additional absorption, either neutral or ionized. The exception was the powerlaw plus Gaussian model that had the largest C-statistic of all the acceptable models and a negative slope of -2.5. We selected the interstellar absorption powerlaw to fit the soft portion of the spectrum. Not only did the interstellar absorption powerlaw have the lowest value for the percent of realizations, but the discovery of radio synchrotron emission supports the selection of this model (Section 5). The interstellar absorption (neutral absorber (APEC thermal emission plus Gaussian for Fe K)) was chosen for the hard portion of the spectrum because it had the lowest value of percent of realizations and best-fit C-statistics. However, any of the acceptable models could have been used. We present this fit as a reasonable possibility for the spectral fit.
Because the 2000.7 data have fewer counts and thus weaker statistics for a fit determination, we fit the 2004.0 observation first, then froze several of the fit parameters from the 2004.0 fit to constrain the fit to the 2000.7 spectrum. Frozen parameters in the 2000.7 data were within acceptable ranges of those obtained when we allowed them to vary. In addition, we ignored the background in our fit to the 2000.7 data because we expect only 0.43 background counts with the 83 total counts. The parameter values from the fits to each observation are listed in Table 1. The line-of-sight interstellar absorbing column based on 21 cm observations to R Aqr is 1.85 1020 cm-3 (Stark et al., 1992) and the interstellar absorption parameter for all fits was frozen at this value. We experimented with allowing the absorption to vary, but always got an upper limit consistent with this column density. Integrating these models, we find (0.3-8 keV) of the central binary of 4 1029 erg s-1 and 8 1029 erg s-1 in 2000.7 and 2004.0, respectively, where is the distance to R Aqr in pc. The 2000.7 spectrum binned at 3 counts per bin and the fit determined as described above are shown in Figure 4. The 2004.0 spectrum, also binned at 3 counts per bin, and the fit are shown in Figure 5.
A thermal plasma at the temperature determined from the 2004.0 observation, T=6.8 keV, includes emission from He-like Fe XXV near 6.7 keV and H-like Fe XXVI near 6.97 keV. The He-like Fe XXV line is suggested by visual examination of the 2004.0 spectrum, but there is no indication of the weaker H-like Fe XXVI line. In the 2000.7 spectrum, the Fe XXV and Fe XXVI lines are included in the thermal plasma fit by definition, but are not visually evident in the spectral data. In this spectrum, there are essentially no counts with energy greater than 6.5 keV, so no conclusion can be drawn concerning either the Fe XXV or Fe XXVI lines. The Fe K line detected in the 2000.7 observation of the central core of R Aqr binary system is consistent with emission from neutral Fe K, as discussed in Kellogg et al. (2001). In contrast, the 2004.0 observation shows a more complex profile that might include both neutral Fe K line and He-like Fe XXV. We emphasize, however, that there are too few counts in either the 2000.7 spectrum or the 2004.0 spectrum to reach meaningful conclusions concerning validity of any particular model. In both the 2000.7 and 2004.0 observations, the hard source is consistent with a point source, indicating this very hard emission is within 100 AU of the binary system.
3.2 Southwest Extension Spectra
The spectra of the SW extension were extracted for both epochs with an elliptical region centered at RA = 23:43:49.4 and Dec = -15:17:06.1, with x-axis = 18, y-axis = 14, and position angle of 31∘ south of west. The position of the extraction region was centered on the peak of the soft X-ray emission of the SW extension in the 2004.0 observation. There is no flux at energies higher than 2 keV in either epoch. The extracted spectrum for the 2000.7 data has only 21 counts (see Fig. 6) and thus cannot be fit with any confidence. Nor can the 2004.0 extracted spectral data with 29 counts be fit with any confidence. However, an excess around the energy of O VII (0.57 keV) is seen in the earlier epoch but absent in the 2004.0 inner jet spectrum (Fig. 7). We cannot exclude a powerlaw fit to either of the inner jet spectra. Although no formal fit has been attempted, we made the following observations from examining the spectra. In 2000.7 the spectrum of the SW extension is dominated by apparent emission near 0.57 keV, the energy of O VII. In 2004.0, there is no increase in flux over the entire range compared with 2000.7, but the 0.57 keV emission is much weaker and possibly not present.


4 X-ray Timing Analysis
Rapid variability of the X-ray flux in energies greater than 5 keV was detected in the 2004.0 dataset for the region immediately surrounding the binary. The event times were first corrected to barycenter times. The data were then binned at 100 seconds per bin for the timing analysis and background-corrected. The errors in the count rates were calculated using Poisson statistics for each bin of 100 seconds and represent one standard deviation. We neglected any uncertainty in the photon arrival times because the 100 s bin size is significantly larger than the 3.2 s frame time. Using the Lomb normalized periodogram algorithm (Press et al., 1992), we found a period of 1734 s with 0.05 significance level for the probability that the period is spurious, and a maximum Lomb power of 8.96, which takes into consideration the number of bins used. The resulting periodogram is shown in Fig. 8. A similar analysis of the 2000.7 data did not reveal a period of credible confidence.
As an additional check, we then performed a period search using epoch folding for an array of trial periods between 600 and 6000 s. The period found with this search that gave the maximum result (maximum deviation implying the most likely period) was 3475 s, approximately double the period determined with the Lomb periodogram. This result could mean the period is double-peaked. We accept the period determined by the Lomb periodogram of 1734 s but with the caveat that the period could be 3475 s and double-peaked. The lightcurve data for the 2004.0 observation were folded on a period of 1734 s and errors were propagated through the folding procedure. The resulting folded light curve with associated errors is shown in Fig. 9, with two full phases shown in the plot for clarity.


We evaluated whether the rapid variability could be related to the dither pattern of the telescope during the observation. The position of the central source of R Aqr on the 2004.0 observation fell near a CCD node boundary on ACIS. The CCD node boundary columns are less sensitive than other columns on the CCD. The dithering of the telescope has a period of 1000 seconds in the x-direction of the CCD chip and 707 seconds in the y-direction of the CCD chip. The central source occasionally fell near or on one of the less sensitive columns at the edge of the dither pattern. To determine if dithering onto the node boundary influenced or even caused the variability we detected, we calculated the percentage of the source flux that was on the CCD chip, rather than on the node boundary, as a function of time, thus determining the effect of the dither pattern. We found a period of 1000 s for the source being less than 100% on the CCD chip, with an amplitude for that period ranging from 98% to 80% of the source flux during the course of the observation. This 1000 s period is due to the dither pattern. No other period was detected for the spatial position of the source as a function of the dither pattern. As a further check, we then exposure-corrected the events so that the events that had been placed in the node boundary due to the spacecraft dithering had the same flux as they would have had if they had fallen directly on the CCD chip node. Using this exposure-corrected event list, we repeated the timing analysis and determination of significance of the variability. There was no difference in the results between this exposure-corrected light curve and the original light curve. We believe this analysis eliminates any instrumental cause for the variability we have detected.
5 Radio data
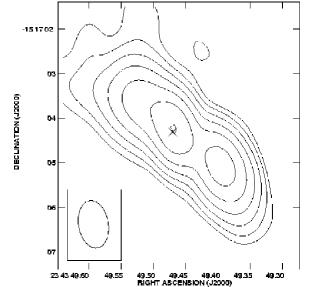
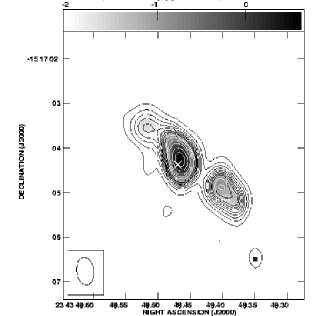
R Aqr was observed on 2004 January 6 (2004.0) with the NRAO Very Large Array in the B configuration. The receivers were tuned to the default U (2 cm) and X (3.5 cm) frequencies with 100 MHz bandpasses. Two scans were made at X band (18 minutes each) and one scan at U band (11 minutes). We used the AIPS software for standard calibration, self-calibration, and imaging. Figure 10 shows the contours and beam width for the 3.5 cm band observation, which has a resolution of 10 069, comparable to the resolution. The 2 cm band contours and beam width are shown in Figure 11. The 2 cm band has a higher resolution of 063 038, showing the radio detection of the new SW extension in finer detail. The 3.5 cm and 2 cm band images are shown in Figure 12 as false color images instead of contours, with the soft X-ray contours from the 2004.0 observation superposed for reference. The alignment of the regions of maximum flux in the radio and in the X-ray data is nearly exact, considering the 05 - 1″ pointing accuracy in the data.
Taking the radio spectral index, , to be defined such that , where is the flux density at frequency , we determine the spectral index between 3.5 cm and 2 cm from
| (1) |
where is the flux density at 2 cm (15 GHz) in Jy and is the flux density at 3.5 cm (8.6 GHz) in Jy. Using only data that allowed a determination of the flux densities to greater than , we constructed a map of the spectral index (see Figure 13). The spectral-index image allows the identification of regions of synchrotron radiation, which have negative values of . It is clear from Figure 13 that the central source is thermal ( is positive) but the radio emission coinciding with the new SW extension is non-thermal, as is a smaller region NE of the central source. This spectral-index image is also shown in grey scale in Figure 11, superposed on the 3.5 cm contours. Note that no soft X-ray emission is seen NE of the central source in either of the Chandra observations.
6 Discussion
6.1 X-ray Continuum from the Central Binary Source
The X-ray count rate from the central binary increased between 2000.7 and 2004.0, due in an increase in the count rate of the hard spectral component. There was virtually no change in the count rate below 2.5 keV. In terms of counts, we calculate a hardness ratio of H/S where H = number of counts with energy greater than 2.5 keV and S = number of counts with energy less than 2.5 keV. Using this definition, H/S 1 for the 2000.7 central source spectrum and H/S 4 for the 2004.0 central source spectrum. The candidate model we explored in Section 3.1 indicates the thermal-plasma-fit flux increased by a factor of 2-3 (see Table 1) above 5 keV. Below 2.5 keV, the flux either decreased or possibly showed no change at the limits of the 90% confidence measurements for this candidate model.
The soft X-ray continuum for R Aqr is likely due to an accretion activity or jet production. The soft X-rays may be due to reprocessed hard X-rays originating on the surface of the WD if there is direct accretion onto the magnetic poles (Ishida et al., 1994). Another source of the soft continuum might be shocks generated by emerging jets (Galloway & Sokoloski, 2004). The soft X-ray ( 2.0 keV) could also be attributable to an accretion disk. The hard continuum in the range 5-10 keV can be produced from an accretion column if material from the companion wind or an accretion disk is accreted directly onto the surface of the WD along magnetic field lines (Cordova et al., 1985; Rosen et al., 1988). If the WD has a sufficiently strong magnetic field, the accretion disk will not extend to the surface of the star. Instead, material flows from the accretion disk or directly from the wind along field lines to the magnetic poles of the WD, producing a standing shock that can emit the hard X-ray continuum and emission lines. Another possible source of the hard X-ray continuum is an accretion disk corona. Material dissipating from the surface of an accretion disk can form a hot corona around the WD star which produces a hard X-ray continuum. The hard X-ray continuum might also be due to colliding winds. If the winds of the two stars have sufficient momentum, the collision of the winds can produce a bow-shaped shock and a wind-wind interface that heats the gas to high X-ray temperatures. Kenny & Taylor (2005) have modeled the colliding winds in symbiotic stars and find that some systems will have parameters consistent with a colliding wind scenario. Here we explore the possibility that the hard X-ray emission from the central binary in R Aqr is related to magnetic accretion. Both the possible presence of K gas indicated by the apec model and potential for the He-like Fe line, as well as the modulation of the hard X-rays at a period of 29 m, provide hints that the WD in R Aqr might be magnetic.
The central source spectra are highly absorbed, with a nH= cm-3 determined from the candidate fit we chose for the 2004.0 spectrum. All of the acceptable models we tried required large amounts of absorption, except the powerlaw + Gaussian which had a negative slope which might represent a crude absorption model. Such a large amount of absorption would be consistent with the line of sight passing through pre-shock gas in the accretion column and/or an accretion curtain. Intermediate Polars (IPs) generally have heavily-absorbed X-ray spectra with nH 1 cm-3, with the notable exceptions of EX Hya, V1025Cen, and HT Cam (Evans & Hellier, 2005). Done & Magdziarz (1998) have discussed absorption in CVs in terms of multiple absorbers from the pre-shock gas. An accretion curtain absorber is more distant from the WD surface and creates a more uniform absorption of the shock emission region. The dense wind of the Mira star can also contribute large amounts of absorption. We cannot differentiate between these possibilities with the Chandra data presented here.
6.2 Fe K emission
The candidate spectral model that we have fit to the data of thermal emission for the hard X-rays includes He-like and H-like Fe emission. The presence of He-like Fe XXV would indicate that the emitting region could have a temperature of K, which is consistent with the thermal plasma temperature of K from our model fit. However, several other models are equally viable. The He-like Fe XXV line is observed in the IP EX Hya. Fujimoto & Ishida (1997) attributed this thermal line to the standing shock in the accretion columns above the magnetic poles .
Neutral Fe K lines are present in the spectra of the central binary source in both epochs. In the case of an accretion column, neutral and near neutral iron fluorescence is expected from reflection of the X-ray flux in the column on the surface of the WD (Done & Magdziarz, 1998), as well as possibly in the post-shock and pre-shock regions of the accretion column. Another possible origin for the Fe K neutral and lower excitation emission is the dense H II nebula surrounding the binary system, formed from mass loss by the Mira and ionized by the WD. Given the known presence of jets in this system, the same collimated high energy material expelled by the WD/Mira system could cause fluorescence of Fe K as it impacts cooler, denser material while leaving the system.
6.3 Rapid Variability of the Hard X-ray Emission
Rapid variability of the hard X-ray emission of 1734 s was detected with a 95% confidence in the 2004.0 observation for events with energies higher than 5.0 keV. There are too few counts in the dataset to determine if the variability detected is due to the hard continuum, the emission lines, or both. The hard X-ray period of 1734 s would almost certainly represent the rotational period of the WD, and is similar to the WD rotation periods in CVs and the magnetic symbiotic Z And (28 m; Sokoloski & Bildsten, 1999). If the WD in R Aqr does indeed have a strong enough magnetic field to channel the accretion flow and produce the observed oscillation, the WD spin period could be either 29 m, if the pulse profile is single-peaked, or 58 m, if the pulse profile is double-peaked. A double-peaked pulse profile might indicate varying viewing angles of an accretion curtain. The rapid variability, coupled with the spectral morphology similarities, indicates a possible correlation between the WD in R Aqr and Intermediate Polars. The variability is also strong evidence for a magnetic field, which is required for accretion onto a magnetic pole. The rapid X-ray variability is a compelling reason to reject a hot corona or a colliding wind as possible sources for the hard X-ray flux in R Aqr.
The currently accepted orbital period of 20-44 yr is too long to allow classification as a CV. A 20-44 year period with a rotational period of the hot companion of about 29 m would necessitate a weak magnetic coupling of the stars, possibly because of a large separation between the two stars. While there are no mCVs with orbital periods as long as years, there are magnetic symbiotic stars with such long orbital periods, such as Z And (Brocksopp et al., 2004a).
Although we have only analyzed two observations of R Aqr with at this time, the first observation in 2000.7, taken about halfway between optical maximum and minimum of the Mira star (see Figure 14), shows no detectable rapid X-ray variability and only a neutral Fe K line, while the second observation in 2004.0, taken near optical minimum of the Mira star when mass loss would be at a maximum, has 250% increase in hard X-ray flux and rapid variability implying accretion onto the magnetic pole(s). A correlation between a change in the R Aqr WD accretion rate and/or mode, and the pulsation cycle of the Mira star is a tantalizing possibility that would require much additional data at different phases of the Mira pulsation period to explore.

6.4 The New SW Jet
It is apparent from Figures 1 and 2 that a distinct emission extension in the SW has developed in the soft ( 2 keV) X-ray emission between the two observations. There is close agreement between the radio and the X-ray contours in Figure 12. The NE central binary soft X-ray emission is no longer circular but ellipsoidal in shape. The SW extension has extended to about 125 AU from the position of R Aqr and is ellipsoidal in shape. In the 2000.7 spectrum of the SW extension region, there is excess emission in the 0.4-0.7 keV region of the spectrum, which could be O VII emission at 0.57 keV associated with shock cooling. Due to the change in morphology in 3.3 years from a faint extension of the central region toward the SW to a distinct elliptical region that rivals that of the central object itself in soft X-ray and radio intensity, as well as the non-thermal radio spectrum in 2004.0, we interpret the SW region as the initiation of a new synchrotron-powered jet.
The radio emission of the core of R Aqr has been monitored for more than two decades (Kafatos et al., 1983; Dougherty et al., 1995; Mäkinen et al., 2004). While earlier studies find a clear extension to the NE of the binary position, Mäkinen et al. (2004) find that the emission NE of the central source is decreasing between 1995 and 1999. A time series of VLA images beginning in 1982, and obtained approximately every four years, clearly shows the eruption of a new radio jet to the NE in the late 1980’s (Pedelty, private communication). However, after 2000, the radio activity switched to the SW of the central object. The previous radio NE jet has faded considerably. The peak intensity of the radio emission, centered on the star in each epoch, decreased by nearly a factor of two in a little over three years. In 2000 the central source was dominant, whereas in 2004 it is more nearly equal to the intensity of the new SW jet. In both 2000 and 2004 the radio spectrum of the central core is thermal, while the spectrum of the SW jet is non-thermal in 2004.0.
Kafatos et al. (1989) observed the inner region of R Aqr at 2 cm and 6 cm with VLA. An 1″ extension in the NE direction from the central binary of R Aqr was found to be non-thermal in that study using data taken in 1987. Moving outward from the central object along the projected trajectory of the NE jet, the radio emission quickly became thermal. These authors speculated that the jet initiation mechanism is non-thermal, probably produced by synchrotron emission from a mildly relativistic gas. However, Dougherty et al. (1995) report that in 1992-3 the radio flux of both the small NE extension and a knot about 0.8″ SW of the central source were thermal and had increased in radio flux by a factor of three in the 5 yr since Kafatos et al. (1989) reported non-thermal radiation. Our detection of non-thermal radio emission in a new SW extension is consistent with the theory that newly formed jets are non-thermal. If the appearance of a new synchrotron-powered jet signals increased accretion by the WD at periastron, then the data of Kafatos et al. (1989) and this present study suggest an orbital period of at most 17 yr.
Prior to the radio and X-ray observations reported here, Michalitsianos et al. (1994) predicted the formation of a new SW jet in the 2002 timeframe based on redward-shifted UV emission lines with velocities of about +200 km s-1 observed with . The appearance of these redward-shifted lines in 1992 was interpreted as an indication of the initiation of a collimated wind or stream of material which would begin to emit in radio, optical, and UV wavelengths about 10 years after the detection of the gas motion. Michalitsianos et al. (1994) postulated that the jets in R Aqr are one-sided, alternating direction on a timescale of 1 decade. The new SW jet we have identified appeared somewhere between 2000.7 and 2004.0, which is right on the schedule Michalitsianos et al. (1994) proposed. Since only a jet in the SW direction was detected in 2004.0, the Michalitsianos et al. (1994) theory of one-sided jet production is also supported by our observations.
Whereas most relativistic jets from neutron stars or black holes produce non-thermal emission that in some cases extends from radio to X-ray wavelengths (Fender & Maccarone, 2004), the non-relativistic jets from WDs are primarily thermal X-ray emitters. Kellogg et al. (2001) found that the X-rays from the R Aqr outer jet were consistent with thermal emission from a shock-heated plasma. Galloway & Sokoloski (2004) obtained a similar result for the CH Cyg jet X-ray emission. The identification of non-thermal radiation in the new, recently-formed SW jet makes it very unusual for a stellar jet from a white dwarf and may yield important information about the formation and early evolution of such jets.
6.5 Comparison to Similar Objects
The spectra of the central source of R Aqr presented here are similar to the X-ray spectra of CVs, dwarf novae, and other symbiotic systems in that these objects generally require a two-temperature component model and they commonly show evidence of at least Fe K. Two-temperature components models such as we find for R Aqr are required to describe most of the ASCA spectra of mCVs (Ezuka & Ishida, 1999), although these objects commonly show more soft X-ray flux than R Aqr. The presence of Fe K lines, both fluorescent and thermal, in the spectrum is also common in CVs, magnetic CVs (mCVs), and symbiotic systems. A survey of the ASCA data of a sample of 23 mCVs showed Fe K as well as thermal Fe lines in all of the spectra (Ezuka & Ishida, 1999).
IPs are a subclass of mCVs in which the accretion disk is truncated at the inner edge and accretion takes place at the magnetic poles, with the accreted matter transported from the disk via accretion curtains. Modulation in the X-rays due to the spin period is a signature of IPs, as is a ratio of Pspin/Porbit 1. The X-rays are produced primarily at the site of accretion in the accretion column and WD surface rather than in the boundary layer, which never reaches the surface of the WD. Most IPs have both a thermal and fluorescent contribution to the Fe lines (Ishida et al., 1991). High levels of absorption are generally required to fit the spectra of mCVs, including IPs. The spectra of IPs have been fit with plasma models and partial or ionized absorbers (V709 Cas; de Martino et al. (2001), BY Cam; Kallman et al. (1996), TV Col; Rana et al. (2004)). The spin period of the WD is often detected in X-ray observations of IPs, but is not always energy-dependent. TV Col, based on RXTE, ROSAT, and ASCA data (Rana et al., 2004), does have an energy-dependent spin period modulation, similar to what we find for R Aqr. The orbital period can sometimes be derived from the power spectra of IPs by detection of sidelobes and their harmonics. We did not find obvious evidence of sidelobes. IPs, as opposed to polars, can have spin periods that are much shorter than the orbital period because the magnetic field is weaker and not necessarily sufficient to lock the WD spin to the orbital period. The X-ray data we have presented from R Aqr are similar to IP X-ray data due to the possible presence of He-like Fe XXV and the detection of variability on the order of less than an hour. However, IPs have orbital periods on the order of hours, not years. Therefore, R Aqr is probably a magnetic symbiotic star analogous to, but not identical to, an IP. An example of a magnetic symbiotic is Z And, which has a 28 min oscillation (Sokoloski & Bildsten, 1999) and a small radio jet (Brocksopp et al., 2004b)
CH Cyg is a nearby symbiotic system that has several similarities to R Aqr. CH Cyg has jets detected in the radio (Taylor et al., 1986), optical (Crocker et al., 2001) and X-ray (Galloway & Sokoloski, 2004). While the donor stars in CH Cyg and R Aqr are of similar spectral type (CH Cyg: M6III; R Aqr: M7III), the donor in R Aqr is a Mira variable. The X-ray spectrum of the accreting central source in CH Cyg presented by Galloway & Sokoloski (2004) is quite similar to that of R Aqr in 2000.7. X-ray spectra of both stars required a two-temperature fit to the continuum with a highly absorbing column. A strong Fe K line is present in the CH Cyg spectrum (Ezuka et al., 1998). Galloway & Sokoloski (2004) find a shock-heated plasma at the interface of the jet and the surrounding ISM. Ezuka et al. (1998) also concluded that the soft component of the continuum originates from the shocks generated by the jets. In the case of R Aqr, we have modeled the X-ray spectrum for the central source separately from the new jet, but shocks due to the emerging jets may contribute to the soft continuum in the central source.
Another interesting comparison can be made with Hen 3-1341, a symbiotic system with stellar jets. Munari et al. (2005) find that the jets develop during periods of increased accretion rate and cease to develop as the wind from the WD decreases. The implication is that jet production is coupled with accretion rate. The jet production in R Aqr may also be dependent on the wind speed and mass loss from either the WD or the donor star. The spectral changes including increase of the hardness ratio and the possibility of detection of He-like Fe XXV indicate a significant change of state in the accretion process in R Aqr on a time scale of few years.
7 Conclusions
X-ray observations of the symbiotic system R Aqr have revealed unexpected variability on a time scale of minutes as well as a time scale of a few years. Identification of a 1734 s modulation in the hard ( 5 keV) X-ray emission in the 2004.0 observation with a confidence level of 95% is a strong suggestion that the WD in R Aqr has a magnetic field. The rapid variability of the Fe lines and/or hard continuum, if verified by future observations, implies an origin in the standing shock above the accreting column at the magnetic poles of the WD and is assumed to represent the spin period of the WD.
The spectral energy distribution and total flux also changed over the 3.3 yr time period between the two observations. We are not able to identify a unique acceptable model due to the low number of counts in the two spectra analyzed. We can, however, make some general statements based on the properties of the spectra and the acceptable fits that we studied. There is an increase in the hardness ratio in the 2004.0 data compared to the 2000.7 data of a factor of 4. All acceptable fits for the hard portion of the spectrum require a large amount of absorption, with the exception of a powerlaw with a negative photon index. Also, all acceptable fits required a Gaussian profile to fit the Fe K emission. As an example, we selected a model with a combination of a power law for the soft X-ray emission and a highly absorbed, collisionally excited, thermal plasma model of temperature T = 108 K for the hard X-ray emission. Several other simple models cannot be excluded considering the number of counts in the spectra. Based on our candidate model, the soft X-ray continuum has either decreased in intensity or possibly not changed during the 3.3 yr interval between the observations, while the hard X-ray continuum has definitely increased.
We explored the source of the X-ray emission for the case of the candidate model we presented. If the WD is indeed magnetic and the X-ray emission originates in a standing shock at the magnetic pole(s), the soft X-ray component may be due to reprocessed hard X-rays at the surface of the WD, with some possible contribution pre- and post-shock regions of the column and possibly from an accretion disk. The hard X-ray continuum and emission lines would be produced by the standing shock in this scenario. The temperature we have determined for the hard component of the 2004.0 spectrum is consistent with an origin in a accretion column shock. For this scenario, we interpret the changes in the X-ray emission as indications of changes in the accretion parameters of the R Aqr binary.
During this 3.3 yr period, an extension of soft X-rays appeared that we conclude is evidence of a new jet emitted in the SW direction from the central binary position. Contemporaneous radio data have non-thermal spectra indicative of synchrotron emission from the new jet. Previous radio observations of R Aqr in 1987 showed a non-thermal extension from the central object toward the NE, interpreted as a new jet. Non-thermal radiation may be a signature of a newly emitted jet, even in stellar systems where older jets are generally thermal. The history of jet formation in the R Aqr system suggests non-thermal emission during the earliest part of the jet evolution, and an orbital period of about 17 yr if the jet formation is coupled with periastron.
The dramatic change in the X-ray emission properties and the appearance of a new jet in the 3.3 yr time interval between the two observations suggest a far more dynamic system than has previously been assumed for R Aqr, and symbiotic stars in general. The data suggest the accretion mode and/or rate can change on a timescale of a few years or less. We find that R Aqr may have some similarities with Intermediate Polars in the rapid variability and spectral characteristics. But the long orbital period of R Aqr indicates it is more likely a magnetic symbiotic system.
References
- Arnaud (1996) Arnaud, K. A. 1996, in ASP Conf. Ser. 101: Astronomical Data Analysis Software and Systems V, ed. G. H. Jacoby & J. Barnes, 17–+
- Brocksopp et al. (2004a) Brocksopp, C., Sokoloski, J. L., Kaiser, C., Richards, A. M., Muxlow, T. W. B., & Seymour, N. 2004a, MNRAS, 347, 430
- Brocksopp et al. (2004b) —. 2004b, MNRAS, 347, 430
- Cordova et al. (1985) Cordova, F. A., Mason, K. O., & Kahn, S. M. 1985, MNRAS, 212, 447
- Corradi et al. (2001) Corradi, R. L. M., Munari, U., Livio, M., Mampaso, A., Gonçalves, D. R., & Schwarz, H. E. 2001, ApJ, 560, 912
- Cowley et al. (1998) Cowley, A. P., Schmidtke, P. C., Crampton, D., & Hutchings, J. B. 1998, ApJ, 504, 854
- Crocker et al. (2001) Crocker, M. M., Davis, R. J., Eyres, S. P. S., Bode, M. F., Taylor, A. R., Skopal, A., & Kenny, H. T. 2001, MNRAS, 326, 781
- de Martino et al. (2001) de Martino, D., Matt, G., Mukai, K., Belloni, T., Bonnet-Bidaud, J. M., Chiappetti, L., Gänsicke, B. T., Haberl, F., & Mouchet, M. 2001, A&A, 377, 499
- Deshpande et al. (1987) Deshpande, M. R., Joshi, U. C., Kulshrestha, A. K., Sen, A. K., Rao, N. K., & Raveendran, A. V. 1987, PASP, 99, 62
- Done & Magdziarz (1998) Done, C. & Magdziarz, P. 1998, MNRAS, 298, 737
- Dougherty et al. (1995) Dougherty, S. M., Bode, M. F., Lloyd, H. M., Davis, R. J., & Eyres, S. P. 1995, MNRAS, 272, 843
- Evans & Hellier (2005) Evans, P. A. & Hellier, C. 2005, MNRAS, 359, 1531
- Ezuka & Ishida (1999) Ezuka, H. & Ishida, M. 1999, ApJS, 120, 277
- Ezuka et al. (1998) Ezuka, H., Ishida, M., & Makino, F. 1998, ApJ, 499, 388
- Fender & Maccarone (2004) Fender, R. & Maccarone, T. 2004, in ASSL Vol. 304: Cosmic Gamma-Ray Sources, 205–+
- Fujimoto & Ishida (1997) Fujimoto, R. & Ishida, M. 1997, ApJ, 474, 774
- Galloway & Sokoloski (2004) Galloway, D. K. & Sokoloski, J. L. 2004, ApJ, 613, L61
- Hillwig et al. (2004) Hillwig, T., Livio, M., & Honeycutt, R. K. 2004, PASP, 116, 397
- Hollis et al. (1991) Hollis, J. M., Oliversen, R. J., Michalitsianos, A. G., Kafatos, M., & Wagner, R. M. 1991, ApJ, 377, 227
- Ishida et al. (1994) Ishida, M., Mukai, K., & Osborne, J. P. 1994, PASJ, 46, L81
- Ishida et al. (1991) Ishida, M., Silber, A., Bradt, H. V., Remillard, R. A., Makishima, K., & Ohashi, T. 1991, ApJ, 367, 270
- Kafatos et al. (1983) Kafatos, M., Hollis, J. M., & Michalitsianos, A. G. 1983, ApJ, 267, L103
- Kafatos et al. (1989) Kafatos, M., Hollis, J. M., Yusef-Zadeh, F., Michalitsianos, A. G., & Elitzur, M. 1989, ApJ, 346, 991
- Kafatos & Michalitsianos (1982) Kafatos, M. & Michalitsianos, A. G. 1982, Nature, 298, 540
- Kafatos et al. (1986) Kafatos, M., Michalitsianos, A. G., & Hollis, J. M. 1986, ApJS, 62, 853
- Kallman et al. (1996) Kallman, T. R., Mukai, K., Schlegel, E. M., & Paerels, F. B. 1996, ApJ, 466, 973
- Kellogg et al. (2001) Kellogg, E., Pedelty, J. A., & Lyon, R. G. 2001, ApJ, 563, L151
- Kenny & Taylor (2005) Kenny, H. T. & Taylor, A. R. 2005, ApJ, 619, 527
- Knigge & Livio (1998) Knigge, C. & Livio, M. 1998, MNRAS, 297, 1079
- Lasota & Soker (2005) Lasota, J.-P. & Soker, N. 2005, in ASP Conf. Ser. 330: The Astrophysics of Cataclysmic Variables and Related Objects, 117–+
- Livio (1997) Livio, M. 1997, in ASP Conf. Ser. 121: IAU Colloq. 163: Accretion Phenomena and Related Outflows, 845–+
- Mäkinen et al. (2004) Mäkinen, K., Lehto, H. J., Vainio, R., & Johnson, D. R. H. 2004, A&A, 424, 157
- Mattei & Allen (1979) Mattei, J. A. & Allen, J. 1979, JRASC, 73, 173
- Meier & Kafatos (1995) Meier, S. R. & Kafatos, M. 1995, ApJ, 451, 359
- Merrill (1935) Merrill, P. W. 1935, ApJ, 81, 312
- Merrill (1950) —. 1950, ApJ, 112, 514
- Michalitsianos et al. (1980) Michalitsianos, A. G., Hobbs, R. W., & Kafatos, M. 1980, ApJ, 237, 506
- Michalitsianos et al. (1994) Michalitsianos, A. G., Perez, M., & Kafatos, M. 1994, ApJ, 423, 441
- Munari et al. (2005) Munari, U., Siviero, A., & Henden, A. 2005, MNRAS, 360, 1257
- Paresce & Hack (1994) Paresce, F. & Hack, W. 1994, A&A, 287, 154
- Press et al. (1992) Press, W. H., Teukolsky, S. A., Vetterling, W. T., & Flannery, B. P. 1992, Numerical recipes in FORTRAN. The art of scientific computing (Cambridge: University Press, —c1992, 2nd ed.)
- Rana et al. (2004) Rana, V. R., Singh, K. P., Schlegel, E. M., & Barrett, P. 2004, AJ, 127, 489
- Rosen et al. (1988) Rosen, S. R., Mason, K. O., & Cordova, F. A. 1988, MNRAS, 231, 549
- Sokoloski & Bildsten (1999) Sokoloski, J. L. & Bildsten, L. 1999, ApJ, 517, 919
- Sokoloski et al. (2004) Sokoloski, J. L., Kenyon, S. J., Brocksopp, C., Kaiser, C. R., & Kellogg, E. M. 2004, in Revista Mexicana de Astronomia y Astrofisica Conference Series, 35–36
- Sopka et al. (1982) Sopka, R. J., Herbig, G., Michalitsianos, A. G., & Kafatos, M. 1982, ApJ, 258, L35
- Stark et al. (1992) Stark, A. A., Gammie, C. F., Wilson, R. W., Bally, J., Linke, R. A., Heiles, C., & Hurwitz, M. 1992, ApJS, 79, 77
- Taylor et al. (1986) Taylor, A. R., Seaquist, E. R., & Mattei, J. A. 1986, Nature, 319, 38
- van Leeuwen et al. (1997) van Leeuwen, F., Feast, M. W., Whitelock, P. A., & Yudin, B. 1997, MNRAS, 287, 955
- Wallerstein (1986) Wallerstein, G. 1986, A&A, 163, 337
- Wallerstein & Greenstein (1980) Wallerstein, G. & Greenstein, J. L. 1980, PASP, 92, 275
- Willson et al. (1981) Willson, L. A., Garnavich, P., & Mattei, J. A. 1981, Informational Bulletin on Variable Stars, 1961, 1
| Fit Parametersa,ba,bfootnotemark: | ||
|---|---|---|
| Quantity | 2000.7 | 2004.0 |
| Total Counts | 83 | 195 |
| Absorption 1 (nH 1022cm-3) | 0.0185 [frozen] | 0.0185 [frozen] |
| Powerlaw Photon Index | 2.6 [frozen] | 2.6 [2.0,3.2] |
| Powerlaw Normalization (10-6 ph cm-2 s-1) | 1.9 [1.4, 2.4] | 1.4 [0.98, 1.8] |
| Absorption 2 (nH 1022cm-3) | 35[frozen] | 35 [28, 45] |
| Apec temperature (keV) | 6.8 [frozen] | 6.8 [4.2, 10.8] |
| Apec normalization (10-6 ph cm-2 s-1) | 230. [155., 310.] | 530. [360., 800.] |
| Fe K Gaussian line energy (keV) | 6.43 [frozen] | 6.43[6.41, 6.46] |
| Fe K Gaussian sigma (keV) | 0. [frozen] | 0.0 [frozen] |
| Fe K Gaussian normalization (10-6 ph cm-2 s-1 ) | 3.0 [1.1, 5.9] | 9.6 [6.7,13.0] |
| C statistic | 20.48 | 118.94 |
| (24 PHA bins, | (121 PHA bins, | |
| 21 deg of freedom) | 104 deg of freedom) | |
| Goodness of fit | 21.25% realizations | 22.05% realizations |
| best fit stat 20.48 | best fit stat 118.94 | |
| Unabsorbed Source Flux (10-15 erg cm-2 s-1) | 88 [63,126] | 210 [140,320] |
| 0.3–8 keV | ||