Small-scale dissipative structures of diffuse ISM turbulence: I – CO diagnostics
Abstract
Observations of translucent molecular gas in 12CO and 13CO emission lines, at high spectral and spatial resolutions, evidence different kinds of structures at small scales: (1) optically thin 12CO emission, (2) optically thick 12CO emission, visible in 13CO(1-0), and (3) regions of largest velocity shear in the field, found from a statistical analysis. They are all elongated with high aspect ratio, preferentially aligned with the plane-of-the-sky projection of the magnetic fields. The latter structures coincide with the former, shown to trace gas warmer and more diluted than average. Combining our data to large-scale observations of poorer spatial resolution, we show that the regions of largest velocity shear remain coherent over more than a parsec. These filaments are proposed to be the sites of the intermittent dissipation of turbulence.
IRAM, 300 rue de la Piscine F-38406 Saint-Martin d’Hères
École normale supérieure & Observatoire de Paris, LERMA/LRA, 24 rue Lhomond, F-75231 Paris Cedex 5
1. Introduction
Star formation proceeds by condensating gas. While the steps from dense cores to hydrogen burning stars are basically identified, what triggers the building of these condensation seeds remains largely unknown.
Turbulence in the cold neutral medium is driven at large scale by the warm neutral flow. Dense cores thus form in a turbulent molecular gas with typical linewidth km s-1. The role of magnetic fields during their formation is still a matter of strong debate (Crutcher 1999; Padoan et al. 2001). Observations of molecular lines show that the condensation proceeds at the expense of the turbulent support, as traced by the linewidth, and that some turbulent dissipation must take place in the molecular gas. Turbulence is dissipated at small scales by viscosity. But how small is this dissipation scale ? Small-scale structures have been observed in the ionized and atomic gas down to few AUs, direct observations of molecular small scale structures are less common. Direct evidence of small-scale molecular structures include Pan et al. (2001) ( AU with density 1000 to 5000 cm-3) and Heithausen (2002, 2006) (few hundreds AU and densities cm-3, this volume). Indirect evidence of such small scale structures (200 AU) were inferred from translucent gas observations by Falgarone & Phillips (1996); Falgarone et al. (1998).
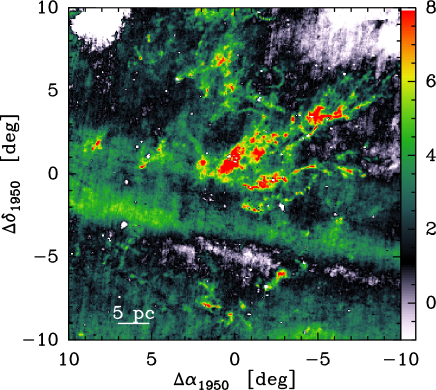
Fig. 1 shows the 100m emission of cold dust in the Taurus molecular cloud, computed following Abergel et al. (1994). Many small filaments, often associated with known Lynds objects, are seen. Our work focusses on regions in the vicinity of these filaments, characterized by a low visual extinction, ( mag) and 100m intensities MJy/sr, to disclose their formation mechanism, and their link to dense core formation. Our large maps, with high spectral resolution ( or 0.055 km s-1 at 115 GHz), extended the dataset of Falgarone et al. (1998) and allow to perform statistical analysis of the velocity field to relate the small-scale structures to turbulence.
2. Diffuse molecular gas at small scales
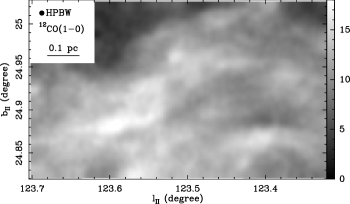
Fig. 2 (top) shows maps of the integrated 12CO and 13CO(1-0) emissions towards the Polaris Flare (Falgarone et al. 1998; Hily-Blant & Falgarone 2006), done with the IRAM-30m telescope. The 13CO emission is distributed along a main structure with a position angle P.A. degrees. This structure is connected to a dense core, visible at the eastern edge of the map (Gerin et al. 1997; Heithausen 2002). There are areas and velocity intervals in the field where only 12CO is detected and the 12CO over 13CO(1-0) line ratio is greater than 30. These intervals are called line-wings. The following work is devoted mainly to the physical properties, kinematics and dynamics of the emission in these line-wings.
2.1. Small-scale optically thin 12CO filaments
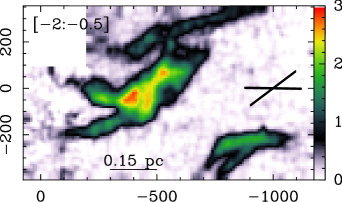
Fig.2 (bottom) shows the 12CO(1-0) emission in the wing intervals ( and km s-1). Small elongated structures with typical transverse size 0.04 pc and velocity width 0.35 km s-1 are seen, and with aspect ratio as high as 10. While the upper structure () is also seen in 13CO at other velocities, all the others are not detected in any channel in 13CO. LVG analysis using 12CO(1-0) and (2-1), combined with an upper limit on the H2 column density provided by the visual extinction (Cambrésy 1999), shows that these filaments have kinetic temperatures greater than 20 K and densities smaller than cm-3. They have a well defined column density and 12CO(1-0) opacity . Compared to the material detected in 13CO ( K and ), these 12CO-filaments are thus warmer and more tenuous.
2.2. Magnetic fields
The analysis of the structure in the 12CO and 13CO with automatic procedures (Stutzki & Güsten 1990) shows that the emission from both isotopologues arise in elongated filamentary structures, whose orientation is not random. The distribution of their position angle is peaked around P.A.=∘. Interestingly, the plane of the sky projection of the magnetic fields orientation, measured 4 pc North, has P.A.=∘ (Heiles 2000).
3. Dissipative structures of interstellar turbulence
An attested deviation to the early Kolmogorov’s turbulence theory is the fact that dissipation is intermittent, in space and time: the fraction of the volume and the timescale over which dissipation is active decreases with spatial scales (Landau & Lifchitz 1959; Kolmogorov 1962; Frisch 1995). While the turbulent velocity follows a Gaussian distribution, intermittency makes its increments over a distance to depart from a Gaussian: tails show up because large increments are more numerous than in a Gaussian distribution. This non-Gaussianity is more pronounced when decreasing . As a consequence of intermittency, the velocity shear () reaches large values at small scale, that manifest themselves as bursts of viscous dissipation (, with the fluid velocity). These violent events are associated to the non-Gaussian tails of the distribution of the velocity shear.
3.1. Intermittency in the interstellar molecular gas
Interstellar turbulence can only be partially probed: we measure the gas velocity projected along the line of sight (LOS) and the position projected in the plane of the sky (POS). All observables are LOS integrals: they result from a complex combination of radiative transfer in lines, chemistry, density and velocity structures of the gas. Lis et al. (1996) have shown that in the case of optically thin lines, the increments of line centroid velocities (CVIs) measured between two different LOS trace a quantity related to the LOS average of the POS projection of the velocity shears. It is therefore possible, from the CVIs statistics computed in a map of spectra, to approach that of the velocity shear, and find the subset of space where the departures from a Gaussian distribution occur.
We have computed maps of CVIs for different lags, in the 12CO(1-0) data, following Pety & Falgarone (2003). Fig. 3 (left) shows their probability density function for two lags pixels (the largest lag with a significant number of pairs of points) and pixels (the smallest between independent points). The distribution (blue) is very close to a Gaussian (deviations are due to large scale gradients). However, the pixel one (red) has non-Gaussian wings that show up for large velocity increments. We show below and in Falgarone et al. (this volume) why these wings may be ascribed to the space-time intermittency of turbulence dissipation.
3.2. Filaments of extreme velocity shear
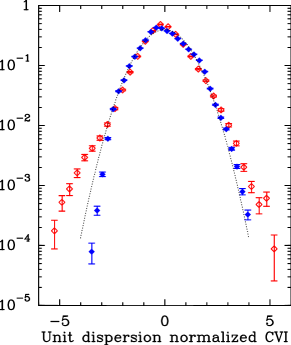
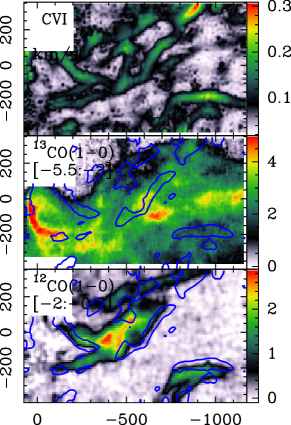
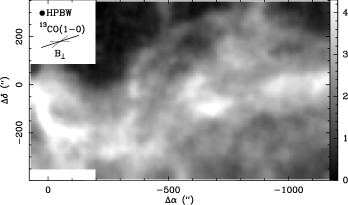
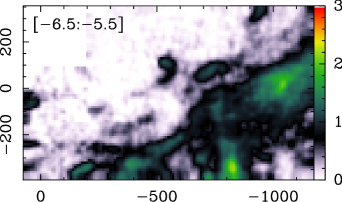
Fig. 3 shows the map of CVIs, computed for a 3-pixel lag, on the 12CO(1-0) data (top right panel). The largest CVIs, those points populating the wings in the PDF (left), form elongated structures of aspect ratio as high as 10. These structures are poorly correlated with the 13CO emission (middle right panel). On the contrary, their spatial correlation with the optically thin 12CO emission (bottom right panel) is striking. The sites of largest velocity shear are therefore associated with gas warmer than average (see Sect. 2.1).
3.3. Coherence from small to large scales
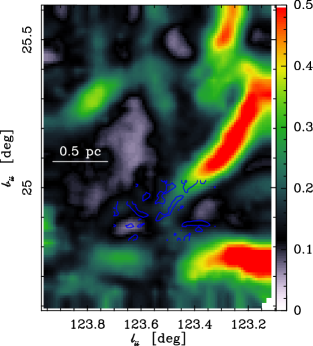
We applied the same procedure to large scale data obtained with coarser spatial resolution (Bensch et al. 2001). The resulting CVIs (Fig. 4) computed for a small lag (3 pixels) again show filaments, extending over 1 parsec or more. Interestingly, the longest shear-filament extends the small one found in the 30m data set. The south-western filament at large scale might also be connected to the small one found in our maps. It is however not possible to ascertain whether these large scale shear filaments also correspond to warm and tenuous molecular gas.
These two datasets, treated in similar ways, show that the regions of largest velocity shear are high-aspect ratio () filaments coherent over the parsec scale , despite the fact that the molecular flow is turbulent.
4. Discussion and summary
The computation of the CVIs, at both small and large scales, show that i) the PDF of CVI is not Gaussian for small lags, a possible signature of intermittency, ii) the points populating the non-Gaussian wings of the PDF are distributed into filaments, iii) these filaments are associated with gas warmer and more tenuous than the bulk of molecular gas, and iv) these filaments remain coherent over more than 1 pc. In this particular field, we also found that the filaments are preferentially aligned along the direction of the magnetic fields. This suggests that magnetic fields may be strong enough to imprint their configuration on the gas structure.
The spatial correlation between the warm optically thin 12CO(1-0) filaments and the regions of large velocity shear suggests that these structures are sites of burst of viscous dissipation which may be the dominant heating source. Further non-equilibrium chemical modelling of HCO+(1-0) observations in these structures does indeed stress the importance of viscous and ion-neutral–drift heating (see Falgarone et al, this conference).
References
- Abergel et al. (1994) Abergel, A., Boulanger, F., Mizuno, A., & Fukui, Y. 1994, ApJ, 423, L59
- Bensch et al. (2001) Bensch, F., Stutzki, J., & Ossenkopf, V. 2001, A&A, 366, 636
- Cambrésy (1999) Cambrésy, L. 1999, A&A, 345, 965
- Crutcher (1999) Crutcher, R. M. 1999, ApJ, 520, 706
- Falgarone et al. (1998) Falgarone, E., Panis, J.-F., Heithausen, A., et al. 1998, A&A, 331, 669
- Falgarone & Phillips (1996) Falgarone, E. & Phillips, T. G. 1996, ApJ, 472, 191
- Frisch (1995) Frisch, U. 1995, Turbulence. The legacy of A.N. Kolmogorov (Cambridge Univ. Press)
- Gerin et al. (1997) Gerin, M., Falgarone, E., Joulain, K., et al. 1997, A&A, 318, 579
- Heiles (2000) Heiles, C. 2000, AJ, 119, 923
- Heithausen (2002) Heithausen, A. 2002, A&A, 393, L41
- Heithausen (2006) Heithausen, A. 2006, A&A, 450, 193
- Hily-Blant & Falgarone (2006) Hily-Blant, P. & Falgarone, E. 2006, accepted by A&A
- Kolmogorov (1962) Kolmogorov, A.N. 1962 JFM 13, 82
- Landau & Lifchitz (1959) Landau L.D. & Lifchitz E.M. 1959, Fluid Mechanics, Addison-Wesley
- Lis et al. (1996) Lis, D. C., Pety, J., Phillips, T. G., & Falgarone, E. 1996, ApJ, 463, 623
- Miville-Deschênes & Lagache (2005) Miville-Deschênes, M.-A. & Lagache, G. 2005, ApJS, 157, 302
- Padoan et al. (2001) Padoan, P., Juvela, M., Goodman, A. A., & Nordlund, Å. 2001, ApJ, 553, 227
- Pan et al. (2001) Pan, K., Federman, S. R., & Welty, D. E. 2001, ApJ, 558, L105
- Pety & Falgarone (2003) Pety, J. & Falgarone, E. 2003, A&A, 412, 417
- Stutzki & Güsten (1990) Stutzki, J. & Güsten, R. 1990, ApJ, 356, 513