Spectroscopic monitoring of the BL Lac object AO 0235+164 ††thanks: Based on observations collected at the European Southern Observatory, Chile (ESO Programme 71.A-0174), and on observations made with the Italian Telescopio Nazionale Galileo (TNG) operated on the island of La Palma by the Fundación Galileo Galilei of the INAF (Istituto Nazionale di Astrofisica) at the Spanish Observatorio del Roque de los Muchachos of the Instituto de Astrofisica de Canarias
Abstract
Aims. Spectroscopic monitoring of BL Lac objects is a difficult task that nonetheless can provide important information on the different components of the active galactic nucleus.
Methods. We performed optical spectroscopic monitoring of the BL Lac object AO 0235+164 () with the VLT and TNG telescopes from Aug. 2003 to Dec. 2004, during an extended WEBT campaign. The flux of this source is both contaminated and absorbed by a foreground galactic system at , the stars of which can act as gravitational micro-lenses.
Results. In this period the object was in an optically faint, though variable state, and a broad Mg ii emission line was visible at all epochs. The spectroscopic analysis reveals an overall variation in the Mg ii line flux of a factor 1.9, while the corresponding continuum flux density changed by a factor 4.3. Most likely, the photoionising radiation can be identified with the emission component that was earlier recognised to be present as a UV–soft-X-ray bump in the source spectral energy distribution and that is visible in the optical domain only in very faint optical states. We estimate an upper limit to the broad line region (BLR) size of a few light months from the historical minimum brightness level; from this we infer the maximum amplification of the Mg ii line predicted by the microlensing scenario.
Conclusions. Unless we have strongly overestimated the size of the BLR, only very massive stars could significantly magnify the broad Mg ii emission line, but the time scale of variations due to these (rare) events would be of several years. In contrast, the continuum flux, coming from much smaller emission regions in the jet, could be affected by microlensing from the more plausible MACHO deflectors, with variability time scales of the order of some months.
Key Words.:
galaxies: active – galaxies: BL Lacertae objects: general – galaxies: BL Lacertae objects: individual: AO 0235+164 – galaxies: jets – galaxies: quasars: general1 Introduction
The active galactic nuclei (AGNs) known as BL Lac objects show extreme variability at all wavelengths from the radio band to the -rays. The commonly accepted paradigm foresees that their non-thermal emission comes from a relativistic plasma jet pointing towards the observer with a small viewing angle (Blandford & Rees, 1978). The consequent relativistic Doppler effect would be responsible for flux enhancement and contraction of the intrinsic variability time scales.
These objects by definition show no emission lines or only weak ones, with equivalent widths not exceeding 5 Å in the rest frame (Stickel et al., 1991). However, stronger emission lines, in particular broad ones, have occasionally been detected in the spectra of a few BL Lacs (e.g. AO 0235+164, Cohen et al. 1987; Nilsson et al. 1996; BL Lacertae itself, Vermeulen et al. 1995; Corbett et al. 1996, 2000) in optically faint states, thereby putting their classification into question.
Those broad emission lines recognisable in the spectra of AGN are produced in the so-called “broad line region” (BLR), which is believed to be photoionised by thermal radiation from the accretion disc. In the case of BL Lac objects, the possibility that photoionisation can be due to the beamed radiation from the jet is still under debate (Corbett et al., 2000).
Because of the dramatic flux variability and absence of strong lines, Ostriker & Vietri (1985) suggested microlensing as a possible explanation of the BL Lac phenomenon. According to this interpretation, the moving stars of a galaxy on the line of sight would act as gravitational microlenses, producing amplification and the consequent variation in the flux emitted from a compact underlying source. A microlensing-induced flare would be observed simultaneously at different wavelengths with time scales that depend on the size of the regions emitting at the various frequencies. On the contrary, no amplification of the lines is expected, if the size of the BLR is of the order of 0.1–1 pc, as classically assumed. Actually, it was found that the BLR size scales with the continuum luminosity and that for some objects it can be rather compact, of the order of some light days–weeks (Wandel et al., 1999; Kaspi et al., 2000). In this case, microlensing would also produce noticeable variations in the emission line strengths and profiles (Abajas et al., 2002). One would thus observe these changes at the same time as the continuum ones and would find that the line flux correlates with the continuum flux. It is worth mentioning that the observed difference between continuum and broad emission line flux ratios of lensed quasar images has been interpreted as due to microlensing, leading to an estimate of the BLR size down to 9 light days (Metcalf et al., 2004; Wayth et al., 2005; Keeton et al., 2006).
In this context, the BL Lac object AO 0235+164 at is very interesting. It is well known for its strong flux variability at all wavelengths. In the optical band it has shown brightness variations up to mag in 6 months, while radio flux changes up to a factor in less than 1 year have been observed. In some cases simultaneous optical and radio outbursts were observed (Balonek & Dent, 1980; Webb et al., 2000; Raiteri et al., 2001), with a possible quasi-periodicity of the major radio (and optical) events (Raiteri et al., 2001).
Some observational evidence can be reconciled with the intrinsic variability scenario for this source only if very extreme relativistic conditions are assumed: Doppler factors up to have been estimated in several papers (Fujisawa et al., 1999; Kraus et al., 1999; Frey et al., 2000; Jorstad et al., 2001). Interstellar scattering would be a viable extrinsic explanation for the intraday radio variability, at least in some cases, but it cannot explain variability at the higher frequencies. The alternative extrinsic scenario, invoking microlensing, appears attractive, since optical imaging and spectroscopic observations have revealed foreground absorbing systems at and (see e.g. Cohen et al., 1987; Nilsson et al., 1996). Absorption in excess of Galactic absorption is indeed required to fit the X-ray spectra of this source (see e.g. Madejski et al., 1996; Junkkarinen et al., 2004; Raiteri et al., 2006b). The environment of AO 0235+164 is rather complex (see Fig. 1): the absorber is probably an elliptical galaxy lying 13 to the east111Following the notation by Nilsson et al. 1996, it was indicated as G1 in the figure, but it is not discernible from the source., which is very likely interacting with a Seyfert galaxy 2″ south of the source (G2). This southern AGN, named ELISA by Raiteri et al. (2005), can noticeably affect the source photometry during faint states, especially in the blue part of the optical spectrum. The four galaxies G1–G4 belong to the same group (Stickel et al., 1993), which might include other close objects with still unknown redshifts.
The possibility that microlensing affects the AO 0235+164 emission was the subject of a number of works in the past (Kayser, 1988; Stickel et al., 1988; Saust, 1992; Abraham et al., 1993; Kraus et al., 1999; Webb et al., 2000), which each faced the problem with different techniques (mainly imaging and multiwavelength photometric monitoring). The results of these studies are contradictory. According to Stickel et al. (1988), the presence of a foreground eastern galaxy very close to the line of sight, the fact that Cohen et al. (1987) observed that only mild line flux variations correspond to strong continuum-flux density changes, and the observation by Balonek & Dent (1980) of contemporaneous optical and radio outbursts, all support a microlensing origin of the violent variability of this source. Also the new VLBI components emitted after outbursts are interpreted as images of the lensed core of the source. In contrast, Kayser (1988) showed how the microlensing scenario is very unlikely on the basis of several observational data. In particular, he calculated that the separation of the new VLBI components from the core would imply a non-stellar deflector mass of . According to Abraham et al. (1993), microlensing does not appear to be a likely explanation for the source properties, while Kraus et al. (1999) claimed that it can account for the peculiar variations they observed at three radio frequencies and in the optical band during a three-week campaign in 1992. Finally, Webb et al. (2000) suggested that the events in 1975 and 1997, which were characterised by simultaneous optical and radio outbursts, might be ascribed to microlensing, while others are more likely due to intrinsic causes.
Actually, a careful inspection of the historical optical and radio light curves (Raiteri et al., 2006a) reveals that simultaneity, as well as symmetry of events, are features difficult to verify, either because of poor sampling (especially lack of optical data on long time intervals due to solar conjunctions), or due to the possible overlap of different events. Even for the best-sampled outburst in 1997–1998, we can only say that there was a strong flux increase in both the optical and radio bands, but the details of the outburst (exact time of the peak and shape at the various frequencies) largely remain unknown.
Investigation of the microlensing scenario through a comparison between line and continuum flux variations was performed by Saust (1992), who observed AO 0235+164 in both the band and a narrow-band filter centred on the Mg ii line. He found that the emission-line variability was comparable to the continuum one and that it was stronger than expected from microlensing. This conclusion, however, was based on the models of Nemiroff (1988), which assumed large BLR sizes. More recently, Abajas et al. (2002) has shown that the global amplification of broad emission lines induced by microlensing events could be noticeable, if the BLR has a size of a few light days, as found by Wandel et al. (1999) and Kaspi et al. (2000) for several AGNs.
In this paper we present an analysis of AO 0235+164 optical spectra taken with the VLT and TNG telescopes in 2003–2004, when the source was in a faint state. In this period, a huge multiwavelength observing effort was carried out by the Whole Earth Blazar Telescope (WEBT)222http://www.to.astro.it/blazars/webt/ (see e.g. Villata et al., 2004b, a, 2006) collaboration to continuously monitor the source emission variability in the optical and radio bands. Furthermore, three pointings of the XMM-Newton satellite provided information in the X-ray and UV bands, allowing us to construct the broad-band spectral energy distributions (SEDs) with simultaneous data (Raiteri et al., 2005, 2006b, 2006a). The analysis of multiepoch SEDs suggested the existence of an extra component besides the low-energy synchrotron one and the high-energy inverse-Compton one. This extra component, peaking in the far-UV–soft-X-ray domain, can be explained in terms of an additional synchrotron component coming from an inner part of the jet with respect to that emitting the observed radio-to-optical radiation. However, the hypothesis of a thermal component coming from an accretion disc cannot be ruled out, particularly because of the possible detection of a strongly redshifted Fe K line in some of the X-ray spectra, which should be produced in the inner part of the disc, as discussed by Raiteri et al. (2006b).
| Telescope | Instrument | Date | Seeing [″] | Exp. [s] |
|---|---|---|---|---|
| VLT4 | FORS2, grism 300V | Aug. 28, 2003 | 0.8 | 900 |
| TNG | DOLORES, grism LR-B | Nov. 15, 2003 | 1.3 | 1800 |
| TNG | DOLORES, grism LR-B | Jan. 17, 2004 | 1.3 | 1800 |
| TNG | DOLORES, grism LR-B | Oct. 5, 2004 | 1.2 | 3600 |
| TNG | DOLORES, grism LR-B | Dec. 6, 2004 | 1.4 | 3600 |
2 Observations and data reduction
Optical spectra were taken in the period August 2003 – December 2004 at the 8 m diameter Very Large Telescope (VLT) and in service mode at the 3.6 m Telescopio Nazionale Galileo (TNG). The logbook of the observations is shown in Table LABEL:log, where Column 1 reports the telescope, Column 2 the instrument, Column 3 the observing date, Column 4 the value of seeing derived from the acquisition frame(s), and Column 4 the total integration time. This was obtained in one exposure at VLT, while three subsequent exposures were acquired at TNG, in order to be able to get rid of cosmic rays by combining the images.
All spectra were obtained with a 1″ slit aligned along the north-south direction, so that the light of both the source and ELISA entered the spectrograph.
The data reduction was carried out with the IRAF333IRAF is distributed by the National Optical Astronomy Observatories operated by the Association of Universities for Research in Astronomy, Inc. under cooperative agreement with the National Science Foundation package, following a standard procedure. Spectra were bias-subtracted and corrected with dome flat-field frames. Arc-lamp exposures were used for wavelength calibration; two-dimensional mapping of pixels into wavelengths was derived by running the routines identify, reidentify, and fitcoords, which allows correction for geometrical distortions. Wavelength-calibrated source spectra were then obtained with the transform routine. Sky-subtracted, one-dimensional source spectra were extracted with apall. A small aperture was used in order to avoid the inclusion of ELISA. From the VLT frame we could also extract the ELISA spectrum.
Spectra of spectrophotometric standard stars were used for flux calibration, which was performed with the routines standard, sensfunc, and calibrate.
We checked the correctness of flux calibration using field photometry. Indeed, for all observations, acquisition frames in at least the band were taken, so that differential photometry was performed with the routine phot with respect to comparison stars in the same field of the source. The high space resolution (025 per pixel at VLT and 0275 per pixel at TNG), together with the relatively small seeing values (see Table LABEL:log), allowed us to avoid the inclusion of the ELISA contribution by using an aperture radius of about 1″. This is an important point, since ELISA can significantly affect the photometry of AO 0235+164, especially when the source is in a faint state (see e.g. Raiteri et al., 2005). For the magnitude calibration, we used the photometric sequences by Smith et al. (1985) and Fiorucci et al. (1998); the values of the source magnitude obtained with respect to the brighest, non-saturated comparison stars were averaged, and the uncertainty reported in Table 4 takes into account both the standard deviation of these values from the mean and the instrumental error.
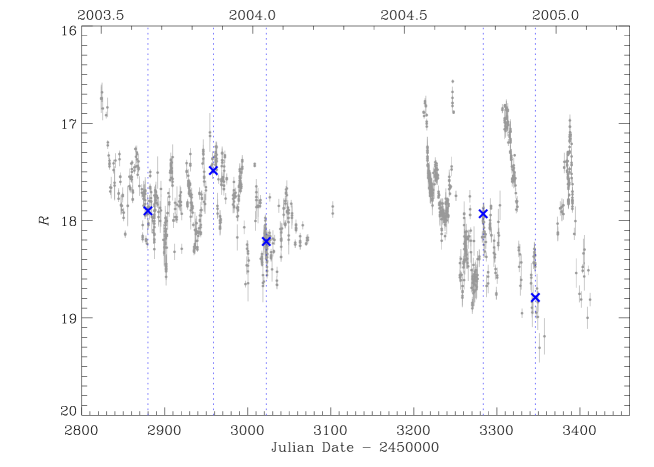
The results of the photometric measures are reported in Table LABEL:res. As one can see, the source was always found in faint states, but at different levels, ranging from on November 15, 2003, to on December 6, 2004. Figure 2 shows the -band light curve of AO 0235+164 obtained during the 2003–2005 WEBT campaign (adapted from Raiteri et al. 2006a).
To check the correctness of the spectroscopic flux calibration, we transformed the -band magnitudes into flux densities and compared them with the spectroscopic continua around 6410 Å. In order to verify that this procedure also leads to a good calibration around the Mg ii line, we derived -band magnitudes either from -band frames, when available, or though the mean colour index estimated by Raiteri et al. (2005), obtaining flux densities at Å. In a couple of cases, frames in other bands were also available, allowing for a more detailed comparison between spectroscopic and photometric results.
2.1 VLT spectra
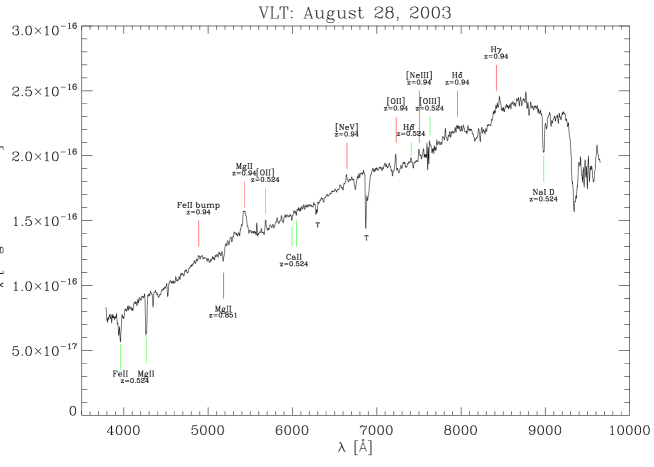
The VLT data were acquired on August 28, 2003 under photometric conditions with sub-arcsecond seeing. Grism 300V was used, with 11 Å dispersion and 5900 Å central wavelength. The CCD scale was 025 per pixel, so that the spectrum of ELISA, the southern AGN located 2″ south, is well-resolved from the source one. Flux calibration was performed with the spectroscopic standard star LTT 1020, which was also used to remove the prominent telluric absorption feature at 7550–7700 Å.
| Line | Flux | FWHM | ||
|---|---|---|---|---|
| [Å] | [] | [] | ||
| 2800 Mg ii | 5431 | 0.940 | 14 | 3500 |
| 3426 [Ne v] | 6640 | 0.938 | 1.2 | 700 |
| 3727 [O ii] | 7225 | 0.939 | 2 | 600 |
| 3869 [Ne iii] | 7503 | 0.939 | 2 | 700 |
| 4102 H | 7958 | 0.940 | 4 | 3200 |
| 4340 H | 8439 | 0.944 | 9 | 3200 |
| 3727 [O ii] | 5682 | 0.524 | 1.3 | 800 |
| 4861 H | 7407 | 0.524 | 1.8 | 900 |
| 5007 [O iii] | 7631 | 0.524 | 1.8 | 900 |
Figure 3 shows the calibrated source spectrum, where the continuum is traced well from about 3800 Å to about 9200 Å. The spectrum shows a number of clear emission features at both and (see Table LABEL:emission). In particular, we can distinguish a broad Mg ii emission line at Å, together with other narrow lines emitted from the source: [Ne v], [O ii], Ne iii, while the identification of the H and H lines appears more uncertain. The full width half maximum (FWHM) of the Mg ii emission line is , a bit larger than the value of 3100 found by Cohen et al. (1987); on the other hand, the 3200 velocities we found for the H and H lines are smaller but consistent with those measured by Nilsson et al. (1996).
The emission lines of [O ii] and H at belong to the foreground galaxy located at about 13 east of the source. Two pronounced features, probably due to Fe ii and Mg ii absorption from the same galaxy at are evident on the red side of the spectrum, while on the blue side one can recognise Na i D absorption at . Moreover, the absorption feature at 5183 Å was already ascribed by Cohen et al. (1987) to Mg ii at .
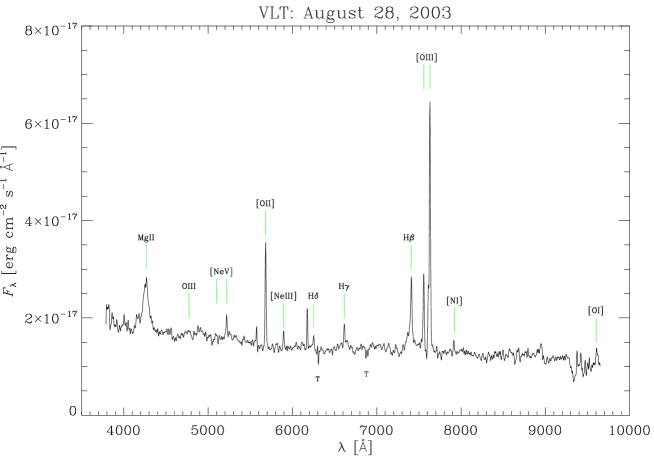
The spectrum of ELISA is shown in Fig. 4. Both broad and narrow emission lines are clearly recognisable. In particular, one can see the H and [O iii] lines already noticed by Cohen et al. (1987) and by Nilsson et al. (1996). The latter authors also identified the H line.
All the other features highlighted in Fig. 4 are reported for the first time here; the strong broad Mg ii and the narrow [O ii] lines are the most striking features. Table LABEL:elisa summarises the identified emission lines in the ELISA spectrum, together with the derived flux. A double Gaussian fit to the H line to measure both the narrow and the broad components yields results in agreement with those derived by Nilsson et al. (1996). We notice that the FWHM of [O ii] and 5007 [O iii] measured by Cohen et al. (1987) were 300 and 250 , respectively, and the FWHM of the [O iii] lines measured by Nilsson et al. (1996) were 400 , somewhat smaller than the ones derived from our spectrum.
| Line | Flux | FWHM | |
|---|---|---|---|
| [Å] | [] | [] | |
| 2800 Mg ii | 4260 | 80 | 4000 |
| 3426 [Ne v] | 5220 | 12 | 800 |
| 3727 [O ii] | 5682 | 35 | 800 |
| 3869 [Ne iii] | 5895 | 5 | 800 |
| 4102 H | 6252 | 5 | - |
| 4340 H | 6615 | 8 | - |
| 4861 H n | 7410 | 15 | 700 |
| 4861 H b | 7410 | 25 | 3000 |
| 4959 [O iii] | 7556 | 25 | 700 |
| 5007 [O iii] | 7630 | 80 | 700 |
| 5199 [N i] | 7915 | 4 | 600 |
| 6300 [O i] | 9606 | 7 | 700 |
| Observation | Mg ii EW | Mg ii Flux | Cont. Flux Density | FWHM | |
|---|---|---|---|---|---|
| [mag] | [Å] | [] | [] | [] | |
| VLT, Aug. 28, 2003 | 3500 | ||||
| TNG, Nov. 15, 2003 | 3300 | ||||
| TNG, Jan. 17, 2004 | 3300 | ||||
| TNG, Oct. 5, 2004 | 3100 | ||||
| TNG, Dec. 6, 2004 | 3400 |
2.2 TNG spectra
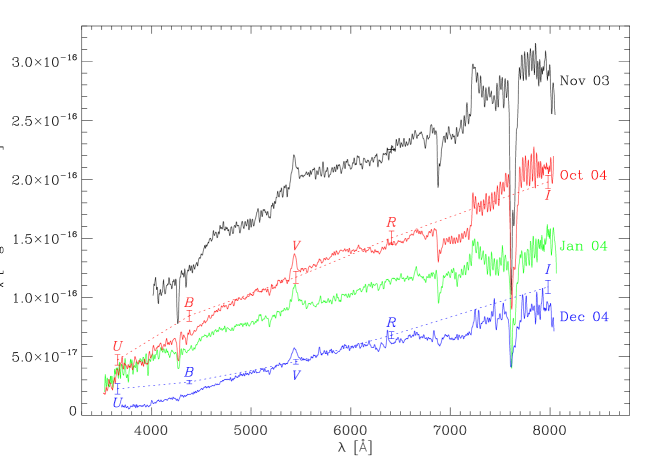
The TNG spectra were obtained with DOLORES and grism LR-B. The resolution is 11 Å. The scale of DOLORES is 0275 per pixel, so that the source and ELISA spectra are resolved also in the TNG frames. However, the ELISA spectrum cannot be extracted because of the low S/N ratio. The total integration time (reported in Table LABEL:log) of each observation was obtained with three subsequent exposures. The three corresponding spectra were reduced and calibrated separately, and then summed up in order to increase the S/N ratio. The measurements of the Mg ii equivalent width (EW) and flux were performed on each single exposure; the values reported in Table LABEL:res are the average values obtained over the exposures, and the uncertainty corresponds to the standard deviation. These mean values are in fair agreement with those obtained by measuring these quantities directly on the summed spectra. The final summed TNG spectra are shown in Fig. 5.
Sky subtraction on October 5 and December 6, 2004 was poor because of CCD charge-dragging problems. In these two epochs a complete sequence of images was taken, so that it was possible to check the flux calibration at different wavelengths in order to be sure that the flux around the Mg ii line was correct.
Figure 5 also shows flux densities derived from photometry for these last two epochs. One can notice the deviation from a linear trend in the bluer part of the spectrum. This deviation is also confirmed by the shape of the spectroscopic continuum, even though the photometric data on December 6 give a higher flux density in and bands than do the spectroscopic data. In any case, the data suggest a blue excess on December 6, when the source was in the faintest state. This excess would be amplified when correcting for both Galactic and foreground galaxy absorption, and is likely to be the signature of the low-energy tail of the extra component suggested by Raiteri et al. (2005, 2006b, 2006a), which has already been mentioned in the introduction.
3 Ionising source
Table LABEL:res summarises the results of the spectroscopic analysis on the Mg ii line. For each spectrum it reports: the -band magnitude, the Mg ii line equivalent width and flux, the corresponding continuum flux density, and the line FWHM. One can see that the continuum flux density varied by a factor 4.3, while the Mg ii flux changed by a factor 1.9. The results are also presented in Fig. 6, which shows the Mg ii flux as a function of the continuum flux density, the Mg ii equivalent width as a function of the continuum flux density, and the Mg ii equivalent width versus the -band magnitude. The values obtained by Cohen et al. (1987) are also shown for a comparison.
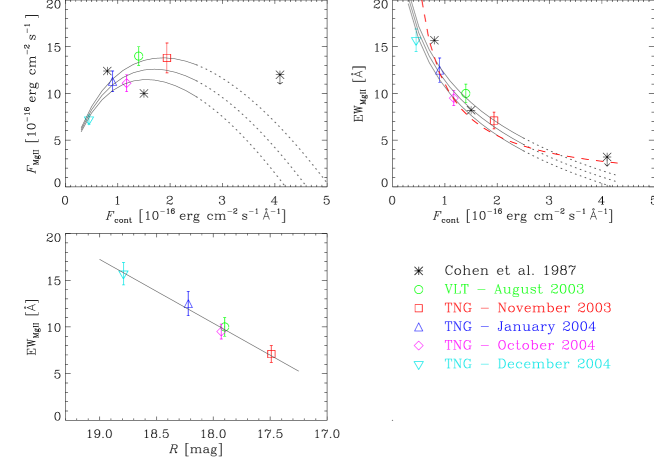
The main result, confirming the Cohen et al. (1987) claim, is that the Mg ii flux is variable. However, its relationship with the continuum flux density, if any, is not simple. The Mg ii equivalent width seems to depend linearly on the -band magnitude; the grey lines in the various panels represent this linear relationship: , with best-fit values and . The -band magnitude has been converted into the continuum flux density around the Mg ii line, i.e. in the band, through the index. The three lines in the first and second panels correspond to the average colour index and to deviations from it according to Raiteri et al. (2005): . For a comparison, in the second panel we also plotted the case where the Mg ii line flux is assumed to be constant () and equal to its average value (; red dashed line).
From Fig. 6 one may infer that the line flux increases with the continuum flux density until a certain brightness level, after which it cannot grow further and may even decrease. We notice that this first increasing trend depends on just one point, but further observations would be required to confirm it.
Corbett et al. (2000) discussed the possible BLR photoionisation source in BL Lacertae. They analysed eight optical spectra taken in 1995–1997 and measured the H broad emission line. The behaviour of its equivalent width as a function of the continuum flux density was well-fitted by an law. The interpretation of this lack of response by the line strength to the continuum variations in terms of photoionisation by Doppler-boosted synchrotron continuum requires a high covering fraction of about 35%. Although this scenario cannot be ruled out, the authors favoured photoionisation by a second continuum source not observable in the optical band. In the case that it is a hot accretion disc, they estimated a temperature .
For AO 0235+164 this second continuum source can be identified with the UV–soft-X-ray bump in the SED discussed by Raiteri et al. (2006a, b). From a visual inspection of the SEDs corresponding to different epochs, one may infer that this component is variable, but its variations do not appear to be necessarily correlated with the optical ones.
Thus, for AO 0235+164 we can envisage two scenarios: i) the BLR is photoionised by the jet emission; the line flux grows with the continuum flux but only until a kind of saturation level is reached, perhaps corresponding to complete ionisation; ii) the photoionisation source is another component, producing the UV–soft-X-ray bump in the SED; it can be detected in the optical domain when the lower-energy synchrotron component is weak, i.e. during very faint optical states. In this case the line flux is independent of the continuum flux, since they have different origins, and that we see a weaker line in the faintest state is just by chance. This component can be either emission from a thermal disc or an additional synchrotron component coming from an inner part of the jet with respect to the one producing the radio–optical emission. The thermal-disc option may be supported by the possible detection of a strongly redshifted Fe K line in the source X-ray spectrum (Raiteri et al., 2006b).
Between these scenarios, we think that the second one, i.e. photoionisation by a different component with respect to what produces the optical continuum, is more likely, since there is observational evidence for its existence.
4 Size of the BLR
The size of the BLR in AGNs can be estimated with reverberation mapping techniques, but relationships have also been derived between the BLR size, , and the continuum luminosity (Wandel et al., 1999; Kaspi et al., 2000; McLure & Dunlop, 2004). In particular, McLure & Dunlop (2004) analysed the dependence of on the continuum luminosity at 3000 Å in the source rest frame for high redshift objects (). They found that
where the continuum is supposed to be the ionising radiation of the BLR and can be estimated around the Mg ii line.
As discussed in the previous section, the most plausible photoionisation source of the BLR in AO 0235+164 is an extra component, which is visible in the optical frequency range when the source is faint. Indeed, we recognised a sort of blue excess in the faintest spectrum we analysed (taken on December 6, 2004). Hence, if we consider the lowest state of AO 0235+164 ever observed, it is plausible that a substantial fraction of the continuum there comes from the ionising radiation.
The minimum brightness level of AO 0235+164 in the band was observed in July 1996: 444From the WEBT archive.. Simultaneous data in other bands are not available, but there are -band data the day before and the day after, indicating a decrease in the source brightness. Hence, we can assume that their average value, , is not far from the actual value at the time the -band datum was taken. In this case, one gets a colour index , which implies a rather flatter spectrum than usually found for this source. This can be an indication that the higher-energy component was dominant.
If we consider absorption by both the Galaxy and the foreground absorber at (1.473 mag in the band, see Raiteri et al. 2005), we can derive the corresponding de-reddened flux density at 5450 Å, . Then , where is the luminosity distance and the emitted wavelength. Assuming a flat cosmology with and , Mpc. As a result, . The McLure & Dunlop (2004) equation yields a best fit of light days, with a range of possible sizes between 56 and 291 light days.
4.1 Black hole mass
Recently, Liu et al. (2006) estimated the black hole mass for AO 0235+164 using several methods. In particular, they used the equation derived by McLure & Dunlop (2004) that applies the virial black hole mass estimate , where is the Keplerian velocity of the line-emitting gas. The result was a black hole mass of . We notice that Liu et al. (2006) derived the continuum flux from the Cohen et al. (1987) spectrum of October 1985, when the source was faint, but not at its minimum brightness level, and did not correct for Galactic and foreground galaxy absorption. But, chiefly, they implicitly assumed , which holds if the BLR gas has a disc-like geometry and if the angle between the line of sight and the disc axis is (see discussion in McLure & Dunlop 2004). This is an important point, since the black-hole mass depends on the squared gas velocity. But if the disc axis coincides with the jet axis, then the angle should be very small for the strongly beamed BL Lacs; for AO 0235+164 in particular Frey et al. (2006) estimated by analysing space VLBI maps during a faint state in 2001–2002. In this case, however, a disc-like geometry would imply that we should systematically see much narrower lines in blazars than in other AGNs (or that blazar black holes are systematically much bigger). Hence, the assumption of randomly-oriented orbits for the BLR gas appears more appropriate, introducing a factor into the -FWHM equation. For a BLR size of 136 light days and an , as derived in the previous sections, we then obtain a black hole mass of . On the other hand, with the less likely disc geometry and , being , we would obtain , even if it can be intended as an upper limit.
In conclusion, we stress that a black hole mass estimate based on this method suffers from many uncertainties, in particular those related to the unknown geometry of the BLR, so it should be considered with extreme caution.
5 Microlensing
To obtain significant amplification of the BLR by microlensing, its size should be comparable to the projected radius of the Einstein ring of the lens on the source plane , where
is the angular radius of the Einstein ring, the lens mass, and where , , and are the angular diameter distances to the source, to the deflector, and between the source and the deflector, respectively (Einstein, 1936).
With the cosmological assumptions mentioned in Sect. 4, , , and , so that the Einstein radius of a 1 star in the galaxy that microlenses emission from AO 0235+164 is about 1.2 as. By comparison, a 136 light-day BLR subtends an angle of about 14 as at the redshift of AO 0235+164. The resulting amplification is only about 1% (Abajas et al., 2002; Schneider et al., 1992) and if the size is 56 light days. Moreover, the event would last several years, since its duration is given by the time the lens takes to cross the projected radius of the Einstein ring on the lens plane: where is the transverse velocity of the star relative to the source-Earth line, whose typical value is of the order of (Kayser et al., 1986). Significant amplification would be obtained in the case of a massive deflector, but this is expected to be a rare event and would imply even longer time scales. Actually, the most likely microdeflectors in galaxies are thought to be massive compact halo objects (MACHOs) of subsolar mass.
Hence, unless we have strongly overestimated the size of the BLR, we can conclude that we do not expect to detect variations in the Mg ii broad emission line due to microlensing by a star. On the contrary, since the region emitting the continuum radiation can be significantly smaller than the BLR, the possibility remains that microlensing can affect the continuum flux. To have a typical 2–3 month timescale event with a factor 2–3 flux amplification, as observed during the big radio outbursts, we would need an deflector acting on the radiation emitted from a very compact region of light days555 We mention that, according to Gopal-Krishna & Subramanian (1991), very fast variability events can be explained as due to microlensing if the radiation source is a superluminal blob in the blazar jet. With this model, Romero et al. (1995) could explain the strong intraday radio variability of PKS 0537441 observed in 1993 with lens of –..
More complicated scenarios arise when the optical depth of microlensing increases, so that one cannot consider isolated stars, but rather their combined effect (see e.g. Kayser et al., 1986; Schneider & Weiss, 1987; Kayser et al., 1989; Torres et al., 2003). The investigation of these scenarios goes beyond the aim of this paper, but we note that in the case of high optical depth, microlensing produces a sort of flickering rather than distinct, big events. Moreover, also de-amplification is possible under particular conditions.
The fact that the foreground galaxy of AO 0235+164 is not closely aligned with the blazar implies that lens candidates belong to the outer, less populated regions of the galaxy and dark halo, where the lensing optical depth is lower.
6 Conclusions
We have analysed five optical spectra of the BL Lac object AO 0235+164 taken at the VLT and TNG in 2003–2004. The source was in a faint state, and a broad Mg ii emission line was clearly detected in all spectra. The flux of the line showed an overall variation by a factor 1.9, while the continuum flux density changed by a factor 4.3.
The observed Mg ii flux dependence on the continuum flux density may suggest that the line flux increases with source brightening but only until a certain saturation level, after which it may even decrease. A further observing effort should be undertaken in order to check this trend. More likely, the line flux is independent of the optical continuum, as found in the case of BL Lacertae (Corbett et al., 2000), and it instead depends on another component. This can be identified with the one producing the UV–soft-X-ray bump in the source SED.
In this case, the BLR-ionising continuum is most visible in the optical spectral range when the source is in its faintest optical state. From the historical -band minimum brightness, we thus estimated the size of the BLR by exploiting its dependence on the monochromatic luminosity at 3000 Å found by McLure & Dunlop (2004). The best-fit size is of the order of 4.5 light months, which has however to be taken as an upper limit.
We investigated the possibility of explaining the flux variations we observed in the framework of a microlensing event due to a star in the foreground galaxy at . Although significant amplification of the continuum flux can also be obtained by subsolar-mass MACHO-like stars because of the very compact emission region, the size of the BLR we derived cannot account for a factor-2 line amplification unless we consider microlensing by a very massive star. Apart from the low probability of encountering such an event, it would also imply variability time scales of the order of several years, in disagreement with the observations.
Acknowledgements.
We thank the referee, Neal Jackson, for useful comments and suggestions. This work was partly supported by the European Community’s Human Potential Programme under contract HPRN-CT-2002-00321 (ENIGMA).References
- Abajas et al. (2002) Abajas, C., Mediavilla, E., Muñoz, J. A., Popović, L. Č., & Oscoz, A. 2002, ApJ, 576, 640
- Abraham et al. (1993) Abraham, R. G., Crawford, C. S., Merrifield, M. R., Hutchings, J. B., & McHardy, I. M. 1993, ApJ, 415, 101
- Balonek & Dent (1980) Balonek, T. J. & Dent, W. A. 1980, ApJ, 240, L3
- Blandford & Rees (1978) Blandford, R. D. & Rees, M. J. 1978, in Pittsburgh Conference on BL Lac Objects, Pittsburgh, Pa., April 24-26, 1978, Proceedings. (A79-30026 11-90) Pittsburgh, Pa., University of Pittsburgh, 1978, p. 328-341; Discussion, p. 341-347. NATO-supported research, 328–341
- Cohen et al. (1987) Cohen, R. D., Smith, H. E., Junkkarinen, V. T., & Burbidge, E. M. 1987, ApJ, 318, 577
- Corbett et al. (2000) Corbett, E. A., Robinson, A., Axon, D. J., & Hough, J. H. 2000, MNRAS, 311, 485
- Corbett et al. (1996) Corbett, E. A., Robinson, A., Axon, D. J., et al. 1996, MNRAS, 281, 737
- Einstein (1936) Einstein, A. 1936, Science, 84, 506
- Fiorucci et al. (1998) Fiorucci, M., Tosti, G., & Rizzi, N. 1998, PASP, 110, 105
- Frey et al. (2000) Frey, S., Gurvits, L. I., Altschuler, D. R., et al. 2000, PASJ, 52, 975
- Frey et al. (2006) Frey, S., Gurvits, L. I., Gabuzda, D. C., et al. 2006, PASJ, 58, 217
- Fujisawa et al. (1999) Fujisawa, K., Kobayashi, H., Wajima, K., et al. 1999, PASJ, 51, 537
- Gopal-Krishna & Subramanian (1991) Gopal-Krishna & Subramanian, K. 1991, Nature, 349, 766
- Jorstad et al. (2001) Jorstad, S. G., Marscher, A. P., Mattox, J. R., et al. 2001, ApJS, 134, 181
- Junkkarinen et al. (2004) Junkkarinen, V. T., Cohen, R. D., Beaver, E. A., et al. 2004, ApJ, 614, 658
- Kaspi et al. (2000) Kaspi, S., Smith, P. S., Netzer, H., et al. 2000, ApJ, 533, 631
- Kayser (1988) Kayser, R. 1988, A&A, 206, L8
- Kayser et al. (1986) Kayser, R., Refsdal, S., & Stabell, R. 1986, A&A, 166, 36
- Kayser et al. (1989) Kayser, R., Refsdal, S., Weiss, A., & Schneider, P. 1989, A&A, 214, 4
- Keeton et al. (2006) Keeton, C. R., Burles, S., Schechter, P. L., & Wambsganss, J. 2006, ApJ, 639, 1
- Kraus et al. (1999) Kraus, A., Quirrenbach, A., Lobanov, A. P., et al. 1999, A&A, 344, 807
- Liu et al. (2006) Liu, F. K., Zhao, G., & Wu, X.-B. 2006, ArXiv Astrophysics e-prints
- Madejski et al. (1996) Madejski, G., Takahashi, T., Tashiro, M., et al. 1996, ApJ, 459, 156
- McLure & Dunlop (2004) McLure, R. J. & Dunlop, J. S. 2004, MNRAS, 352, 1390
- Metcalf et al. (2004) Metcalf, R. B., Moustakas, L. A., Bunker, A. J., & Parry, I. R. 2004, ApJ, 607, 43
- Nemiroff (1988) Nemiroff, R. J. 1988, ApJ, 335, 593
- Nilsson et al. (1996) Nilsson, K., Charles, P. A., Pursimo, T., et al. 1996, A&A, 314, 754
- Ostriker & Vietri (1985) Ostriker, J. P. & Vietri, M. 1985, Nature, 318, 446
- Raiteri et al. (2001) Raiteri, C. M., Villata, M., Aller, H. D., et al. 2001, A&A, 377, 396
- Raiteri et al. (2005) Raiteri, C. M., Villata, M., Ibrahimov, M. A., et al. 2005, A&A, 438, 39
- Raiteri et al. (2006a) Raiteri, C. M., Villata, M., Kadler, M., et al. 2006a, A&A, 459, 731
- Raiteri et al. (2006b) Raiteri, C. M., Villata, M., Kadler, M., et al. 2006b, A&A, 452, 845
- Romero et al. (1995) Romero, G. E., Surpi, G., & Vucetich, H. 1995, A&A, 301, 641
- Saust (1992) Saust, A. B. 1992, A&A, 266, 101
- Schneider et al. (1992) Schneider, P., Ehlers, J., & Falco, E. E. 1992, Gravitational Lenses (Gravitational Lenses, XIV, 560 pp. 112 figs.. Springer-Verlag Berlin Heidelberg New York. Also Astronomy and Astrophysics Library)
- Schneider & Weiss (1987) Schneider, P. & Weiss, A. 1987, A&A, 171, 49
- Smith et al. (1985) Smith, P. S., Balonek, T. J., Heckert, P. A., Elston, R., & Schmidt, G. D. 1985, AJ, 90, 1184
- Stickel et al. (1988) Stickel, M., Fried, J. W., & Kuehr, H. 1988, A&A, 198, L13
- Stickel et al. (1991) Stickel, M., Fried, J. W., Kuehr, H., Padovani, P., & Urry, C. M. 1991, ApJ, 374, 431
- Stickel et al. (1993) Stickel, M., Fried, J. W., & Kühr, H. 1993, A&AS, 98, 393
- Torres et al. (2003) Torres, D. F., Romero, G. E., Eiroa, E. F., Wambsganss, J., & Pessah, M. E. 2003, MNRAS, 339, 335
- Vermeulen et al. (1995) Vermeulen, R. C., Ogle, P. M., Tran, H. D., et al. 1995, ApJ, 452, L5+
- Villata et al. (2004a) Villata, M., Raiteri, C. M., Aller, H. D., et al. 2004a, A&A, 424, 497
- Villata et al. (2006) Villata, M., Raiteri, C. M., Balonek, T. J., et al. 2006, A&A, 453, 817
- Villata et al. (2004b) Villata, M., Raiteri, C. M., Kurtanidze, O. M., et al. 2004b, A&A, 421, 103
- Wandel et al. (1999) Wandel, A., Peterson, B. M., & Malkan, M. A. 1999, ApJ, 526, 579
- Wayth et al. (2005) Wayth, R. B., O’Dowd, M., & Webster, R. L. 2005, MNRAS, 359, 561
- Webb et al. (2000) Webb, J. R., Howard, E., Benítez, E., et al. 2000, AJ, 120, 41