VLA Observations of \HI in the Circumstellar Envelopes of AGB Stars
Abstract
We have used the Very Large Array (VLA) to search for neutral atomic hydrogen (\HI) in the circumstellar envelopes of five asymptotic giant branch (AGB) stars. We have detected \HI 21-cm emission coincident in both position and velocity with the S-type semi-regular variable star RS Cnc. The emission comprises a compact, slightly elongated feature centered on the star with a mean diameter of ( cm), plus an additional filament extending to the northwest. If this filament is associated with RS Cnc, it would imply that a portion of its mass-loss is highly asymmetric. We estimate and a mass-loss rate yr-1. Toward three other stars (IRC+10216, EP Aqr, R Cas), we have detected arcminute-scale \HI emission features at velocities consistent with the circumstellar envelopes, but spatially offset from the stellar positions. Toward R Cas, the emission is weak but peaks at the stellar systemic velocity and overlaps with the location of its circumstellar dust shell and thus is probably related to the star. In the case of IRC+10216, we were unable to confirm the detection of \HI in absorption against the cosmic background previously reported by Le Bertre & Gérard. However, we detect arcs of emission at projected distances of ( cm) to the northwest of the star. The large separation of the emission from the star is plausible given its advanced evolutionary status, although it is unclear if the asymmetric distribution and complex velocity structure are consistent with a circumstellar origin. For EP Aqr, the detected \HI emission comprises multiple clumps redward of the systemic velocity, but we are unable to determine unambiguously whether the emission arises from the circumstellar envelope or from interstellar clouds along the line-of-sight. Regardless of the adopted distance for the \HI clumps, their inferred \HI masses are at least an order of magnitude smaller than their individual gravitational binding masses. We did not detect any \HI emission from our fifth target, R Aqr (a symbiotic binary), but measured a 1.4 GHz continuum flux density of 18.8 mJy. R Aqr is a previously known radio source, and the 1.4 GHz emission likely arises primarily from free-free emission from an ionized circumbinary envelope.
1 Introduction
For stars of low to intermediate masses (), the asymptotic giant branch (AGB) evolutionary stage is characterized by significant mass loss ( to yr-1) through cool, low-velocity (10 km s-1) winds. Over the course of roughly years, the material ejected from the atmospheres of such stars forms extensive circumstellar envelopes, up to a parsec or more in diameter (e.g., Habing 1996). Indeed, AGB stars are one of the primary means by which processed material is recycled back into the interstellar medium (ISM). Thus knowledge of the mass-loss history of these stars is key not only to understanding the evolution and ultimate fate of low-to-intermediate-mass stars (including their transition to the planetary nebula stage), but also for constraining the chemical evolution of the ISM and the factors that govern its small-scale structure. In binary systems, the material shed by AGB stars also may have an important influence on the evolution of Type Ia supernovae ejecta (e.g., Wang et al. 2004; Deng et al. 2004).
To date, most studies aimed at probing the material shed during the AGB stage have focused on trace species (e.g., CO; dust grains; H2O, SiO, & OH masers) due to their ready detectability at radio and infrared wavelengths (e.g., Habing 1996 and references therein). However, hydrogen should be by far the dominant constituent of the mass expelled from AGB stars. Of particular interest is the atomic hydrogen component, since unlike molecular species, \HI is not destroyed by the interstellar radiation field. This implies that observations of circumstellar \HI have the potential to probe significantly larger distances from AGB stars than studies of other envelope tracers ( cm; e.g., Villaver et al. 2002; Le Bertre & Gérard 2004).
Atmospheric models predict that for the coolest giants (2500 K), hydrogen in the stellar atmosphere will be predominantly molecular, while for 2500 K, hydrogen will be mainly atomic (Glassgold & Huggins 1983). As hydrogen is shed via an outflowing wind, a number of additional factors may modify its state, including the formation of H2 on grains and the dissociation of H2 through chromospheric emission, shocks, a hot companion, or the interstellar radiation field. While the relative importance of these various effects remains largely unknown, models predict that some fraction of the hydrogen in AGB circumstellar envelopes should be atomic, and consequently, should be observable via the \HI 21-cm line (Clegg et al. 1983; Glassgold & Huggins 1983; Villaver et al. 2002). Furthermore, \HI has been detected in emission and/or absorption toward several planetary nebulae (Rodríguez & Moran 1982; Altschuler et al. 1986; Schneider et al. 1987; Taylor & Pottasch 1987; Taylor et al. 1989,1990; Gussie & Taylor 1995; Rodríguez et al. 2000,2002); the detected material was presumably expelled by the stars during their AGB stage, although the details of this process are still poorly understood (e.g., Rodríguez et al. 2002).
Together the above factors make direct measurements of \HI radiation of considerable interest for determining the dominant form of hydrogen in the circumstellar envelopes of evolved stars and for helping to constrain the physical processes governing their evolution. In addition, \HI measurements have the potential to supply independent assessments of mass-loss rates, terminal velocities of the stellar wind, and the sizes, structures, and total masses of the circumstellar envelopes.
Despite the abundant motivations for measuring the hydrogen component in the circumstellar envelopes of AGB stars, such observations are challenging in practice. Even for the nearest AGB stars, the \HI signal is expected to be quite weak, and most often is coincident both in position and frequency with strong Galactic foreground and background emission along the line-of-sight. Indeed, initial efforts to detect \HI associated with evolved stars had very limited success. Until recently, the combined result of these studies (Zuckerman et al. 1980; Knapp & Bowers 1983; Schneider et al. 1987; Bowers & Knapp 1987,1988; Hawkins & Proctor 1992) was only one 21-cm line detection of a genuine AGB star ( Ceti=Mira; Bowers & Knapp 1988), along with the detection of one red supergiant (Betelgeuse Ori; Bowers & Knapp 1987). These results have often been interpreted as implying that the material lost from AGB stars must be primarily molecular (e.g., Zuckerman et al. 1980; Knapp & Bowers 1983), although in many cases, the derived \HI upper limits are not sufficiently sensitive to rule out atomic hydrogen as an important constituent of the circumstellar envelope.
This situation has changed dramatically in the past five years. Using the upgraded Nançay Radio Telescope, T. Le Bertre, E. Gérard, and coworkers have recently reported detections of roughly two dozen AGB and related stars. Le Bertre & Gérard (2001) first reported a detection of \HI absorption toward the carbon star IRC +10216 (but see §4.2). This team subsequently reported \HI emission detections of the semi-regular variable stars RS Cnc, EP Aqr, and X Her (Gérard & Le Bertre 2003; Le Bertre & Gérard 2004; Gardan et al. 2006) and the carbon-rich semi-regular variable Y CVn (Le Bertre & Gérard 2004). Most recently, they published the results of a more extensive survey featuring detections of a variety of types of AGB stars and planetary nebulae (Gérard & Le Bertre 2006).
These latest results are tantalizing, as they suggest that at least part of the material in the circumstellar envelopes of many evolved stars is atomic, and that it is feasible to use \HI 21-cm emission as a diagnostic probe of the late stages of stellar evolution. Indeed, the large observed \HI extents of the detected envelopes (up to 2 pc) confirms that \HI probes different regions of the envelope than CO or other molecular tracers, and thus can trace mass-loss over very large time-scales—up to yr. That the observed line profile shapes are very different from the rectangular profiles expected for symmetric, optically-thin, constant velocity outflows also suggests that the outflows from the stars are slowing down with time and that multiple (in some cases highly asymmetric) mass-loss episodes have occurred. However, a more complete interpretation of these discoveries requires better spatial information than can be provided by the (E-W)(N-S) beam of the Nançay telescope. Moreover, the interpretation of the Nançay spectra depends on the decomposition of the line profile in the presence of strong foreground and background emission. Since much of this contaminating emission is spatially extended, it should be resolved out with an interferometer, implying that aperture synthesis measurements can provide valuable complementary constraints on the \HI line parameters, and on the existence of circumstellar \HI components with a range of spatial scales. Motivated by this, we have recently used the Very Large Array (VLA)111The Very Large Array of the National Radio Astronomy Observatory is a facility of the National Science Foundation, operated under cooperative agreement by Associated Universities, Inc. to undertake a pilot \HI imaging study of five nearby AGB stars. The goals of our study included expanding the sample of AGB stars with sensitive \HI observations, as well as better constraining the sizes and spatial distributions of the \HI envelopes of AGB stars previously detected with the Nançay telescope.
1.1 Sample Selection
For our pilot \HI survey of AGB stars with the VLA, we did not attempt to study an unbiased sample of objects, but instead selected targets that we judged to have a good probability of detection. Our sample included three stars for which single-dish \HI detections had been reported at the time our study began (IRC+10216, RS Cnc, and EP Aqr; see above), together with two additional well-known AGB stars: R Cas and R Aqr. These latter two stars were selected as being relatively nearby and well-placed in the sky for scheduling purposes. In addition, both have radial velocities offset from the peak of the Galactic interstellar emission along the line-of-sight (Hartmann & Burton 1997), and neither has any strong neighboring 20-cm continuum sources (Condon et al. 1998) whose sidelobes might complicate the detection of weak, extended stellar \HI signals. An additional motivation for targeting R Aqr is that it is part of a symbiotic binary system, with the orbit of the hot companion lying within the cool giant’s circumstellar envelope (e.g., Spergel et al. 1983; Hollis et al. 1986). It has been suggested that the primary source of the \HI emission detected from the weakly symbiotic AGB star Ceti could be H2 photodissociated by its hot companion (Bowers & Knapp 1988; Gérard & Le Bertre 2003), hence it is of interest to explore whether \HI is also associated with other symbiotics. Some basic properties of our sample are summarized in Table 1.
| Name | (J2000.0) | (J2000.0) | Spectral Type | Known | |||||||
|---|---|---|---|---|---|---|---|---|---|---|---|
| (deg) | (deg) | (km s-1) | (pc) | (K) | ( yr-1) | (km s-1) | Binary? | ||||
| (1) | (2) | (3) | (4) | (5) | (6) | (7) | (8) | (9) | (10) | (11) | (12) |
| RS Cnc | 09 10 38.8 | +30 57 47.3 | 194.50 | +42.08 | +7.3 | 122 | 3110 | M6IIIase | (2.3,10) | 2.6,8.0 | No |
| IRC+10216 | 09 47 57.4 | +13 16 43.7 | 221.45 | +45.06 | 25.5 | 135 | 2200 | C9.5 | 14.6 | No | |
| EP Aqr | 21 46 31.8 | 02 12 45.9 | 54.20 | 39.26 | 135 | 3236 | M8IIIvar | (0.23,1.7) | 1.4,10.8 | No | |
| R Aqr | 23 43 49.5 | 15 17 04.2 | 66.52 | 70.33 | 197 | 2800 | M7IIIpevar | … | Yes | ||
| R Cas | 23 58 24.9 | +51 23 19.7 | 114.56 | 10.62 | 160 | 2500 | M7IIIe | 12.1 | No |
Note. — Units of right ascension are hours, minutes, and seconds. Units of declination are degrees, arcminutes, and arcseconds. Explanation of columns: (1) star name; (2) & (3) right ascension and declination (J2000.0); (4) & (5) Galactic coordinates; (6) systemic velocity relative to the Local Standard of Rest (LSR); (7) distance in parsecs; (8) stellar effective temperature; (9) spectral type; (10) mass-loss rate, in solar masses per year; two values are quoted for cases with multi-component line profiles; (11) outflow velocity derived from CO observations; two values are quoted for cases with multi-component line profiles; (12) single/binary status of star. Coordinates and spectral classifications were taken from SIMBAD (http://simbad.harvard.edu). Mass-loss rates and outflow velocities were taken from Michalitsianos et al. 1980 (R Aqr) or from Table 3 of Knapp et al. 1998 (all other stars). References for the remaining quantities are provided in § 4.
| Parameter | Value |
|---|---|
| Array configuration | D |
| Baseline range | 0.035-1.03 km |
| Number of antennas | 26 |
| Observation dates | 2004 July 1 & 28 |
| Correlator mode | 2AC |
| Bandwidth | 0.78 MHz |
| Channel width (after Hanning smoothing) | 6.1 kHz |
| Velocity separation of channels | 1.29 km s-1 |
| Velocity center of bandpass (LSR) | 0 km s-1 |
| Usable velocity range | km s-1 |
| Primary beam (FWHM) |
| Source | (J2000.0) | (J2000.0) | Flux Density (Jy) | Date |
|---|---|---|---|---|
| 3C48a | 01 37 41.2994 | +33 09 35.132 | 15.87∗ | 2004July28 |
| 3C286b | 13 31 08.2879 | +30 30 32.958 | 14.72∗ | 2004July1 |
| 0958+324c | 09 58 20.9496 | +32 24 02.209 | 1.610.01 | 2004July1 |
| 1008+075d | 10 08 00.0160 | +07 30 16.552 | 6.000.02 | 2004July1 |
| 2136+006e | 21 36 38.5862 | +00 41 54.213 | 3.570.01 | 2004July28 |
| 2321163f | 23 21 01.9589 | 16 23 05.187 | 2.190.01 | 2004July28 |
| 2355+498g | 23 55 09.4581 | +49 50 08.340 | 1.900.01 | 2004July28 |
Note. — Units of right ascension are hours, minutes, and seconds, and units of declination are degrees, arcminutes, and arcseconds.
| Source | Taper | PA | rms | Cont. chan. | Clean Boxes? | ||
|---|---|---|---|---|---|---|---|
| (k,k) | () | (degrees) | (mJy beam-1) | ||||
| (1) | (2) | (3) | (4) | (5) | (6) | (6) | (7) |
| RS Cnc | +5 | … | 39.0 | 1.7 | 20-40,90-110 | Yes | |
| RS Cnc | +5 | 2,2 | 51.4 | 2.0 | 20-40,90-110 | Yes | |
| IRC+10216 | +5 | 2,2 | 60.6 | 1.5 | 15-40,98-119 | No | |
| EP Aqr | +5 | 2,2 | 29.3 | 1.4 | 33-39,94-110 | No | |
| R Aqr | +5 | 2,2 | 13.7 | 1.9 | 10-53,73-110 | Yes | |
| R Aqr (continuum) | +1 | … | -0.04 | 0.38 | … | Yes | |
| R Cas | +5 | 2,2 | 39.9 | 2.0 | 15-40 | Yes |
Note. — Explanation of columns: (1) target name; (2) robust parameter used in image deconvolution; =+5 is equivalent to natural weighting; (3) Gaussian taper applied in and directions, expressed as distance to 30% point of Gaussian in units of kilolambda; (4) FWHM dimensions of synthesized beam; (5) position angle of synthesized beam (measured east from north); (6) rms noise per channel (1); (7) channels used for continuum subtraction; (8) indication of whether or not clean boxes were used during image deconvolution.
2 Observations
Our observations were carried out using the VLA on 2004 July 1 & 28. The array was used in its most compact (D) configuration (0.035-1.0 km baselines) in order to yield maximum sensitivity to emission on scales of up to 15′. In total, five stars, five phase calibrators, and two primary flux calibrators were observed. The July 1 observations (totaling 4 hours) were obtained during the day, while the July 28 observations (totaling 5 hours) were obtained after sunset. Total on-source integration times for each target star ranged from 75-97 minutes. Some further details of the observations are summarized in Table 2.
The autocorrelator was configured in 2AC mode, with a 0.78 MHz bandpass. After on-line Hanning smoothing, this yielded 127 channels with 6.1 kHz (1.3 km s-1) separation in each of two independent polarizations (right and left circular).
For the observations of all target stars and phase calibrators, the bandpass was centered at zero velocity relative to the local standard of rest (LSR). The primary flux calibrators (3C48=0137+331 and 3C286=1331+305) each were observed twice; first with the bandpasses centered at , and then at , in order to avoid contamination of the bandpass from Galactic line emission near . The two spectra were then averaged for calibration purposes.
The Galactic line emission along the lines-of-sight to our phase calibrators and target stars is sufficiently ubiquitous that is most likely filled the beams of the VLA antennas and caused some increase in the overall system temperature, Tsys. Because our flux calibrators were observed at velocities free from Galactic emission, the net result will be a systematic underestimate of the flux densities of our phase calibrators and program stars. To estimate the severity of this effect, we examined the \HI survey spectra of Hartmann & Burton (1997) toward the direction of each of our targets. Since the Dwingeloo telescope used by Hartmann & Burton is the same diameter as the VLA antennas (25m), the mean brightness temperature of the \HI emission in these spectra over the velocity range of our VLA spectral band can be directly compared with the nominal values for the VLA antennas over the same band. We estimate the most significant increase in toward the direction of R Cas, where our flux scale may be systematically low by 10%. For the other four program stars the effect is likely 5%. Because the effects are modest compared with various systematic uncertainties, we have not attempted to correct the flux densities quoted in this paper for this effect.
3 Data Reduction
Our data were reduced using the Astronomical Image Processing System (AIPS) software. First a “pseudocontinuum” data set was produced by vector averaging the inner three-quarters of the spectral bandpass. The pseudocontinuum data were used to identify and excise interference, malfunctioning antennas, and other bad data, and to calibrate the antenna gains.
Absolute flux levels were established using observations of standard VLA flux calibrators (3C48 and 3C286), and antenna phases were calibrated by using observations of bright point sources interspersed with the observations of each star (Table 2). The bandpasses of the spectral line data were calibrated using the primary flux calibrators.
The data for two of our targets (RS Cnc and IRC+10216) were obtained during the daytime and exhibited some contamination at short spacings, most likely from solar interference (the stars were 33∘ and 44∘ from the Sun, respectively). This short-spacing contamination resulted in a low-frequency ripple pattern (spatial period ) in all channels of our deconvolved images. Since this pattern was spatially fixed with a roughly constant amplitude from channel to channel (2 mJy beam-1), we were able to effectively remove it in the visibility plane, together with the continuum in the fields, using the AIPS task UVLIN (Cornwell et al. 1992; see also below).
3.1 Imaging of the Spectral Line Data
The spectral-line data for each of the target stars were imaged using the standard CLEAN deconvolution algorithm within AIPS. In all cases we used a cell size of 10′′ and imaged a region centered on the star. To maximize sensitivity to diffuse, extended emission, natural weighting (robust parameter =+5) was used in all cases to make an initial image of the line data, yielding synthesized beams of -. For each target, deconvolved images were made first from visibility data with the continuum retained in order to identify channels free of line emission. Subsequently, UVLIN was used to fit a zeroth or first-order polynomial to the real and imaginary components of each visibility in the line-free channels of the - data (see Table 4), and to subtract the continuum before a second, continuum-subtracted data cube was produced. Use of this method of continuum subtraction results in a biased noise distribution in the deconvolved data cube, in the sense that the channels used to determine the continuum level have lower RMS noise (in our case by 10%) compared with those excluded from the fit. We therefore made additional test cubes for each star where different ranges of channels were selected for continuum fitting in order to ensure that this channel-dependent noise did not affect our ability to identify emission features.
To further improve our dynamic range and sensitivity to extended emission, additional image cubes were computed using Gaussian tapering, yielding a synthesized beam with FWHM (see Table 4). Initially, all images were deconvolved without using any clean boxes (but see below). Even with the use of tapering, the effect of missing short spacings is evident in some of our images. When relevant, we comment further in § 4 on the implications of this for our analysis of the large-scale emission from individual targets.
The limited - coverage of our observations also led to a second type of artifact in our data. In all of our initial data cubes (both tapered and untapered), we found that most channels exhibited a pattern of emission in the form of broad (several arcminute scale) diagonal stripes and/or “checkerboard” patterns. These patterns typically had mean amplitudes of 1-3 mJy beam-1 in the tapered image cubes, although both the structure and the intensity varied from channel to channel within each image cube, and roughly 10% of the channels interspersed throughout each cube were completely free of this effect. The affected channels were not limited to frequencies with the brightest Galactic interstellar emission, although the effect was noticeably stronger in these channels. Except for the few channels with the strongest Galactic signals, we found this structured noise could be eliminated if data from the shorter spacings (below 0.3k) were excluded during imaging. Detection of this unwanted emission only on short spacings implies its source is likely to be sidelobe contamination of the primary beam by large-scale Galactic emission distributed across the sky that is poorly sampled by the array.
In order to ensure that the above noise pattern did not produce spurious signals that might be mistaken for circumstellar emission, we made at least two additional image cubes for each star: one excluding spacings below 0.3k, and another using data from all spacings, but with clean boxes placed around any potential circumstellar emission features. We found that the use of clean boxes also significantly reduced the amplitude of the unwanted large-scale background pattern. We regard candidate circumstellar \HI emission features as potentially real only if they were found to be statistically significant in both of these additional data cubes. However, we performed most of our subsequent analysis on data cubes incorporating the full range of array spacings. Table 4 summarizes the properties of the final images used for the analysis described in this paper.
3.2 Imaging of the Continuum
Continuum images of each of our stellar fields were obtained by first computing a vector average of the visibilities from all channels that were judged to be free of line emission (see Table 4). This averaged - data set was then imaged using the AIPS taks IMAGR with a ROBUST weighting parameter of =+1. In the case of the RS Cnc and IRC+10216 fields, additional images with - restrictions were imposed in order to suppress the short-spacing interference described above. Only one of our target stars, the symbiotic binary R Aqr, was detected in the 1.4 GHz (21-cm) continuum; those data are discussed further in §4.4. None of the other four stars in our sample have been detected previously at 1.4 GHz, and none show detetable 1.4 GHz counterparts on the NRAO VLA Sky Survey (NVSS; Condon et al. 1998). This is consistent with the radio photosphere model of Reid & Menten (1997), which predicts that the 1.4 GHz emission from the isolated AGB stars in our sample would be roughly 50-80 times weaker than our detection limit (see also Knapp et al. 1994).
4 Analysis and Results
Below we present the results of our VLA \HI survey of five nearby AGB stars. In four cases we have detected \HI emission coincident in velocity with the circumstellar envelopes of the target stars. In each of these cases we discuss the likelihood that the detected emission is physically associated with the circumstellar envelope based on the emission morphology, spatial distribution, velocity structure, and other factors. For one of our targets (R Aqr) we report a detection of the previously identified 1.4 GHz continuum emission. Various parameters (or upper limits) derived for each star are summarized in Table 5.
4.1 RS Cnc
4.1.1 Background
RS Cnc is a semi-regular variable star (class SRc?) of spectral type MIII8ase and an effective temperature K (Perrin et al. 1998). RS Cnc has a chemical type S, and it is believed to have undergone at least one thermal pulse (Gérard & Le Bertre 2003). Based on IRAS 60m observations (Young et al. 1993a,b), RS Cnc is known to have an extended circumstellar envelope in the form of a detached dust shell with inner radius and outer radius .
As noted above, Gérard & Le Bertre (2003) have reported a detection of RS Cnc in the \HI 21-cm line using the Nançay telescope. Their observed \HI profile is comprised of a broad and a narrow component and is similar in shape to the “double wind” CO profiles observed by Knapp et al. (1998). Gérard & Le Bertre decomposed their \HI profile into a Gaussian component with FWHM12 km s-1 and a narrow, rectangular component with FWHM4 km s-1. These widths are comparable to the two components of the CO lines and are thought to result from two or more distinct mass-loss episodes. Using their CO data, Knapp et al. estimated mass-loss rates for the two wind components of 1.0 yr-1 and 2.3 yr-1, respectively, assuming the Hipparcos distance222All physical quantities quoted in this paper have been scaled to the distances quoted in Table 1. to the star of 122 pc.
4.1.2 Results: RS Cnc
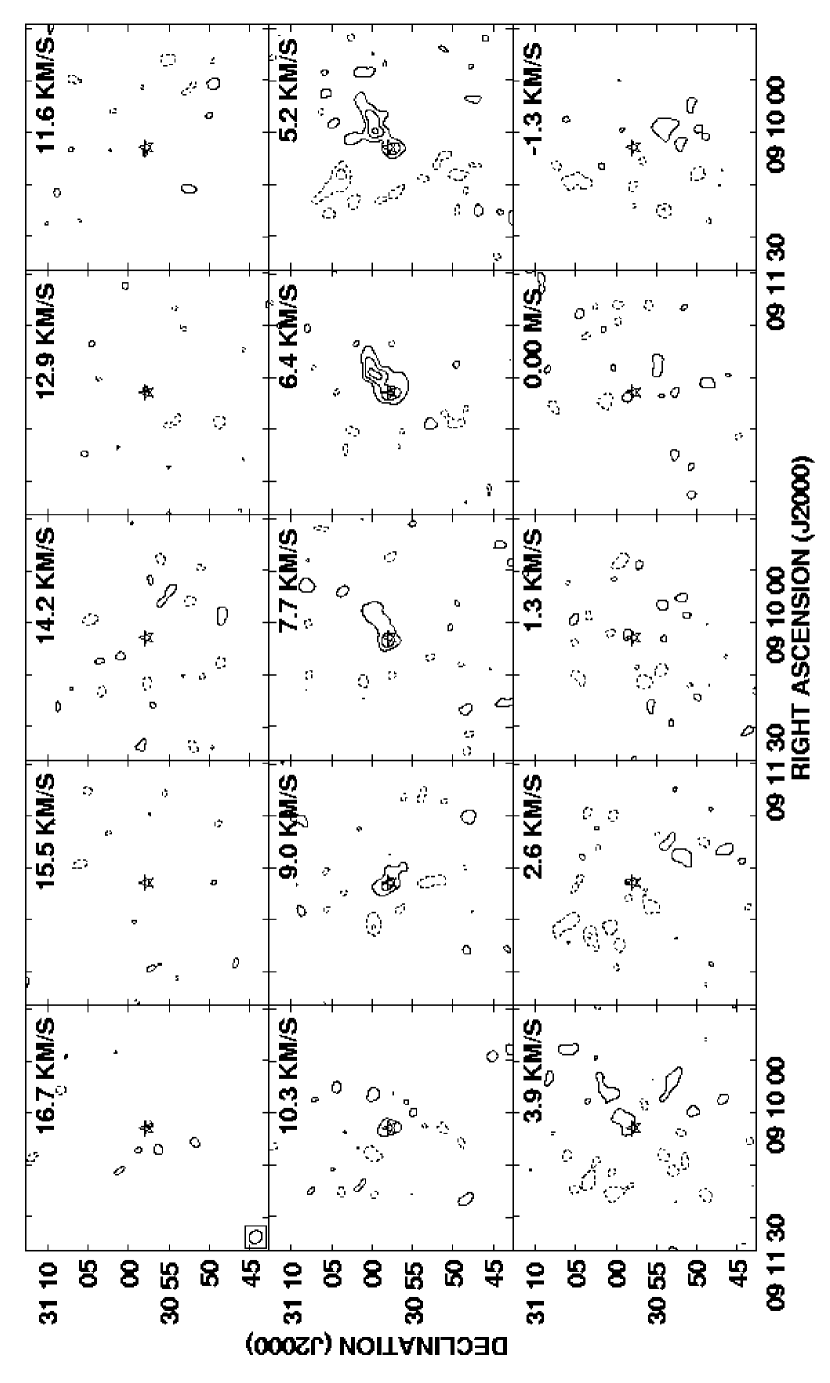
Channel maps from our VLA observations of RS Cnc are presented in Figure 1. The channels shown span the velocity range over which CO emission was detected in the envelope of RS Cnc by Knapp et al. (1998). \HI emission is clearly detected () in several channels bracketing the systemic velocity of the star ( km s-1 based on a mean of the CO lines observed by Knapp et al. 1998). In channels spanning the velocity range km s-1, a compact emission feature (hereafter the “compact component”) is present, coincident with the position of RS Cnc. These channels show an additional, elongated emission component (hereafter the “extended component”), extending from the compact feature to roughly northwest of the star’s position, along a position angle of . This extended emission is most prevalent between =3.9-7.7 km s-1.
Based on the autocorrelation spectra obtained by each VLA antenna, we find that the systemic velocity of RS Cnc is coincident with modest Galactic foreground/background emission along the line-of-sight. Near the systemic velocity of the star, this emission has a brightness temperature of a few K (see also Gérard & Le Bertre 2003). Most of this foreground/background appears to be resolved out in our aperture synthesis images. Therefore the coincidence of the compact emission component in both position and velocity with RS Cnc strongly suggests a physical association with the star. The compact nature of the central component and the lack of any features of similar strength at other positions in the map or in adjacent channels also lend credence to an association between the \HI emission and RS Cnc.
To further quantify the significance and uniqueness of the detected emission, an automated matched-filter technique was used to search our data cube for signals (see Uson & Matthews 2003). This search was performed on the continuum-subtracted, naturally-weighted, untapered data cube within a region, over the entire usable velocity range (km s-1 km s-1; i.e., the inner 77% of the band). In essence, signals above a signal-to-noise threshold were identified by looping through the data, convolving each spectrum through the designated portion of the data cube with Gaussian kernels of width 2-10 channels (2.6-13 km s-1). The most significant signal was found centered at km s-1 and at the phase center of the data cube, corresponding to both the position and systemic velocity of RS Cnc. The maximum signal-to-noise of this feature (10) occurred with a convolution width of six channels (8 km s-1). Outside of the channels suspected of containing emission from RS Cnc (i.e., outside the velocity range km s-1), the next strongest feature (9) occurred in the channel corresponding to the peak of the Galactic \HI signal in the autocorrelation spectra (near km s-1). In this case the signal is not located at the position of RS Cnc. The portion of the data cube searched contained independent beams333This number is not corrected for the number of trial convolving kernels, since results for the different kernels are highly correlated., hence the probability that the peak signal from a random \HI cloud along the line-of-sight would occur at both the position and velocity of RS Cnc is roughly 1 in . These results therefore strongly suggest that we have detected \HI emission physically associated with the envelope of RS Cnc.
Figure 2 shows an \HI total intensity image of the emission surrounding RS Cnc, made by summing the emission in channels spanning the velocity range km s-1. To increase signal-to-noise, only pixels whose flux density had an absolute value of after smoothing the data by a factor of three in velocity were included in the sum.
To constrain the size of the compact emission feature coincident with the position of RS Cnc, we have used two-dimensional Gaussian fits to the total intensity maps computed from our naturally-weighted data cubes. In the untapered map, the synthesized beam is nearly circular with FWHM, while in the tapered map (shown in Figure 2) the beam is . We find that the compact feature is resolved, with a slight elongation along a roughly north-south direction. As the position angle of this elongation is not well constrained, we have fixed it to be 0∘ in our fits. Fitting the tapered image, we measure deconvolved major and minor axis diameters of ( cm or 0.06 pc) and ( cm or 0.03 pc), respectively. The quoted uncertainties reflect formal fit errors as well as systematic uncertainties resulting form varying the size of the box inside which the fit was performed. Results of the fits to the untapered image were indistinguishable, but have larger uncertainties. Similar results were also obtained by fitting the emission in individual channels. The dimensions of the compact \HI source are thus comparable to or less than the inner radius of the dust shell around RS Cnc found by Young et al. (1993a,b).
To estimate the total \HI line flux recovered by our VLA observations, the flux density within each of the channels spanning the velocity range km s-1 was measured within an irregularly-shaped aperture or “blotch”. For each channel, the aperture was centered near the peak emission feature and its perimeter was defined using the 2 significance contour. All emission within this aperture was then summed. This analysis was performed on the tapered, naturally-weighted data cube, after correction for the primary beam. The resulting global \HI spectrum is shown in Figure 3. The profile shows a slight asymmetry, with the peak offset by 1 km s-1 from the stellar systemic velocity. This offset is significant compared with the formal uncertainty in as computed from CO observations (see above) and is similar to what is seen in the profile of X Her (another long-period, semi-regular variable with K) measured by Gardan et al. (2006), as well as some of the other evolved stars recently detected in \HI by Gérard & Le Bertre (2006). In the case of X Her, Gardan et al. suggested that the \HI profile morphology must result from a two-component, asymmetric outflow. For RS Cnc, such an interpretation is consistent with the compact and extended components seen in Figure 1 & 2. However, an important difference is that Gardan et al. find the broader velocity component of the X Her profile to be more spatially extended and linked with a possible outflow along a preferred direction; for RS Cnc we find the FWHM velocity width of the extended emission component to be narrower than that of the compact component (see below)—although both components can be traced over comparable velocity ranges. An alternative explanation for the slight skewing of the line profile may be the effect of ram pressure as the star moves through the ambient ISM.
From the \HI profile in Figure 3 we measure a peak flux density of Jy and an integrated \HI flux of =0.44 Jy km s-1. At the distance of RS Cnc, this translates to . The compact component of the flux distribution centered at the position of the star comprises approximately half of the total integrated flux ( Jy km s-1). The uncertainty quoted for the total integrated flux is a formal uncertainty based on the image statistics, neglecting calibration uncertainties. After correction for He, the total envelope mass that we infer () is comparable to the value derived from CO and IR data by Young et al. (1993a; , assuming a constant mass-loss rate). However, in reality, our VLA measurements may underestimate (by a factor of 2-3) the total \HI mass of the circumstellar envelope of RS Cnc if the envelope contains significant diffuse, extended emission. Gérard & Le Bertre (2003) estimated an \HI mass of associated with such an extended component, which would nearly double the \HI content of the envelope.
Gérard & Le Bertre (2003) suggested that the narrow component of their decomposed \HI spectrum of RS Cnc must arise from an emission region unresolved by the 4′(E-W) Nançay beam. The velocity interval over which we detect emission near RS Cnc is similar to the velocity spread seen in the narrow, rectangular component of Gérard & Le Bertre’s spectrum ( km s-1 km s-1 based on their Figure 3), and indeed, roughly one half of the emission detected with the VLA lies well within a projected radius around RS Cnc of . The additional extended component we see in our data to the northwest is most prevalent over the velocity interval 3.9-7.7 km s-1, implying that it is not the material responsible for the second broad, extended emission component reported by Gérard & Le Bertre (2003). That we do not see any evidence for this broad component in the VLA data is consistent with the suggestion of Gérard & Le Bertre that it arises from emission extended on scales of at least several arcminutes.
Altough the velocity resolution of our VLA data are too coarse (1.3 km s-1) for very precise linewidth determinations, we can roughly characterize the \HI line shape of RS Cnc as comprising a broad (FWHM8 km s-1), flat component linked with the compact emission feature, together with a narrower component (FWHM3 km s-1) linked to the extended emission. The broader component has a peak flux density comparable to the rectangular component reported by Gérard & Le Bertre (2003), although the emission we measure has a slightly broader velocity extent. The narrower line component seen in our data appears to be missing from the composite Nançay profile, although it may be blended with the additional broad, spatially extended emission component measured by those authors. We also note that a portion of the emission giving rise to the narrow component of our profile lies outside the area subtended by the Nançay beam (). Therefore, part of this emission may not have been recovered by the position-switched spectra of Gérard & Le Bertre. To produce their spectra, off-beams displaced by , , or east and west of the source were subtracted from the on-source spectra. Based on the VLA data, the off-beams obtained west of the source would have contained some \HI emission, resulting in a net subtraction from the total flux.
4.1.3 Discussion: Implications of the Observed \HI Emission
We can estimate a mass-loss rate for RS Cnc using the \HI parameters derived above. For simplicity, we assume a spherical envelope with a constant mass-loss rate and constant outflow speed. We emphasize, however, that the actual situation is likely more complex (see also Gardan et al. 2006). Moreover, because the relationship between the compact and the extended emission components is uncertain (see below), we consider only the compact component for this calculation. Adopting an \HI mass of 0.75, an outflow speed of 4 km s-1 (HWHM of the \HI line from the compact component) and a diameter of cm (the geometric mean of the major and minor axes), this yields yr-1 after correction for He. This rate is intermediate between the values derived from the two components of the CO profile by Knapp et al. (1998).
The global morphology of the extended \HI emission we detect in the neighborhood of RS Cnc is difficult to explain in terms of a steady, spherically-symmetric wind. While a roughly spherical wind may account for the compact component of emission centered on the star, the more extended emission to the northwest would seem to require significant mass-loss within a rather narrow solid angle. Gardan et al. (2006) have argued that outflow along a preferred direction is also necessary to explain their \HI observations of X Her. In CO maps, significant deviations from spherical symmetry are often seen in the circumstellar envelopes of AGB stars and have been attributed to bipolar outflows (e.g., X Her, Kahane & Jura 1996; Ceti; Josselin et al. 2000; IRC+10011, Vinković et al. 2004). The CO emission surrounding RS Cnc is also known to deviate from spherical symmetry (Neri et al. 1998), although it is confined to much smaller radii than the \HI () and does not appear distinctly bipolar. Some type of bipolar phenomenon may account for the slight elongation of the compact component seen in our \HI maps of RS Cnc. However, in the case of the extended component, lack of any detectable counterpart to the southeast argues against such an explantion.
To test whether the extended emission component could instead represent a bow shock or wake of material produced by ram pressure as the star moves through the ambient ISM (e.g., Villaver et al. 2003), we have computed the components of the Galactic peculiar space motion of RS Cnc, , following Johnson & Soderblom (1987). We assumed a heliocentric radial velocity of +14.4 km s-1 (Wilson 1953), a proper motion in right ascension of mas yr-1, and a proper motion in declination of mas yr-1 (Perryman et al. 1997). After correction for the solar motion using the constants of Dehnen & Binney (1998) we find =() km s-1. Finally, projecting back into an Equatorial reference frame, we derive (, , )pec=() km s-1. This predicts a component of motion toward the southwest (lower right of Figure 2), inconsistent with the interpretation of the extended emission as material swept back by motion through the ISM. One final possibility we cannot yet discount is that the extended \HI emission to the northwest is not associated with RS Cnc, but results from a chance superposition of an unrelated cloud along the line-of-sight. However, the correspondance between the radial velocity of this material and the compact \HI component centered on the star makes this possibility seem unlikely.
Given the high effective temperature of RS Cnc (Table 1), the models of Glassgold & Huggins (1983) predict that the hydrogen in its upper atmosphere should be primarily in atomic form. This suggests that the material we observe was shed directly from the stellar atmosphere, rather than originating from dissociated H2. Estimates of the amount of dissociated hydrogen expected around the star are consistent with this interpretation. While the photodissociation rates of H2 in circumstellar envelopes are model-dependent and still poorly known (e.g., Morris & Jura 1983; Glassgold & Huggins 1983; Reid & Menten 1997), we can obtain a rough approximation of the maximum number of \HI atoms in the RS Cnc envelope resulting from dissociated H2 using the formula suggested by Morris & Jura (1983). Assuming the interstellar UV radiation field is similar to that in the solar neighborhood (1.9 photons cm-2 s-1 sr-1; Jura 1974), the number of hydrogen atoms in an initially molecular circumstellar envelope can be approximated as , where is the outer radius of the envelope in cm and is its expansion or outflow velocity in km s-1. Taking cm (half the mean diameter of the compact \HI component derived above), 4 km s-1 (HWHM of the \HI line), this translates to an \HI mass for the envelope of only —nearly three orders of magnitude smaller than observed. While this calculation is crude, the magnitude of the discrepancy between the predicted and observed numbers is large and supports a picture where the bulk of the observed \HI emission originated in the stellar atmosphere of RS Cnc, not from photodissociated H2.
4.2 IRC+10216
4.2.1 Background
IRC+10216 is the nearest known carbon-rich AGB star (135 pc; Le Bertre 1997). The central star exhibits a moderately high mass-loss rate ( yr-1; Knapp et al. 1998) and is believed to be nearing the end of its AGB stage, en route to transitioning into a planetary nebula (e.g., Guélin et al. 1996; Skinner et al. 1998). The circumstellar envelope of IRC+10216 has been extensively studied at a wide range of wavelengths, and is known to be structurally complex over a range of scales, including an inner, bipolar structure surrounded by numerous arcs and shells (Guélin et al. 1996; Mauron & Huggins 2000; Fong et al. 2003; Leão et al. 2006). The envelope is also quite extended; CO emission has been detected as far as 200′′ from the star (Huggins et al. 1988), while the 100m emission is present to (Young et al. 1993a,b).
Zuckerman et al. (1980) and Bowers & Knapp (1987) attempted unsuccessfully to detect \HI associated with IRC+10216 using the Arecibo telescope and the VLA, respectively. However, more recently, Le Bertre & Gérard (2001) reported a detection of this star in \HI absorption using the Nançay Radio Telescope. As we describe below, our new VLA observations are consistent with the possible existence of atomic hydrogen surrounding IRC+10216, but the data suggest a possible modified interpretation of Le Bertre & Gérard’s results.
4.2.2 Results: IRC+10216
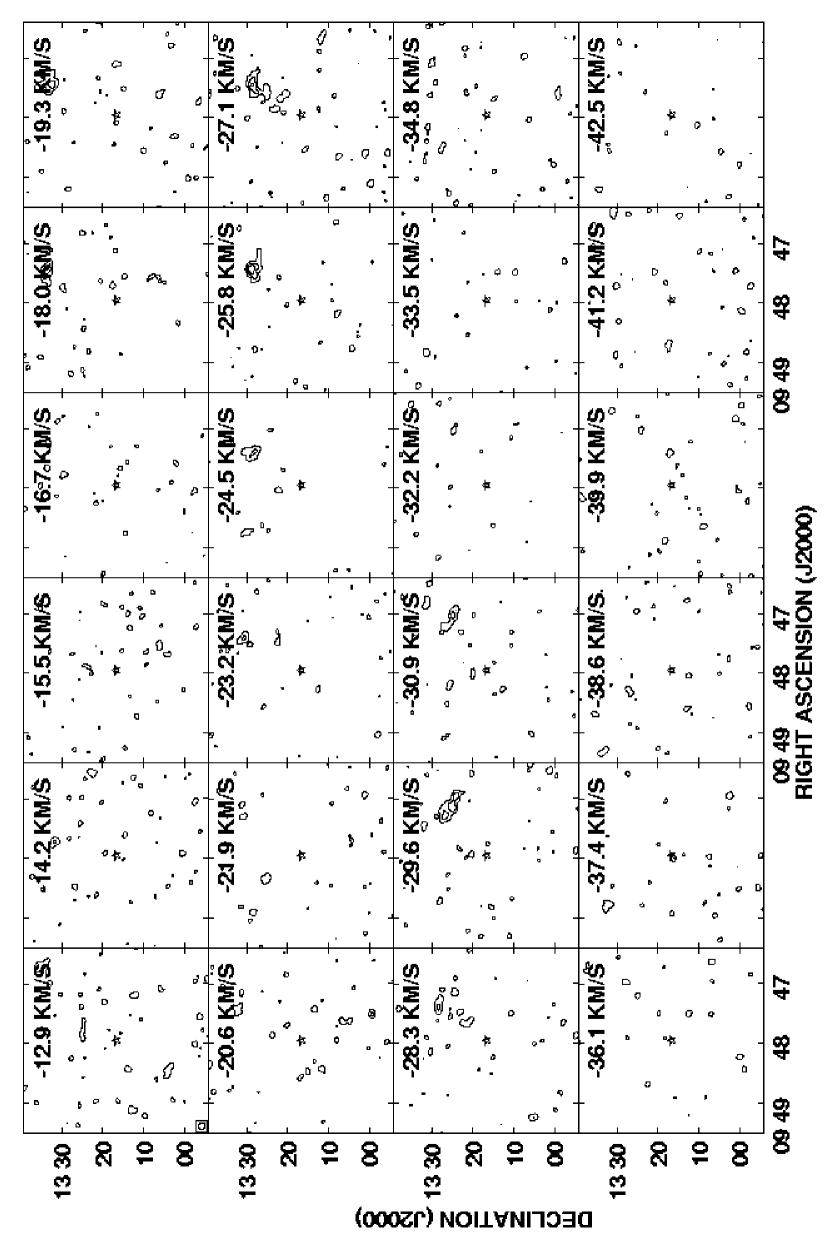
Selected \HI channel maps from our VLA observations of IRC+10216 are shown in Figure 4. These maps reveal extended, spatially contiguous patches of \HI emission within several channels bracketing the systemic velocity of IRC+10216 [ km s-1 based on the CO(2-1) line; Knapp et al. 1998]. The velocities of the detected emisson are consistent with other tracers of the envelope, including C i (Keene et al. 1993; van der Veen et al. 1998) and CO (Knapp et al. 1998; Fong et al. 2003). However, no \HI emission is seen directly toward the position of the star itself; instead the bulk of the emission is visible at projected distances of - to the northwest.
The morphology of the emission detected near IRC+10216 is highlighted further in Figure 5, where we present an \HI total intensity image obtained by summing the data from channels spanning the velocity interval km s-1 km s-1. To improve signal-to-noise, only pixels having flux densities with absolute values after smoothing the data in space and velocity by a factor of three were included. It can be seen that the bulk of the detected \HI emission at velocities close to IRC+10216 lies along two clumpy, elongated structures, extending between position angles -345∘. These position angles do not have any obvious relation to the geometry of features detected at other wavelengths, such as the bipolar structure seen in the optical (Maurin & Huggins 2000; Leão et al. 2006) or the pattern of arcs seen in CO (Fong et al. 2003).
4.2.3 Discussion: Have We Detected \HI Emission in the IRC+10216 Envelope?
Unlike the case of RS Cnc, where we detected \HI emission coincident both in velocity and in position with the central star, the data for IRC+10216 are more difficult to interpret, particularly since we know a priori very little about the expected sizes, structures, and morphologies of the \HI envelopes around AGB stars of different ages and temperatures. We now consider evidence for and against a possible association of the emission we have detected toward IRC+10216 with the envelope of the star.
The Galactic 21-cm foreground/background emission in the direction of IRC+10216 is complex, although its peak brightness temperature is modest (a few K), and its brightness drops to 1 K near the systemic velocity of IRC+10216 (Hartmann & Burton 1997; Le Bertre & Gérard 2001). As it is expected that the bulk of this weak emission should be resolved out in the VLA synthesized images, the likelihood that we have detected emission from an intervening foreground or background cloud along the line-of-sight to IRC+10216 should be rather low. However, the ISM is known to contain structures on a wide variety of scales, including arcminute-size structures (e.g., Baker & Burton 1979; Greisen & Liszt 1986; Knapp & Bowers 1988; Gibson et al. 2000; Braun & Kanekar 2005; see also § 4.3, § 4.5) and even subarcsecond-scale features (e.g., Dieter et al. 1979). Moreover, some of these structures may have velocities deviating from the underlying Galactic rotation (e.g., Knapp & Bowers 1988; Lockman 2002). Therefore the possibility of line-of-sight contamination in our present observations cannot be immediately excluded.
To aid in assessing the probability that some or all of the \HI emission we have detected in our VLA data could be associated with the circumstellar envelope of IRC+10216, we have searched our untapered, naturally-weighted IRC+10216 data cube for signals using the matched filter technique described in § 4.1.2. After smoothing the data in frequency with Gaussian kernels of various widths (2-10 channels), we find a total of twelve channels containing “signals” with significance . Nine of these channels are outside the velocity range where either CO or C i emission has been detected in the IRC+10216 envelope; these channels (spanning km s-1 and km s-1) also lie within the velocity range where the Galactic foreground/background emission along the line-of-sight is strongest based on our autocorrelation spectra. The emission within these nine channels is therefore unlikely to be associated with IRC+10216. In contrast, the other three channels where features were found correspond to velocities that bracket (to within uncertainties) the systemic velocity of IRC+10216 ( km s-1) and have underlying Galactic emission that is roughly eight times weaker than in the nine channels mentioned above. This is consistent with a possible relationship between the emission and the envelope of IRC+10216. Nonetheless, we note that we targeted IRC+10216 with the VLA specifically because of the previously reported detection of \HI near the velocity of the star (Le Bertre & Gérard 2001). Since a velocity coincidence between the star and \HI emission toward this direction was therefore expected a priori, these coincidence alone do not strongly discount the possibility of line-of-sight contamination.
Additional evidence of a possible relationship between the \HI features in Figure 4 and the envelope of IRC+10216 comes from the geometry of the emission and its projected distance from the star. As noted above, the \HI emission detected in our VLA images lies primarily along two clumpy, arc-like structures. Figure 5 illustrates that the shape and orientation of these arcs appear roughly consistent with material lying along ring- or shell-like structures centered on the IRC+10216 central star. These \HI features also show an intriguing similarity to features previously seen in the extended molecular envelope of IRC+10216. Using 12CO(1-0) spectral line observations, Fong et al. (2003) uncovered evidence for a series of clumpy, arc-like structures surrounding IRC+10216, superposed on a smoother, extended molecular envelope. They found these molecular arcs to be visible over the range and km s-1 km s-1. These arcs exhibit a wide range of azimuthal lengths, and are not symmetrically distributed about the central star. Analogous shells and arcs have also been found around other carbon stars and are believed to be formed through brief (100 yr) but intense periods of mass-loss ( yr-1; e.g., Steffen & Schönberner 2000; Schöier et al. 2005).
Compared with the CO arcs reported by Fong et al. (2003), the \HI emission detected with the VLA lies at a significantly larger projected distance from the star. However, this is consistent with the predictions of models for the expanding and evolving envelope. Even if hydrogen is initially shed from the IRC+10216 central star in molecular form, the advanced evolutionary status of the star implies that some of this material should have now traveled cm or more and become largely photodissociated by the interstellar radiation field (Glassgold & Huggins 1983; Villaver et al. 2002). Indeed, model calculations for IRC+10216 predict that the envelope of IRC+10216 should transition to a primarily atomic composition near a radius cm (Le Bertre & Gérard 2001)—consistent with the projected radii of the \HI arcs seen in our VLA images (1.7-2.2 cm).
Using the expansion velocity of the IRC+10216 wind obtained from CO observations ( km s-1; Knapp et al. 1998), we can estimate a kinematic age of 45,000 years for material located at cm from the star. This timescale is comparable to the expected separation of thermal pulses for TP-AGB stars ( years; e.g., Villaver et al. 2002), which have been suggested as a possible origin for detached shells around carbon stars. However, Villaver et al. (2002) predict that structures formed via this mechanism would disperse on timescales yr. They propose that longer-lived shells are created primarily by shocks between consecutive episodes of mass-loss or by the continuous accumulation of material in the interaction region between the circumstellar envelope and the ISM. Consistent with the observations of IRC+10216, Villaver et al. predict that shells formed via these latter mechanisms should be observable at distances of cm or more from evolved stars.
At the distance of IRC+10216, the total \HI mass we infer for the emission detected with the VLA is consistent both with published models of IRC+10216 and with observationally-determined shell masses for other carbon stars. Using the “blotch” method described in § 4.1.2, we derive a integrated \HI flux of 0.02 Jy km s-1 for the emission visible in Figure 4, corresponding to . This mass estimate has considerable uncertainty, since much of the emission lies outside the FWHP radius of the VLA primary beam, and because our data appear to be missing some flux on short spacings. Nonetheless, our inferred \HI mass is comparable to that predicted for IRC+10216 by Glassgold & Huggins (1983; ) and is also comparable to the gas masses of detached shells around several carbon stars derived by Schöier et al. (2005) from CO observations [(1-8)]. It is predicted that these shells will sweep up material from the surrounding medium as they expand, so the shell masses may include material shed via earlier, less energetic winds (Villaver et al. 2002; Schöier et al. 2005).
While the above findings appear consistent with the possibility of an association between the \HI features detected near IRC+10216 with the VLA and the circumstellar envelope of the star, it is unclear if other properties of the emission fit as readily with such a model, including the confinement of the detected \HI emission to a rather narrow range of position angles (PA) and the velocity structure of the material. While the velocity spread of the \HI emission we have detected with the VLA is consistent with the velocities of material previously observed in both C i and in CO, unlike these other tracers, the velocity spread of \HI emission is not distributed symmetrically about the systemic velocity of the star, nor does it extend to the full range of velocities where C i and CO have been detected. Moreover, the highest velocity \HI material is located at the largest projected distances from the star, unlike what is expected for a simple expanding shell (see e.g., Fong et al. 2003).
The global (spatially integrated) \HI profile derived from our VLA data is shown in Figure 6. This profile is noticeably asymmetric about the stellar systemic velocity. The velocity extent of the red edge of the profile is comparable to the C i profile measured by Keene et al. (1993), the CO emission measured by Fong et al. (2003), and the \HI profile measured by Le Bertre & Gérard (2001), but compared with these other profiles, the VLA spectrum shows a dearth of emission on the blue side, over the velocity interval km s-1 km s-1. This discrepancy is puzzling if a circumstellar origin for the detected \HI emission is assumed. Possible explanations could be missing short-spacing flux in the VLA images or blending with foreground/background emission along the line-of-sight. In addition, a significant fraction of the emission detected with the VLA lies outside the half-power radius of primary beam, adding further uncertainty to the global \HI profile we have derived. An alternative interpretation is that some or all of the emission we have detected toward IRC+10216 may be due to superpositions of random small-scale \HI clouds along the line-of-sight. Additional \HI mapping of the area around IRC+10216 (both with single-dish telescopes and a wide-field VLA mosaic) is clearly needed to more fully characterize the \HI distribution of this region.
As one final note, we draw attention to some intriguing similarities exist between the \HI emission we have detected toward IRC+10216 and the \HI emission detected in the Helix planetary nebula. Rodríguez et al. (2002) imaged the Helix in \HI using the VLA, and discovered a large, partial ring-like structure (with 0.4 pc) circumscribing the nebula. The \HI ring is clumpy and exhibits a complex velocity structure, somewhat analogous to the emission we see near IRC+10216, although it is unclear whether it could have had a similar origin. Rodríguez et al. (2002) suggest the Helix \HI ring is comprised of material released in the form of multiple globules during the central star’s AGB stage, and subsequently photodissociated by the now hot central star. However, since the central star of IRC+10216 is a cool giant, photodissociation of any ejected globules would have to occur primarily via the interstellar radiation field.
4.2.4 Comparison with Previous Results: \HI Emission versus \HI Absorption?
One key difference between the new \HI observations of IRC+10216 presented here and those previously reported by Le Bertre & Gérard (2001) is that the latter authors reported seeing only \HI in absorption. They interpreted this absorption as arising from supercooled \HI ( K) in an extended envelope seen against the cosmic background. However, the analysis of Le Bertre & Gérard was based on position-switched (onoff) difference spectra obtained with a single-dish telescope, and our VLA data now suggest a possible alternative interpretation of their results: namely that the apparent absorption profile arose instead from the presence of \HI emission in the off-source spectra obtained to the west of the star. Indeed, Figure 5 illustrates that any “off” spectra taken between roughly - to west of IRC+10216 with the highly elongated Nançay beam [(N-S)] would have sampled the \HI emission detected to the northwest of IRC+10216. Meanwhile, little or no emission would have been detected at the location of the IRC+10216 central star. Consequently, onoff difference spectra derived using spectra from these two locations would be expected to exhibit negative residuals, thus leading to an apparent absorption feature. Consistent with this revised interpretation, Le Bertre & Gérard (2001) reported seeing stronger absorption signatures in their difference spectra using off-beams displaced by and from IRC+10216 compared with a displacement of 4′.
4.3 EP Aqr
4.3.1 Background
EP Aqr is a semi-regular variable (SRb) with a period of 55 days and a spectral type of M8III. Dumm & Schild (1998) derived an effective temperature for the star of 3236 K. CO observations have shown that EP Aqr has two-component wind, as evidenced by the presence of both broad and narrow line components (Knapp et al. 1998; Kerschbaum & Olofsson 1999; Winters et al. 2003; Nakashima 2006). Knapp et al. (1998) interpreted the two-component CO profiles as indicating there have been at least two major mass-loss episodes. They derived mass-loss rates of 2.3 yr-1 and 1.7 yr-1 from the broad and narrow line CO components, respectively, assuming a Hipparcos distance of 135 pc. The mean central velocity of the CO components is km s-1 (Knapp et al. 1998), and we adopt this as the stellar systemic velocity.
EP Aqr is known to have a rather extended circumstellar envelope based on previous infrared observations. Using on IRAS 60m data, Young et al. (1993a,b) found that EP Aqr is surrounded by a detached dust shell of inner radius (0.06 pc) and outer radius (0.23 pc). Le Bertre & Gérard (2004) have also found evidence for an extended envelope based on their recent \HI observations.
4.3.2 Results: EP Aqr
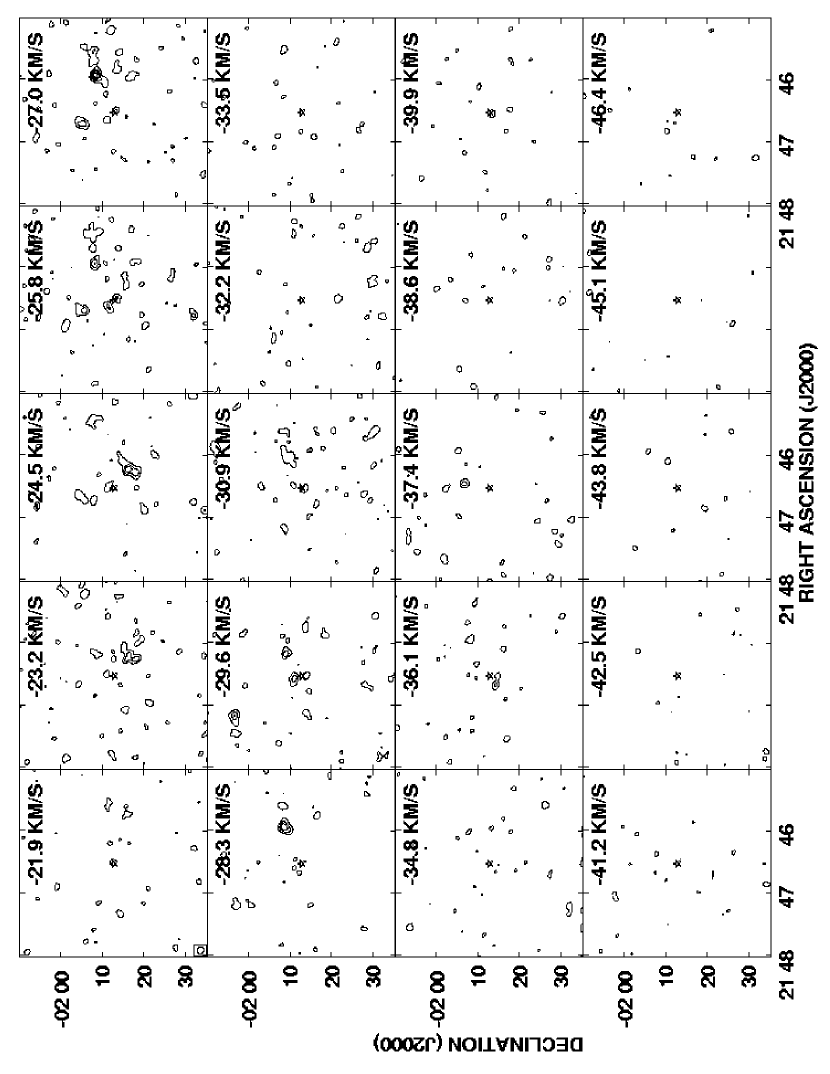
channel maps from our VLA observations of EP Aqr are presented in Figure 7. The channels shown correspond to the velocity range over which CO has been detected previously in the envelope of EP Aqr ( km s-1 km s-1; Knapp et al. 1998). No obvious \HI emission features () are seen anywhere in the channel nearest in velocity to the systemic velocity of the star, although statistically significant emission () is visible in several channels redward of the systemic velocity.
Using the Nançay telescope, Le Bertre & Gérard (2004) observed an \HI emission profile toward EP Aqr that they decomposed into three components, centered at LSR velocities of , , and km s-1, respectively, and having velocity widths 13.0, 2.6 and 1.6 km s-1, respectively. Our VLA data reveal emission that could be related to the latter two components, but no evidence of the emission responsible for the broadest line component. Le Bertre & Gérard (2004) noted that this broad component appears to arise from a region extended to as much as 10′ from the star, and our VLA data would have poor sensitivity to emission on these scales.
Le Bertre & Gérard (2004) suggested that the narrowest component seen in their data (centered at km s-1) arises from an emission region close to the star that is unresolved by their 4′(E-W) beam. As seen in Figure 7, our VLA data do reveal weak (4-5) emission features in channels centered at & km s-1, respectively, and lying within one-half synthesized beamwidth from the position of EP Aqr. These two channels also show additional, brighter emission clumps to the northwest, which become more prominent at higher velocities. Summing all of this emission yields a flux density at these velocities comparable to the peak value of 24 mJy reported by Le Bertre & Gérard (see Figure 8). In addition, channels corresponding to velocities in the range km s-1 km s-1 all show multiple emission clumps that can be traced over two or more consecutive channels. The combined signal from these clumps likely contributes to the intermediate-width emission component that Le Bertre & Gérard reported centered at km s-1. Le Bertre & Gérard suggested that the material giving rise to their intermediate-width component must be concentrated 4′-8′ northwest of EP Aqr, and this is roughly consistent the brightest emission region we detect with the VLA, centered 10′ northwest of EP Aqr’s position (see Figure 9).
4.3.3 Discussion: Detection of a Clumpy Circumstellar Envelope or Background Clouds?
As in the case of IRC+10216 (§ 4.2), we are faced with some difficulty in assessing whether any or all of the \HI emission detected in our VLA observations could be associated with the circumstellar envelope of our target. Compared with the case of IRC+10126, the peak brightness temperature of the Galactic \HI emission along the line-of-sight to EP Aqr is roughly twice as strong (Hartmann & Burton 1997). However, the emission is quite weak at the velocity of EP Aqr (1 K; Le Bertre & Gérard 2004), and the star is located well below the Galactic plane (), minimizing the probability for line-of-sight contamination. Nonetheless, as with IRC+10216, we specifically targeted EP Aqr because of a previous report of \HI emission near the systemic velocity of the star, hence this velocity coincidence alone is not enough to discount the possibility of foreground/background contamination.
Within a 15′ radius around EP Aqr, the bulk of the emission we detect near the stellar systemic velocity is contained within six fairly compact clumps, - across. All of these clumps are detected at in at least one channel and are traceable over two or more consecutive channels. We summarize some properties of these clumps in Table 6. If they lie at the distance of the star, the \HI masses of these features are -. The sum of the emission in the clumps with velocities consistent with the EP Aqr envelope yields . A global (spatially integrated) \HI profile derived by summing this emission is shown in Figure 8. After correction for He, the inferred mass is comparable to the envelope mass estimated from infrared observations (; Young et al. 1993b).
Figure 9 shows an \HI total intensity map of a 30′ region around EP Aqr, derived by summing the data over the velocity range km s-1 km s-1. Only pixels with absolute values after smoothing the data by a factor of three in velocity were included. With the exception of the features denoted C & D in Table 6 (which blend together near the center of the image), we see no clear evidence that the discrete emission clumps we have detected are part of any larger, contiguous structures, although three of the clumps are intersected by a circle with radius centered on the star. Moreover, the presence of a strong negative feature near the center of our map suggests we are missing flux on short-spacings, so we cannot rule out the existence of a more diffuse, underlying envelope.
The velocities of the emission clumps visible in Figure 9 (see Table 6) are all consistent with velocity range over which CO emission has been detected in the envelope of EP Aqr, and the range of \HI velocities corresponds with the velocity spread of the “red wing” of its two-component CO profile (Nakashima 2006). However, whereas the global CO line profiles of EP Aqr as seen in various transitions all appear symmetric about (e.g., Knapp et al. 1998; Nakashima 2006), all of the \HI clumps we have detected are redward of the systemic velocity. This makes it difficult to unambiguously establish a physical relationship between the detected clumps and EP Aqr’s envelope. Moreover, we find an additional \HI clump in our data cube with similar properties, but at a significantly higher velocity ( km s-1; see Table 6); material at this velocity is very unlikely to be associated with EP Aqr’s circumstellar envelope.
clumps with sizes and masses similar to the ones we find in the direction of EP Aqr were also seen in the VLA \HI study of the red giant Ori by Bowers & Knapp (1987; see also Knapp & Bowers 1988). In the case of Ori, the velocities of 9 of 13 the detected \HI clumps are consistent with the velocity spread of CO emission in the envelope of Ori measured by Knapp et al. (1998), but the velocities are preferentially concentrated redward of the stellar systemic velocity. In addition, numerous small CO clouds were subsequnetly discovered in this direction (Knapp & Bowers 1988), leading Bowers & Knapp to conclude that the \HI clouds they detected are unlikely to have a circumstellar origin.
Assuming the clumps we have detected toward EP Aqr are in equilibrium and that they are approximately spherical with uniform densities, the masses required for them to be gravitationally bound can be estimated based on the virial theorem:
| (1) |
where is the radius of the cloud in parsecs, is the FWHM velocity width of the cloud in km s-1, and the gravitational constant in these units is =1/232. We have tabulated angular size estimates for the clumps in Table 6. If we assume the clouds lie at the distance of EP Aqr and take as the FWHM of the \HI line profiles of the clumps, the masses estimated using Equation 1 range from up to 564. These values are 5 orders of magnitude higher than the inferred \HI masses (Table 6). Clearly if the clumps are located at the distance of EP Aqr they cannot be self-gravitating. Indeed, even if these clumps reside far out in the Galactic halo (100 kpc), their \HI masses would still be more than an order of magnitude smaller than their virial masses. This suggests that either these clouds are not in equilibrium (and thus are transient features) or else that the clouds are pressure confined by a medium that has been resolved out by our interferometric measurements (see also Knapp & Bowers 1988).
4.4 R Aqr
4.4.1 Background
After Mira AB, R Aqr is the nearest known example of a symbiotic binary. It is also the closest known example of an astrophysical jet. The Hipparcos distance to this system is =197 pc, in agreement with the geometric distance of 200 pc obtained by Hollis et al. (1997). R Aqr is comprised of a primary that is a Mira-like long-period variable (with a spectral classification M7IIIpevar and a period of 387 days) and an obscured hot secondary (most likely a white dwarf with an accretion disk; e.g., Hollis et al. 2000). Although R Aqr is surrounded by extensive nebulosity (extending to at least 2′; e.g., Wallerstein & Greenstein 1980; Hollis et al. 1985), the current mass-loss rate of the star is rather low. Based on ultraviolet spectroscopy and radio continuum observations, respectively, both Michalitsianos et al. (1980) and Spergel et al. (1983) estimated yr-1. However, these determinations may underestimate the actual mass-loss rate may by as much as an order of magnitude, depending on the fraction of the wind that is ionized (e.g., Dougherty et al. 1995).
Given the effective temperature of the R Aqr primary (2800 K; Burgarella et al. 1992), the models of Glassgold & Huggins (1983) predict that its mass-loss should occur in the form of atomic rather than molecular hydrogen. While a significant fraction of the circumbinary envelope of this system is ionized by the hot companion, the envelope may contain a neutral component outside its Strömgren radius ( cm; Kafatos & Michalitsianos 1982). At the distance of R Aqr, the lower boundary for this region would lie well within one VLA synthesized beam. Models by Spergel et al. (1983) predict that close to the R Aqr primary ( cm) an additional zone of neutral gas may be present. However, if the ionized nebula is optically thick at 21-cm, any \HI gas present in this zone would be invisible. Knapp & Bowers (1983) previously attempted unsuccessfully to detect R Aqr in \HI using the VLA, and unlike the other four stars in our present survey, R Aqr has never been detected in CO (Knapp et al. 1989; Young 1995).
4.4.2 Results: R Aqr Continuum Emission
Figure 10 shows an image of the 1.4 GHz (21-cm) continuum emission in the R Aqr field. Approximately 30 continuum sources are detected within our primary beam, including one corresponding in position with R Aqr. The centroid of this source agrees with the optical position of the star to within 10′′ (roughly one-fifth the width of our synthesized beam) implying the continuum emission is associated with R Aqr.
R Aqr has long been known to be a radio continuum source, and detections of the system have been reported previously over a wide range of frequencies (1.4-43 GHz; e.g., Gregory & Seaquist 1974; Bowers & Kundu 1979; Sopka et al. 1982; Spergel et al. 1983; Hollis et al. 1985; Dougherty et al. 1995; Hollis et al. 1997; Mäkinen et al. 2004). At high resolution, the continuum emission breaks up into multiple components, including a compact H ii region centered at the position of the AGB star and a jet extended to the northeast (e.g., Kafatos et al. 1983; Hollis et al. 1985; Dougherty et al. 1995). The 1.4 GHz continuum from R Aqr is much too strong to arise solely from photospheric emission. As in many other symbiotic systems, the radio continuum emission from R Aqr has been attributed primarily to optically thick free-free emission from circumbinary material ionized by the hot companion (see Seaquist et al. 1984), although high resolution images show that there is also a component of optically thin thermal emission arising from the jet (Hollis et al. 1985).
The jet and H ii region components of R Aqr seen in the higher resolution 1.4 GHz observations of Hollis et al. (1985) are unresolved by our current observations, where R Aqr appears only as a single point source. Using an elliptical Gaussian fit, we measure a 1.4 GHz continuum flux density for the R Aqr system of 0.7 mJy from our VLA data. This agrees to within formal uncertainties with the 1.4 GHz flux density we derive from the NVSS survey (Condon et al. 1998) using the same method (0.9 mJy), but is significantly higher than the value previously reported for the H ii region+jet by Hollis et al. (1985; mJy). The Hollis et al. measurements were based on higher angular resolution VLA observations () and therefore may have resolved out some of the flux. From our fits we place an upper limit on the (deconvolved) diameter of the R Aqr radio source ( cm or 0.02 pc), although the higher resolution observations of Hollis et al. (1985) have already constrained the source size to be at least several times small than this.
4.4.3 Results: Limits on \HI Emission and Absorption in R Aqr
The stellar systemic velocity of R Aqr is rather uncertain; the star has never been detected in CO, and various other emission and absorption lines yield values that differ by up to tens of km s-1 and in some cases show variations with time (see Wallerstein & Greenstein 1980). Here we adopt km s-1 based on the K i measurements of Wallerstein & Greenstein (1980).
Figure 11 shows the continuum-subtracted channel images from our spectral line data cube over the velocity interval within roughly km s-1 of the stellar systemic velocity. We see no evidence for significant \HI emission at or near . Channels corresponding to km s-1 & km s-1, respectively, each show a single arcminute-scale emission feature with significance of . However, neither feature coincides with the position of the R Aqr continuum source (as would be expected if \HI is present just outside the Strömgren radius; see above) and neither feature can be traced beyond a single channel. Neither is therefore a compelling candidate for emission associated with the circumbinary envelope.
To estimate an upper limit on the \HI content of the circumbinary envelope of R Aqr we assume that the neutral portion of the envelope would most likely be centered at the position of the R Aqr continuum source and be unresolved by our beam ( cm). Taking a fiducial velocity extent of km s-1, we then derive a 3 upper limit on the integrated \HI flux from R Aqr as where is the mean rms noise per channel within one synthesized beam centered on R Aqr over the velocity interval km s-1. This yields Jy km s-1, translating to an upper limit on the \HI mass of . Of course this limit does not account for the possibility of spatially extended \HI emission.
To place additional limits on the possible presence of such an extended \HI envelope, we have also searched for \HI in absorption against the background continuum sources seen in Figure 10, including the continuum from R Aqr itself. However, we find no statistically significant \HI absorption features in our bandpass toward any of these sources. This is not surprising, as all of the continuum sources are rather faint ( Jy). We have computed 3 upper limits on the mass of intervening \HI along each sightline as:
| (2) |
(Schneider et al. 1987) where is the excitation temperature of the \HI line (taken to be 100 K), is the distance to the star, is the angular size of the continuum source, and is the optical depth of the line at velocity , which can be computed as . In the latter expression, is the source covering factor, is the rms noise, and is the flux density of the continuum source. If we assume that the line has a Gaussian shape, then where is the FWHM linewidth (e.g., Lane 1999).
Adopting and 10 km s-1, toward the R Aqr continuum source we find . The brightest continuum source in Figure 10 (lying at , ) has a flux density of 0.363 Jy and yields an upper limit of . These absorption limits are thus not sufficiently strict to rule out the presence of either a compact \HI-rich envelope comparable in mass to that seen around RS Cnc (§ 4.1.2) or a more extended envelope comparable to those now reported around several other AGB stars (e.g., Gérard & Le Bertre 2006).
| Source | () | ( cm) | (km s-1) | (km s-1) | yr-1) | |
|---|---|---|---|---|---|---|
| (1) | (2) | (3) | (4) | (5) | (6) | (7) |
| RS Cnca | 7.5 | 0.5-1.0 | 4 | 7.7 | 1.7 | |
| RS Cncb | 7.5 | 6′ | 5.5 | 1.5 | 7.7 | … |
| IRC+10216c | 2.4 | - | 17-22 | 6.5 | … | |
| EP Aqrc | 1.7 | 10′ | 12 | … | … | |
| R Aqrd | … | … | … | … | … | |
| R Cas | 5.3 | 6.7 | 2 | 24.5 | … |
Note. — Explanation of columns: (1) star name; (2) \HI mass or 3 upper limit; (3) maximum angular extent of the detected \HI emission relative to the position of the star; (4) projected linear extent of the detected \HI emission relative to the star; (5) outflow velocity, based on the HWHM of \HI profile; (6) unweighted central velocity (LSR) of the \HI emission profile; (7) mass-loss rate (corrected for the mass of He) estimated from the \HI data assuming a spherical geometry and a constant velocity wind.
| Label | (Ch.) | (J2000.0) | (J2000.0) | Size | |||||
|---|---|---|---|---|---|---|---|---|---|
| (km s-1) | (mJy beam-1) | (Jy km s-1) | (arcsec) | () | () | ||||
| (1) | (2) | (3) | (4) | (5) | (6) | (7) | (8) | (9) | (10) |
| A | 84-88 | 20.3 | 21 45 55.8 | 02 08 16 | 0.16 | 6.9 | 100 | ||
| B | 82-84 | 16.8 | 21 46 13.2 | 02 18 16 | 0.12 | 5.2 | 132 | ||
| C | 84-85 | 9.7 | 21 46 29.2 | 02 13 26 | 0.01 | 0.43 | 42 | ||
| D | 87-88 | 8.2 | 21 46 33.2 | 02 13 26 | 0.01 | 0.43 | 42 | ||
| E | 83-85 | 12.9 | 21 46 43.2 | 02 05 06 | 0.06 | 2.6 | 134 | ||
| F | 82-84 | 6.9 | 21 46 53.9 | 02 20 16 | 0.03 | 1.3 | 25 | ||
| G | 18-23 | +56.7 | 16.6 | 21 45 12.4 | 02 18 46 | 0.32 | 14 | 564 |
Note. — \HI properties of features were derived from the naturally-weighted, tapered data cube (see Table 4). Units of right ascension are hours, minutes, and seconds. Units of declination are degrees, arcminutes, and arcseconds. Explanation of columns: (1) clump designation; (2) range of channels where clump was detected at ; (3) unweighted mean velocity of clump; (4) peak brightness of clump; (5) & (6) right ascension and declination of the brightness peak; (7) velocity integrated flux; (8) approximate angular dimensions of clump; (9) \HI mass of the clump at the distance of EP Aqr (=135 pc); (10) gravitational binding mass of the clump at the distance of EP Aqr.
4.5 R Cas
4.5.1 Background
R Cas is an O-rich Mira-type variable star with a period of 430.5 days. The star has a spectral type of M7IIIe and a mean effective temperature K (Haniff et al. 1995). Using CO observations, Knapp et al. (1998) derived an expansion velocity for the wind 12.1 km s-1 and a mass-loss rate of 1.2 yr-1 (here we adopt a distance of 160 pc derived from the period-luminosity relation by Haniff et al. 1995). Based on IRAS infrared observations, Young et al. (1993a,b) found R Cas is surrounded by an extended, dusty shell with an inner radius of and outer radius . Recently, Gérard & Le Bertre (2006) have reported a detection of this star in \HI using the Nançay telescope.
4.5.2 Results: R Cas
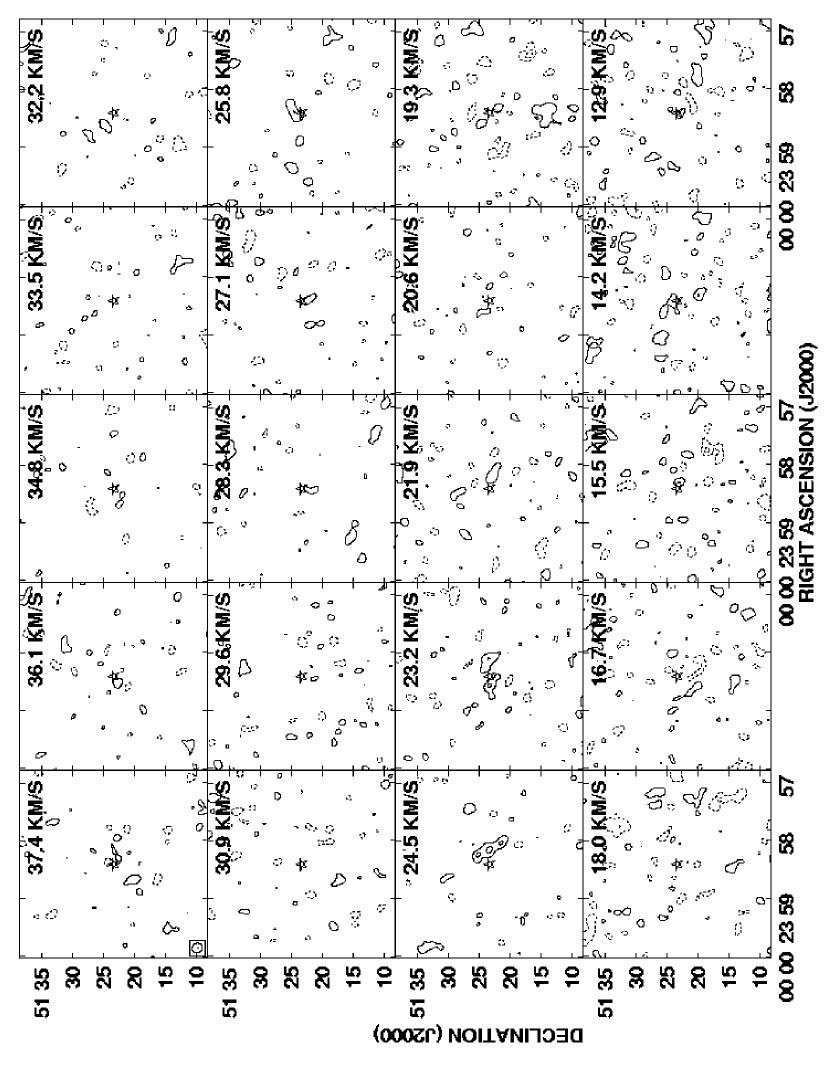
Figure 12 shows the \HI channel maps from our VLA observations of R Cas over a velocity range corresponding to the velocity spread of the CO(3-2) emission detected in its envelope by Knapp et al. (1998) (12 km s-136 km s-1). The systemic velocity of R Cas derived from the CO observations is km s-1. Figure 12 shows that over this velocity interval, the brightest detected \HI emission () is found in the channel with central velocity 24.5 km s-1—i.e., the channel closest to the systemic velocity of the star. The emission peaks roughly one synthesized beam diameter from the optical position of R Cas (i.e., away). Two adjacent channels also show regions of extended emission within roughly 1-2 beam diameters from the star.
Figure 13 shows an image formed from the sum of three spectral channels spanning the velocity range 23.2 km s-125.8 km s-1. Because of the weakness of the emission and its narrow velocity spread, no clipping or smoothing has been applied. The morphology of the emission in Figure 13 suggests we may be seeing a fragment of a clumpy, shell-like structure around R Cas. If real, this structure would overlap with the dust shell discovered by Young et al. (1993a,b) and would have a projected radius cm. Using the blotch method described in § 4.1.2, we measure the total \HI flux in this structure to be Jy km s-1. At the distance of R Cas, this corresponds to an \HI mass . A global \HI profile derived from these measurements is shown in Figure 14. After correction for He, the mass we estimate () is still roughly an order of magnitude smaller than the circumstellar envelope mass derived by Young et al. (1993b) from infrared observations (). However, the dust shell measured by Young et al. was approximately four times more extended. Assuming a constant velocity wind, the density of material, , is expected to drop as the inverse square of the distance (), implying that the total mass, , will be proportional to . Thus our estimate appears to be consistent with Young et al.’s measurement if we are sampling only a small fraction of the envelope material.
4.5.3 Discussion: An \HI Shell around R Cas?
In our observations of R Cas, roughly half of our bandpass ( km s-1, not shown in Figure 12) is significantly contaminated by Galactic emission that is only partially resolved out by the VLA. However, we find no evidence of significant contamination in the higher-velocity channels. Consistent with this, the spectra of Hartmann & Burton (1997) toward this direction show a steep drop-off in the Galactic \HI brightness temperature near 15 km s-1, and no detectable Galactic emission at velocities 20 km s-1 (see also Gérard & Le Bertre 2006).
We have again used a matched filter search (see § 4.1.2) as an aid in quantifying the uniqueness and significance of the emission features detected in our data cube. We searched our tapered, naturally-weighted, continuum-subtracted R Cas data cube over a 30′ region. The search was limited to the velocity range km s-1 in order to exclude edge channels and the portion of the band with obvious Galactic contamination. After smoothing the data in frequency using Gaussian kernels with widths of 2-10 channels, we find the peak signal over this search volume to correspond spatially to the center of the elongated structure in Figure 13. The velocity centroid of this feature occurs in the channel with center velocity 23.2 km s-1, and its peak signal-to-noise (6) occurs for a smoothing kernel width of 4 channels (5 km s-1). Our matched filter search turned up no other signals with significance outside the channels centered at 23.2 km s-1and 24.5 km s-1, respectively. The results of this analysis are therefore consistent with the detection of \HI emssion from the circumstellar envelope of R Cas. We note also that the mean effective temperature of R Cas lies near the transition from molecular to atomic winds proposed by Glassgold & Huggins (1983), implying that at least some atomic component to the wind is predicted for this star.
The VLA \HI spectrum of R Cas (Figure 14) appears quite similar to the single-dish profile recently published by Gérard & Le Bertre (2006) in terms of its central velocity, velocity width, and peak flux density. However, it is unclear whether we have detected emission from the same material as those authors. Gérard & Le Bertre find evidence that the \HI emission around R Cas is quite extended (up to ) based on an apparent increase in the measured flux density at the position of R Cas with increasing throw of the off-beams subtracted from the on-source spectra. However, given the weakness of the emission, estimates of the angular extent may be influenced by baseline uncertainties in the single dish spectra. Sensitive single-dish mapping of the region around R Cas would likely provide additional insight.
5 Summary and Concluding Remarks
Recently, sensitive new single-dish \HI surveys have established that neutral atomic hydrogen is common in the circumstellar envelopes of evolved, low-to-intermediate mass stars undergoing mass-loss (Gérard & Le Bertre 2006 and references therein). Studies of the 21-cm line emission from this material can therefore provide important constraints on atmospheric models of AGB stars, the physical conditions in their extended envelopes, and on the rates, timescales, and geometries of their mass-loss.
Here we have reported the results of a VLA \HI imaging survey of five nearby AGB stars: RS Cnc, IRC+10216, EP Aqr, R Aqr, and R Cas. \HI detections of four of these targets (RS Cnc, EP Aqr, and R Cas in emission and IRC+10216 in absorption) have been published previously based on single-dish observations (Le Bertre & Gérard 2001,2004; Gérard & Le Bertre 2003,2006). However, because of limited spatial resolution and confusion from Galactic emission along the line-of-sight, the single-dish data alone did not permit a full characterization of the small-scale structure of the emission or its distribution relative to the star.
We have confirmed the presence of \HI emission coincident in position and velocity with the semi-regular variable RS Cnc, implying that the emission is indeed associated with its circumstellar envelope. The emission comprises a compact, slightly elongated region centered on the star with a mean diameter of ( cm), plus an additional filament extending to the northwest. We estimate a total \HI mass for this material of . The morphology of this extended filament suggests that a component of the mass-loss from RS Cnc was highly asymmetric. From the \HI data we derive a recent mass-loss rate of yr-1, comparable to previous estimates based on CO observations.
For the Mira variable R Cas we have detected weak emission centered at the systemic velocity of the star. The morphology of the emission is consistent with a partial shell-like structure with a radius . This structure overlaps with the dust shell previously detected by Young et al. (1993a,b), and we estimate for it an \HI mass of . Galactic contamination at the position and velocity of R Cas is low, suggesting a good probability that the \HI emission we have detected is associated with its circumstellar envelope.
Toward two other targets (the carbon star IRC+10216 and the semi-regular variable EP Aqr) we have also detected multiple arcminute-scale \HI emission features at velocities consistent with their respective circumstellar envelopes, but spatially offset from the position of the stars. However, in these cases, we are unable to determine unambiguously whether the emission arises from material within the circumstellar envelope or, instead, from the chance superposition of \HI clouds along the line-of-sight. In each case, we have discussed evidence for and against both interpretations.
Toward IRC+10216 we find arc-like \HI emission structures at projected distances of to the northwest of the star. The large separation between the \HI emission and the position of the star are consistent with the advanced evolutionary status of IRC+10216 and the prediction that \HI will be formed from an initially molecular wind via photodissociation and/or the sweeping up of interstellar material as the wind expands. However, it is unclear if the highly asymmetric geometry and the complex velocity structure of the emission we have detected are consistent with a circumstellar origin.
We were unable to confirm the detection of \HI in absorption against the cosmic background in the envelope of IRC+10216 as previously reported by Le Bertre & Gérard (2001). Our VLA images reveal that at least part of the apparent absorption signature seen by Le Bertre & Gérard may have arisen from emission that contaminated the off-beam measurements used in their position-switched (onoff) observations.
In the case of EP Aqr, we have detected six arcminute-scale clumps of \HI emission within a projected radius of around the star. All of the clumps lie redward of the stellar systemic velocity, although their velocities are consistent with the “red wing” of the circumstellar envelope as seen in CO emission. While it is tempting to posit that these clumps may be part of a more diffuse underlying envelope reported by Le Bertre & Gérard (2004), the presence of an additional \HI clump in our data that is significantly redshifted relative to the star raises the possibility that we are instead sampling random interstellar clouds along the line-of-sight. We find, however, that regardless of the assumed distance for these clumps, their virial masses exceed their \HI masses by over an order of magnitude, suggesting that either these are transient features or that they are embedded in a more diffuse medium to which the VLA is insensitive. In the case of both EP Aqr and IRC+10216, combining our VLA observations with single-dish mapping may help to remove the ambiguities in associating the detected \HI emission with the respective circumstellar envelopes. In addition, a future compact “E” configuration of the VLA would be well-suited to studies of this kind.
We detected our fifth target, R Aqr (a symbiotic star with a hot companion), in the 1.4 GHz continuum with a flux density mJy. None of the other four stars in our sample showed detectable continuum emission. R Aqr is a well-known radio source, and its continuum emission likely arises primarily from free-free emission from an ionized circumbinary envelope. However, we did not detect any neutral hydrogen associated with R Aqr.
References
- (1) Altschuler, D. R., Schneider, S. E., Giovanardi, C., & Silverglate, P. R. 1986, ApJ, 305, L85
- (2)
- (3) Baker, P. L. & Burton, W. B. 1979, A&AS, 35, 129
- (4)
- (5) Bowers, P. F. & Knapp, G. R. 1987, ApJ, 315, 305
- (6)
- (7) Bowers, P. F. & Knapp, G. R. 1988, ApJ, 332, 299
- (8)
- (9) Bowers, P. F. & Kundu, M. R. 1979, AJ, 84, 791
- (10)
- (11) Braun, R. & Kanekar, N. 2005, A&A, 436, L53
- (12)
- (13) Burgarella, D., Vogel, M., & Paresce, F. 1992, A&A, 262, 83
- (14)
- (15) Clegg, R. E. S., van Ijzendoorn, L. J., & Allamandola, L. J. 1983, MNRAS, 203, 125
- (16)
- (17) Condon, J. J., Cotton, W. D., Greisen, E. W., Yin, Q. F., Perley, R. A., Taylor, G. B., & Broderick, J. J. 1998, AJ, 115, 1693
- (18)
- (19) Cornwell, T. J., Uson, J. M., & Haddad, N. 1992, A&A, 258, 583
- (20)
- (21) Deng, J., Kawabata, K. S., Ohyama, Y., Nomoto, K., Mazzali, P. A., Wang, L., Jeffery, D. J., Iye, M., & Yoshii, Y. 2004, ApJ, 605, L37
- (22)
- (23) Dehnen, W. & Binney, J. J. 1998, MNRAS, 298, 387
- (24)
- (25) Dieter, N. H., Welch, W. J., & Romney, J. D. 1979, ApJ, 206, L113
- (26)
- (27) Dougherty, S. M., Bode, M. F., Lloyd, H. M., Davis, R. J., & Eyres, S. P. 1995, MNRAS, 272, 843
- (28)
- (29) Dumm, T. & Schild, H. 1998, New Astron., 3, 137
- (30)
- (31) Fong, D., Meixner, M., & Shah, R. Y. 2003, ApJ, 582, L39
- (32)
- (33) Gardan, E., Gérard, E., & Le Bertre, T. 2006, MNRAS, 365, 245
- (34)
- (35) Gérard, E. & Le Bertre, T. 2003, A&A, 397, L17
- (36)
- (37) Gérard, E. & Le Bertre, T. 2006, AJ, in press (astro-ph/0609022)
- (38)
- (39) Gibson, S. J., Taylor, A. R., Higgs, L. A., & Dewdney, P. E. 2000, ApJ, 540, 851
- (40)
- (41) Glassgold, A. E. & Huggins, P. J. 1983, MNRAS, 203, 517
- (42)
- (43) Gregory, P. C. & Seaquist, E. R. 1974, Nature, 247, 532
- (44)
- (45) Greisen, E. W. & Liszt, H. S. 1986, ApJ, 303, 702
- (46)
- (47) Guélin, M., Lucas, R., & Neri, R. 1996, in CO: Twenty-Five Years of Millimeter-Wave Spectroscopy, IAU Symposium 170, ed. W. B. Latter et al., p. 359
- (48)
- (49) Gussie, G. T. & Taylor, A. R. 1995, MNRAS, 273, 801
- (50)
- (51) Habing, H. J. 1996, A&A Rev., 7, 97
- (52)
- (53) Haniff, C. A., Scholz, M., & Tuthill, P. G. 1995, MNRAS, 276, 640
- (54)
- (55) Hartmann, D. & Burton, W. B. 1997, Atlas of Galactic Neutral Hydrogen, (Cambridge University Press: Cambridge)
- (56)
- (57) Hawkins, G. & Proctor, D. 1992, in Mass Loss on the AGB and Beyond, ed. H. E. Schwarz, (Garching: ESO), 461
- (58)
- (59) Hollis, J. M., Kafatos, M., Michalitsianos, A. G., & McAlister, H. A. 1985, ApJ, 289, 765
- (60)
- (61) Hollis, J. M., Michalitsianos, A. G., Kafatos, M., Wright, M. C. H., & Welch, W. J. 1986, ApJ, 309, L53
- (62)
- (63) Hollis, J. M., Pedelty, J. A., & Lyon, R. G. 1997, ApJ, 482, L85
- (64)
- (65) Hollis, J. M., Pedelty, J. A., Forester, J. R., White, S. M., Boboltz, D. A., & Alcolea, J. 2000, ApJ, 543, L81
- (66)
- (67) Huggins, P. J., Olofsson, H., & Johansson, L. E. B. 1988, ApJ, 332, 1009
- (68)
- (69) Johnson, D. R. H. & Soderblom, D. R. 1987, AJ, 93, 864
- (70)
- (71) Josselin, E., Mauron, N., Planesas, P., & Bachiller, R. 2000, A&A, 362, 255
- (72)
- (73) Kafatos, M. & Michalitsianos, A.G. 1982, Nature, 298, 540
- (74)
- (75) Kahane, C. & Jura, M. 1996, A&A, 310, 952
- (76)
- (77) Keene, J., Young, K., Phillips, T. G., Büttgenbach, T. H., & Carlstrom, J. E. 1993, ApJ, 415, L131
- (78)
- (79) Kerschbaum, F. & Oloffson, H. 1999, A&AS, 138, 299
- (80)
- (81) Knapp, G. R. & Bowers, P. F. 1983, ApJ, 266, 701
- (82)
- (83) Knapp, G. R. & Bowers, P. F. 1988, ApJ, 331, 974
- (84)
- (85) Knapp, G. R., Bowers, P. F., Young, K., & Phillips, T. G. 1994, ApJ, 429, L33
- (86)
- (87) Knapp, G. R., Sutin, B. M., Phillips, T. G., Ellison, B. N., Keense, J. B., Leighton, R. B., Masson, C. R., Steiger, W., Veidt, B., & Young, K. 1989, ApJ, 336, 822
- (88)
- (89) Knapp, G. R., Young, K., Lee, E., & Jorissen, A. 1998, ApJS, 117, 209
- (90)
- (91) Lane, W. M. 1999, PhD thesis, Rijksuniversiteit Groningen
- (92)
- (93) Leão, I. C., de Laverny, P., Mékarnia, D., De Medeiros, J. R., & Vandame, B. 2006, A&A, 455, 187
- (94)
- (95) Le Bertre, T. 1997 A&A, 324, 1059
- (96)
- (97) Le Bertre, T. & Gérard, E. 2001, A&A, 378, L29
- (98)
- (99) Le Bertre, T. & Gérard, E. 2004, A&A, 419, 549
- (100)
- (101) Lockman, F. J. 2002, ApJ, 580, L47
- (102)
- (103) Mäkinen, K., Lehton, H. J., Vainio, R., & Johnson, D. R. H. 2004, A&A, 424, 157
- (104)
- (105) Mauron, N. & Huggins, P. J. 2000, A&A, 359, 707
- (106)
- (107) Michalitsianos, A. G., Kafatos, M., & Hobbs, R. W. 1980, ApJ, 237, 506
- (108)
- (109) Morris, M. & Jura, M. 1983, ApJ, 264, 546
- (110)
- (111) Nakashima, J. 2006, ApJ, 638, 1041
- (112)
- (113) Neri, R., Kahane, C., Lucas, R., Bujarrabal, V., & Loup, C. 1998, A&AS, 130, 1
- (114)
- (115) Perley, R. A. & Taylor, G. B. 2003, VLA Calibration Manual
- (116) (http://www.vla.nrao.edu/astro/calib/manual/index.shtml)
- (117)
- (118) Perrin, G., Coudé du Foresto, V., Ridgway, S. T., Mariotti, J.-M., Traub, W. A., Carleton, N. P., & Lacasse, M. G. 1998, A&A, 331, 619
- (119)
- (120) Perryman, M. A. C. et al. 1997, A&A, 323, L49 (The Hipparcos Catalogue)
- (121)
- (122) Reid, M. J. & Menten, K. M. 1997, ApJ, 476, 327
- (123)
- (124) Rodríguez, L. F., Gómez, Y., & López, J. A. 2000, RMxAA, 36, 51
- (125)
- (126) Rodríguez, L. F., Goss, W. M., & Williams, R. 2002, ApJ, 574, 179
- (127)
- (128) Rodríguez, L. F. & Moran, J. M. 1982, Nature, 299, 323
- (129)
- (130) Seaquist, E. R., Taylor, A. R., & Button, S. 1984, ApJ, 284, 202
- (131)
- (132) Schneider, S. E., Silverglate, P. R., Altschuler, D. R., & Giovanardi, C. 1987, ApJ, 314, 572
- (133)
- (134) Schöier, F. L., Lindqvist, M. & Olofsson, H. 2005, A&A, 436, 633
- (135)
- (136) Skinner, C. J., Meixner, M., & Bobrowsky, M. 1998, MNRAS, 300, L29
- (137)
- (138) Sopka, R. J., Herbig, G., Michalitsianos, A. G., & Kafatos, M. 1982, ApJ, 258, L35
- (139)
- (140) Spergel, D. N., Giuliani, J. L. Jr., & Knapp, G. R. 1983, ApJ, 275, 330
- (141)
- (142) Taylor, A. R. & Pottasch, S. R. 1987, A&A, 176, L5
- (143)
- (144) Taylor, A. R., Gussie, G. T., & Goss, W. M. 1989, ApJ, 340, 932
- (145)
- (146) Taylor, A. R., Gussie, G. T., & Pottasch, S. R. 1990, ApJ, 351, 515
- (147)
- (148) Uson, J. M. & Matthews, L. D. 2003, AJ, 125, 2455
- (149)
- (150) van der Veen, W. E. C. J., Huggins, P. J., & Matthews, H. E. 1998, ApJ, 505, 749
- (151)
- (152) Villaver, E., García-Segura, G., & Manchado, A. 2002, ApJ, 571, 880
- (153)
- (154) Villaver, E., García-Segura, G., & Manchado, A. 2003, ApJ, 585, L49
- (155)
- (156) Vinković, D., Blöcker, T., Hofmann, K.-H., Elitzur, M., & Weigelt, G. 2004, MNRAS, 352, 852
- (157)
- (158) Wallerstein, G. & Greenstein, J. L. 1980, PASP, 92, 275
- (159)
- (160) Wang, L., Baade, D., Höflick, P., Wheeler, J. C., Kawabata, K., & Nomoto, K. 2004, ApJ, 604, L53
- (161)
- (162) Wilson, R. E. 1953, General Catalogue of Stellar Radial Velocities, Carnegie Inst. Washington D. C. Publ. 601, 0
- (163)
- (164) Winters, J. M., Le Bertre, T., Jeong, K. S., Nyman, L.-Å., & Epchtein, H. 2003, A&A, 409, 715
- (165)
- (166) Young, K. 1995, ApJ, 445, 872
- (167)
- (168) Young, K., Phillips, T. G., & Knapp, G. R. 1993a, ApJ, 409, 725
- (169)
- (170) Young, K., Phillips, T. G., & Knapp, G. R. 1993b, ApJS, 86, 517
- (171)
- (172) Zuckerman, B., Terzian, Y., & Silverglate, P. 1980, ApJ, 241, 1014
- (173)