A comparison among LBGs, DRGs and BzK galaxies: their contribution to the stellar mass density in the GOODS-MUSIC sample
Abstract
Context. The classification scheme for high redshift galaxies is complex at the present time, with simple colour selection criteria (i.e. EROs, IEROs, LBGs, DRGs, BzKs), resulting in ill-defined properties regarding stellar mass and star formation rate for these distant galaxies.
Aims. The goal of this work is to investigate the properties of different classes of high-z galaxies, focusing in particular on the Stellar Masses of LBGs, DRGs and BzKs, in order to derive their contribution to the total mass budget of the distant Universe.
Methods. We have used the GOODS-MUSIC catalog, containing 3000 Ks–selected (10000 z–selected) galaxies with multi-wavelength coverage extending from the U band to the Spitzer m band, with spectroscopic or accurate photometric redshifts. We have selected samples of BM/BX/LBGs, DRGs and BzK galaxies, discussed the overlap and the limitations of these criteria, which can be overcome with a selection criterion based on physical parameters. We have then measured the stellar masses of these galaxies and computed the Stellar Mass Density (SMD) for the different samples up to redshift .
Results. We show that the BzK-PE criterion is not optimal to select early type galaxies at the faint end. BzK-SF, on the other hand, is highly contaminated by passively evolving galaxies at red colours. We find that LBGs and DRGs contribute almost equally to the global SMD at and in general that star forming galaxies form a substantial fraction of the universal SMD. Passively evolving galaxies show a strong negative density evolution from redshift 2 to 3, indicating that we are witnessing the epoch of mass assembly of such objects. Finally we find indications that pushing the selection to deeper magnitudes, the contribution of less massive DRGs could overcome that of LBGs. Deeper surveys, like the HUDF, are required to confirm this suggestion.
Conclusions.
Key Words.:
Galaxies:distances and redshift - Galaxies: evolution - Galaxies: high redshift - Galaxies: fundamental parameters - Galaxies: mass function1 Introduction
Until recently, the Lyman drop-out technique was the only selection criterion used to identify large numbers of galaxies at in deep optical surveys (Madau et al. (1996); Steidel et al. (2003)). This technique is effective in finding star forming galaxies, characterised by a typical blue spectrum with reduced dust absorption, the so called Lyman Break Galaxies (LBGs). In recent years, with the availability of large IR detectors at 4-8 meter class telescopes, the ISO and Spitzer data in the medium IR and the SCUBA observations, new types of high-z galaxies have been identified, with spectral energy distributions (SED) and physical properties (Age, Mass, SFR, dust content) different from the “classical” LBG population. Among them, it is worth reminding the sub-mm galaxies (Smail et al. (2004)), the distant red galaxies (DRGs, Franx et al. (2003); van Dokkum et al. (2003)), Extremely Red Objects (EROs, McCarthy (2004); Daddi et al. (2000)), IRAC Extremely Red Objects (IEROs, Yan et al. (2004)) and the “BzK” galaxies (Daddi et al. (2004)). The aim of these different selection criteria is to find objects that could be missed by the Lyman Break technique, due to the presence of an evolved stellar population (dead and massive objects) or a young stellar population heavily obscured by dust at high redshift (dusty starbursts).
While the LBG selection identifies galaxies according to their less obscured star formation properties based on UV rest frame colours, EROs, DRGs, IEROs and BzK selection criteria include also optical rest frame colours, which are less affected by recent SF episodes, but are much more sensitive to the light coming from lower-mass longer-lived stars. Another advantage of the selection from the near-IR is that the rest frame optical light is less affected by dust extinction. However it is not yet clear how these different types of galaxies overlap and what are the galaxies that dominate the number counts and the mass density budget at high redshift.
Using different SFR indicators, Reddy et al. (2005) and Reddy et al. (2006) discussed the properties of LBGs, DRGs and BzK galaxies in the redshift range from the GOODS-North survey, and found a strong overlap (70-80%) between LBG and BzK galaxies, when the analysis is restricted to a Ks–selected sample.
LBGs, DRGs and BzKs present a similar SFR distribution as a function of the Ks magnitude, the M/L ratio of DRG and BzK galaxies (both massive and dusty) are larger than LBGs, but their stellar mass does not exceed the range spanned by optically selected galaxies. Previous studies (Adelberger et al. (2004); Shapley et al. (2005)) point to a similarity in the metallicities, clustering and stellar masses of optical and near-IR selected galaxies at . Indeed, Reddy et al. (2005) concluded that the presence or absence of star formation may be the only significant difference between optical and near-IR selected massive galaxies (), and the difference in SFR may be temporal, i.e. due to a phenomenon of transient SF activity. On the other hand, Quadri et al. (2006) have studied the clustering properties of K-selected galaxies at in the MUSYC survey and found that their correlation length does not depend on the K band magnitude, but it increases strongly both with and with colours. This suggests that K-bright blue galaxies and K-bright red galaxies are fundamentally different, at least in the clustering properties and hence on their host halo mass.
Recently, van Dokkum et al. (2006) compared the DRG and LBG selection criteria at using a K-selected sample ( corresponding to ), finding that DRGs make up 69% (77%) of the sample by number (by mass) and LBGs only 20% (17%), with a small overlap between the two groups. The census of the stellar mass density at high redshifts and faint luminosities however is not well sampled in the recent literature as the SFR is, probably due to the lack of a comprehensive database for LBGs, DRGs and BzKs, where accurate redshift measurements and stellar mass estimates are available.
The GOODS-MUSIC sample (Grazian et al. 2006a ) allows to investigate the role of different galaxy types (LBGs, DRGs and BzKs) in the universal stellar mass budget at high redshift. Using this sample we are able to select on the same wide, deep area all galaxy types, verify the effectiveness of different colour criteria in sampling galaxies at high redshifts, study the overlap within the sub-samples and their contribution to the total stellar mass density of the Universe. In this field, the stellar mass function for all galaxy types are already studied (Drory et al. (2005); Caputi et al. (2004); Fontana et al. (2006)), the latter taking advantage of the IRAC-Spitzer data, which are fundamental to derive the stellar mass at higher-z (Papovich et al. (2005); Fontana et al. (2006)). We focus here only on two simple but largely debated questions, i.e. the role of LBGs, DRGs and BzKs to the total stellar mass density of the Universe at , and the comparison between optically selected and near-IR selected samples.
The paper is organised as follows. In Sect.2, we remind the basic feature of our GOODS-MUSIC dataset. In section 3 we describe the selection criteria used to identify LBGs, DRGs and BzK galaxies, the overlap between the samples, the observational limitations and their intrinsic properties. In Section 4, we present the basic results of our analysis, namely the resulting mass density per galaxy type, and its redshift evolution. In Section 5 we discuss the results and derive our conclusions.
All magnitudes are in the AB system (except where otherwise stated) and we adopt the -CDM concordance cosmological model (, and ).
2 The Data
In this work we use the GOODS-MUSIC (GOODS MUlticolour Southern Infrared Catalog) sample, a 14 bands multicolour catalog extracted from the deep and wide survey conducted over the Chandra Deep Field South (CDFS, Giavalisco et al. (2004)), in the framework of the GOODS public survey. The data comprise a combination of images that extend from U to 8.0m, namely U-band data from the 2.2ESO ( and ) and VLT-VIMOS (), the , , and (Z-band) ACS images, the VLT data and the Spitzer data provided by the IRAC instrument at 3.6, 4.5, 5.8 and 8.0 m. The total area of the GOODS-MUSIC database results from the overlap of ACS band and Ks ISAAC images, for a total of 143.2 sq. arcmin., which is covered by 12 bands, most notably the Spitzer ones ( and IRAC). Only the U-VIMOS and H bands have limited extension, of 90.2 and 78.0 sq. arcmin., respectively.
Since the detection mosaics have a complex, inhomogeneous depth and are quite different in the and in the bands, we have divided the whole sample into 6 independent catalogs for the band and in 6 for the Ks band, each with a well defined magnitude limit and area, that we use to compute the stellar mass densities and other statistical properties in this paper. The limiting magnitudes for each area are reported in Table 2 of Grazian et al. 2006a and refer to a 90% completeness. The typical magnitude limit for most of the sample is about and (corresponding to an area of 72 and 99 sq. arcmin., respectively), and extends down to and in limited areas, as described in Grazian et al. 2006a .
The GOODS-MUSIC database contains both a –selected and a –selected catalog. Colours have been measured using a specific software for the accurate “PSF–matching” of space and ground based images of different resolution and depth, that we have named ConvPhot (De Santis et al. 2006). We have cross correlated our catalog with the whole spectroscopic catalogs available to date, from a list of surveys, assigning a spectroscopic redshift to more than 1000 sources. In this work we use a spectroscopic sample that is wider than that presented in Grazian et al. 2006a , thanks to the increased number of spectra publicly available (Vanzella et al. (2006)). Finally, we have applied our photometric redshift code, developed and tested over the years in a series of works (Fontana et al. (2000), Cimatti et al. (2002), Fontana et al. (2003), Fontana et al. (2004), Giallongo et al. (2005), Fontana et al. (2006)), that adopts a standard minimisation over a large set of templates obtained from synthetic spectral models. The comparison with the spectroscopic sample (Grazian et al. 2006a , Grazian et al. 2006b ) shows that the quality of the resulting photometric redshifts is excellent, with a r.m.s. scatter in of 0.03 and no systematic offset over the whole redshift range . The procedures that we adopted to extract this catalog and derive the photometric redshifts are described at length in Grazian et al. 2006a .
The final samples that we adopt here consist of 2931 galaxies down to and 9862 galaxies down to , taking into account the complex magnitude limits of the survey. On the total –selected sample, 815 galaxies (973 for the –selected) have reliable spectroscopic redshifts and the remaining fraction have well trained photometric redshifts.
AGNs and stars are identified first from spectroscopic information. We then distinguish galaxies from stars and AGNs using morphological and photometric information, when spectroscopic data are not available. Point-like sources are selected using the star/galaxy separation flag (s/g) provided by SExtractor (Bertin & Arnouts (1996)) in the band. We tune the selection on known spectroscopic stars, as described in Grazian et al. 2006a . We use photometric information to further check this criterion, using in particular the “BzK” colour criteria of Daddi et al. (2004).
For the purposes of the present work, we will use the –selected catalog to study the properties of DRGs and BzK galaxies, while the LBG sample is derived from the –selected catalog. When discussing the properties of LBGs, we restrict the GOODS-MUSIC sample only to the area covered by deep U-VIMOS observations, since LBGs are selected by means of U, V and I bands. In practise, for LBGs, we use the area of 90.2 sq. arcmin. with U-VIMOS coverage, while for DRGs and BzK galaxies, we use the total GOODS-MUSIC area (143.2 sq. arcmin.).
3 Similarities and differences between LBGs, DRGs and BzK galaxies
We will now compare the various colour criteria used to find high-z galaxies. In particular we will discuss the similarities and differences between LBGs, DRGs and BzK galaxies, to shed light on two important questions, namely the comparison between –selected and –selected samples of galaxies at high redshift, and the relative fraction of different galaxy types in a –selected sample of galaxies.
We remark here that these simple colour criteria (LBGs, DRGs and BzKs) cannot distinguish between passively evolving and evolved galaxies. A passively evolving galaxy is defined as an object where SF has ceased by a time much longer than the typical duration of the SF episodes, while an evolved galaxy has a large population of old stars but can also have recent/on-going star formation. Usually, through simple colour criteria, it is possible only to check for the presence of evolved stellar populations. If the wavelength baseline is extended, as in the case of the GOODS database, it is possible to isolate also true passively evolving galaxies.
3.1 Selection of LBGs, DRGs and BzK galaxies
An efficient method to select unobscured and modestly obscured star forming galaxies at high redshifts is the Lyman break technique, that is effective at , as defined originally by Steidel & Hamilton (1993); Madau et al. (1996); Steidel et al. (1995, 1999). A recent extensions at lower redshift are the so called “BX” galaxies, at and “BM” galaxies, at (Adelberger et al. (2004)). Since the filter set of the GOODS-MUSIC sample is different from the classical adopted by Steidel and collaborators (Steidel et al. (2003)), we have used the following criteria, tuned by a comparison to the photometric redshift distributions:
| (1) |
for LBGs,
| (2) |
for “BX” and
| (3) |
for “BM”.
We have also verified that these criteria are almost equivalent to the original BM/BX/LBG criteria by reproducing for each galaxy in our catalog the synthetic magnitudes of Steidel and collaborators using the best fit spectrum derived by our SED fitting technique. The colour selections used here are also consistent with criteria based on photometric redshifts.
The differences in the filter sets, colour selections and the fact that the BM/BX/LBGs are traditionally selected in the band and not in the band, as in this work, result in a redshift distribution of the BM/BX/LBG galaxies wider than in Adelberger et al. (2004) and Reddy et al. (2005). There is a small sample of BX and LBGs at , due to galaxies at lower redshifts with and colours typical of high-z galaxies. In the following, however, we study the properties of BM/BX/LBGs selected with our colour criteria only at , thus avoiding the contamination from these lower redshifts galaxies. In addition, BM/BX/LBGs were originally relatively bright galaxies, since the historical criterion used was , while in this work the selection is pushed till the nominal completeness of the GOODS-MUSIC sample. Adopting for our BM/BX/LBG sample a fainter limit in a redder band, however, should not introduce further contaminants, since these galaxies are selected for their typical blue optical colours.
When applied to the –selected sample, these colour cut, with the additional constrain for consistency with the classical BM/BX/LBG criteria, selected 166 galaxies with substantial star formation at and , with U-VIMOS magnitude determination: hereafter we will refer to this sample as BM/BX/LBG-Ks. The band, however, is much more appropriate to select star forming galaxies (with low dust extinction), though it is not the best choice for the stellar mass estimate, in particular at high redshifts. Using the same criteria as above, we have therefore selected 1345 galaxies in the band (), and we will refer to this sample as BM/BX/LBG-Z.
Recently, Daddi et al. (2004) proposed a criterion to identify galaxies at , differentiating them between passively evolving (BzK-PE), selected according to the criterion and , and star-forming galaxies (BzK-SF), which can be effectively isolated from lower redshift interlopers and stars through the simple criterion . The advantage of the BzK criterion is that this colour combination is insensitive to extinction since the reddening vector is parallel to the dividing line, as shown in Daddi et al. (2004). This technique reveals particularly efficient for sampling the dusty side of star forming galaxies at intermediate/high redshifts. Using the BzK selection criteria, we have extracted 89 BzK-PE and 747 BzK-SF galaxies down to the conservative completeness limits of the survey, described in Section 2 and in Grazian et al. 2006a .
Finally we focus on the so-called Distant Red Galaxies (DRGs, Franx et al. (2003)). These galaxies are selected through the (vega) criteria, originally designed to be sensitive to galaxies with large 4000 Å and/or Balmer breaks at . These features become strong for ages larger than 1 Gyr, even if they are also sensitive to the metallicity of galaxies (Poggianti & Barbaro (1997); Kauffmann et al. (2002)). The presence of a Balmer and/or 4000 Å break can thus be an indication of an evolved stellar population. It turned out also that this single colour selection is sensitive both to evolved galaxies and to dusty starbursts at , as shown in Forster Schreiber et al. (2004); Papovich et al. (2005) and Grazian et al. 2006b . DRGs thus appear to be a mixed/composite sample. The DRGs in the GOODS-South sample are already well studied (Papovich et al. (2005); Grazian et al. 2006b ): we select 179 galaxies of this type down to , which span a large redshift range .
In Fig. 1 we show typical SED of an LBG, a DRG, a BzK-SF and a BzK-PE galaxy.

3.1.1 The number density of LBGs, DRGs and BzK galaxies in the GOODS South field
The area of the GOODS South field is relatively large compared to the deep pencil beam surveys like the two Hubble Deep Fields and the Hubble Ultra Deep Field, but it is still limited and therefore subject to cosmic variance, as demonstrated by the prominent peaks in the spectroscopic redshift distribution (Vanzella et al. (2006)). It is also known that the number density of X-ray sources in the GOODS-South is lower compared to other deep X-ray surveys, i.e. the Chandra Deep Field North at faint fluxes and hard energy band (2-8 keV, Brandt & Hasinger (2005)), and there are claims that this underdensity extends to optically/NIR normal galaxies.
We have derived the number densities of BM/BX/LBGs, DRGs and BzK galaxies in the GOODS South and compared them to the densities obtained by large (but shallower) area surveys, in order to verify if GOODS-MUSIC is a representative sample.
In their 0.81 sq. deg. survey, Adelberger et al. (2004) found that at the number densities of BM, BX and LBGs are 3.28, 4.82 and 1.70 galaxies per sq. arcmin., respectively. For comparison, in the GOODS-MUSIC sample our criteria for BM, BX and LBGs select 3.35, 5.64 and 2.22 galaxies per sq. arcmin., at a limiting magnitude of , and 111The colour of BM/BX/LBGs changes with redshifts, galaxies becoming redder at lower redshifts., respectively. If we limit our BM/BX/LBGs at the number densities are 3.22, 4.40 and 1.70 galaxies per sq. arcmin. and therefore agree much better with those of Adelberger et al. (2004).
Recently, Quadri et al. (2006) found 0.89 DRGs per sq. arcmin. at ; in the GOODS-MUSIC sample at the same magnitude limit the number density is similar, with 0.80 DRGs per sq. arcmin. Indeed, the DRG counts in the GOODS South is consistent with that derived in deeper surveys, like FIRES, as shown in Grazian et al. 2006b .
The seminal work for the BzK selection criteria by Daddi et al. (2004) is based on the K20 survey (a subset of the GOODS-South field) and the number densities of BzK-SF and BzK-PE at are 0.91 and 0.22 galaxies per sq. arcmin., respectively. In a larger field, Kong et al. (2006) found, at the same magnitude limit, 1.20 and 0.38 , respectively. In the GOODS-MUSIC sample, at the same magnitude limit, the BzK-SF galaxies have a slightly lower number density (0.77), while the BzK-PE counts are consistent (0.39) with the larger area survey of Kong et al. (2006).
An independent estimate of the number densities for BzK galaxies is provided by Reddy et al. (2006): in the GOODS-North the number densities are 3.1 and 0.24 for BzK-SF and BzK-PE, respectively, at . In the GOODS-MUSIC sample at this deeper magnitude cut, the densities are comparable or slightly higher, with 3.2 and 0.65 galaxies per sq. arcmin. for BzK-SF and BzK-PE, respectively. The large variation in number density for the BzK-PE sample is due probably by the large angular clustering of this evolved population and the limited area which is more sensitive to the field-to-field variations.
We thus confirm that the GOODS-South region is not underdense at intermediate/high redshifts () and, though affected by cosmic variance, it is representative of the general properties of the distant Universe.
3.2 The overlap between samples
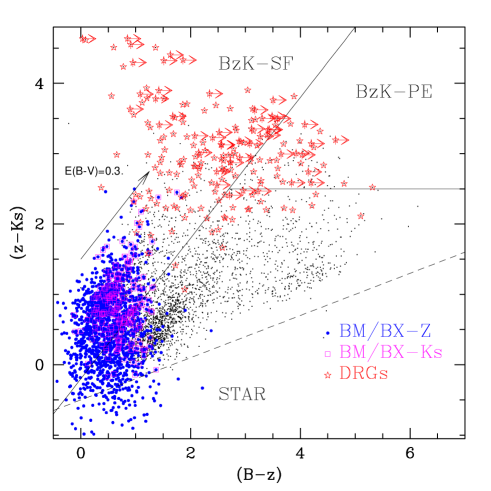
Fig. 2 shows the distribution of BM/BXs and DRGs in the vs diagram. In the BzK plot the loci of star-forming (BzK-SF) and passively evolving galaxies (BzK-PE) are separated by the diagonal line.
| Sample | DRG | BzK-PE | BzK-SF | BM/BX-Ks | BM/BX-Z |
|---|---|---|---|---|---|
| DRG | 78 | 5/78 (6%) | 72/78 (92%) | 2/78 (3%) | 1/78 (1%) |
| BzK-PE | 5/37 (14%) | 37 | 0/37 (0%) | 0/37 (0%) | 0/37 (0%) |
| BzK-SF | 72/327 (22%) | 0/327 (0%) | 327 | 123/327 (38%) | 121/327 (37%) |
| BM/BX-Ks | 2/124 (2%) | 0/124 (0%) | 123/124 (99%) | 124 | 122/124 (98%) |
| BM/BX-Z | 1/913 (0.1%) | 0/913 (0%) | 121/913 (13%) | 122/913 (13%) | 913 |
All the samples are restricted to the area covered by U-VIMOS in order to select BM and BX galaxies and limited for all galaxy type to where the BzK criterion is efficient. The BM/BX-Ks sample represents galaxies in the –selected database which resemble BM or BX colour criteria, while BM/BX-Z refers to the –selected sample. The diagonal of the matrix indicates the total number of galaxies selected for each type. It is useful to remind that the BM/BX-Z sample is –selected, and thus cannot be compared directly with the –selected samples, but it is useful only as reference.
In Table 1 we report the overlap between different populations: these samples are restricted to the area covered by U-VIMOS and limited for –selected galaxy at , in order to compare homogeneous classes. We add to Tab.1 the BM/BX galaxies that are –selected, for the sake of completeness.
Clearly, DRGs and BM/BXs are quite orthogonal as selection criteria, with a very small overlap of only 2 (out of 78 DRGs and 124 BM/BXs) galaxies in common between them.
On the other hand there is significant overlap between BzK and the BM/BX or DRG criteria:
-
•
The BzK-SF has overlap both to DRGs ( presumably their subset of dusty star forming galaxies) and BM/BXs ( less obscured star forming galaxies): we can therefore conclude that it is a good selection criterion for star forming galaxies, and quite complete, regardless of dust obscuration properties.
The fraction of BM/BX galaxies which are also BzK-SF is 99%, while the fraction of BzK-SFs that are also BM/BXs is 38%. Thus, BM/BX can be seen as a subsample (less obscured) of typical starforming galaxies, represented by the BzK-SF class. This result is slightly comparable to that of the GOODS-North field where Reddy et al. (2005) found an overlap of between BM/BX galaxies and BzK-SF at , based on a –selected sample: the overlapping fraction also increases towards fainter galaxies.
-
•
The DRG population has overlap with all other selection criteria, with a predominance of BzK-SF. Indeed, DRGs are a mix of two populations, where star-forming galaxies strongly obscured by dust and massive/evolved galaxies coexist, and possibly share both these properties. It is well known (Papovich et al. (2005); Grazian et al. 2006b ) that low-z DRGs are mainly galaxies caught in their dusty starburst phase, which have thus distinct SF properties in respect to passively evolving galaxies. The high-z DRG subset, instead, is a mix of dusty starburst and evolved massive galaxies, as shown by recent deep IR spectroscopy (Kriek et al. (2006)).
Note however that a number of DRG galaxies that lay in the upper left part of the BzK plot, only have limits in the B-z colour. Therefore it remains unclear whether they would still lay in the BzK-SF locus or migrate to the BzK-PE area if deeper B-band data were added. In the next section we will discuss these observational limitations in more detail.
-
•
Among the BzK-PE galaxies, 14% are also DRGs, as one would expect that evolved galaxies are also selected by the Balmer and/or 4000 Å break criterion. However, a lot are not DRGs: from an inspection of their SED, we find that these objects are all evolved galaxies, with a Balmer and/or 4000 Å break at redshift smaller than 2, or with a colour just below the defining DRG cut. Indeed, also Reddy et al. (2005), based on a spectroscopic selected sample, find that the redshift distributions of BzK-PE galaxies and DRGs have very little overlap.
The BzK-PE criterion is orthogonal to methods selecting star forming galaxies, thus it is not contaminated by obscured starbursts mimicking the colour of a red/evolved galaxy. It is therefore an effective criterion to find evolved galaxies at , although as we will discuss in the next section, it is highly incomplete mainly due to observational limitations.
3.3 Observational limitations of LBG, DRG and BzK criteria
In Figure 2 there are a few star forming galaxies selected by the BM/BX-Ks criteria which stand below the line222 Clearly, the number of –selected BM/BX galaxies below the colour cut is much higher. This is better shown in the colour figure where the BM/BX-Z and BM/BX-Ks samples are clearly distinguished.. This seems to indicate a small incompleteness of the BzK-SF selection towards star-forming galaxies with low extinction, as confirmed by recent VIMOS spectroscopy for a large () sample of galaxies in the GOODS-South field (Popesso (2006)). However, part of the effect is also due to the different redshift interval of the two samples, for the BzK-SF and for the BM/BX criterion.
As noted in the previous Section, most DRGs lay in the locus of BzK-SF galaxies, with only a small fraction falling in the BzK-PE selection area. However when we analyse the galaxies individually we find several DRGs with very red colour and upper limit in the band in the locus of BzK-SF, whose SEDs are better fit by an evolved galaxy at redshift . In agreement with Fig. 12 of Reddy et al. (2005), we find that in the BzK diagram the locus proposed by Daddi et al. (2004) for evolved galaxies is not well defined, when considering galaxies with very red colours. A motivation for this effect is the lack of band deep enough to provide a good diagnostic when very red galaxies in are considered. Daddi et al. (2004) in fact used this photometric criterion on the K20 sample, with Ks-band magnitude limited at and taking advantage of the relatively deep B-band image provided by GOODS. When fainter galaxies in the Ks-band are included, as in this work, the BzK criterion starts to be ineffective in isolating early type galaxies at high redshifts, as discussed also in Reddy et al. (2005) and Renzini (2006). In addition, few galaxies with detection in the B band and very red colour are also better fit by evolved galaxy SED, suggesting that there is an intrinsic mix of star-forming and evolved galaxies at . This is predicted also by Daddi et al. (2004), who in Fig. 8 show that galaxies with high formation redshift () and relatively short e-folding time of the star formation, at redshift fall in the BzK-SF region before migrating to the BzK-PE region at . We have checked some of our evolved galaxies in the BzK-SF region and they have indeed very high formation redshift and (or spectroscopic when available).
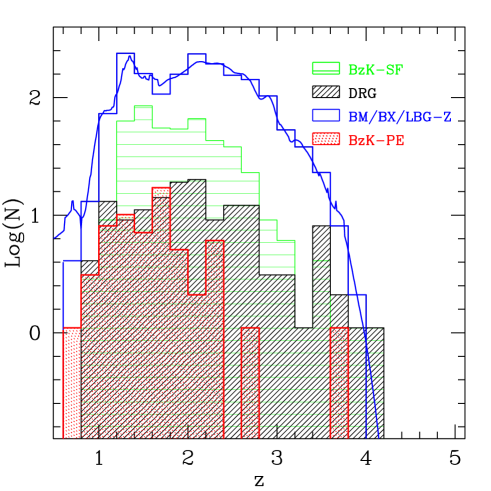
In Fig. 3 we show the photometric redshift distribution of BM/BX/LBGs (–selected), DRGs, BzK-SF and BzK-PE galaxies, all limited to the area covered by U-VIMOS observations. When available, spectroscopic redshifts are used. In this plot there are BzK-SF galaxies at , even if the BzK criterion should be efficient in the range . A detailed analysis of the SED and physical parameters of these objects indicates that they are almost all evolved galaxies with the Balmer and/or 4000 Å break falling between the J and the Ks band, thus resembling the DRG criterion. In the BzK diagram they occupy the DRG locus with extreme colour in .
The photometric redshift distribution shown in Fig. 3 is quite different from that shown by Reddy et al. (2005), since photometrically selected DRGs and BzK-SFs show a wider redshift range than spectroscopically selected ones. These differences probably arise because of the limitation of the spectroscopic redshifts, which are biased toward optically bright objects and can depend on the instrumentation used to obtain the spectrum and to the spectral type of the galaxy. In addition, part of the effect could be due to field-to-field variance, which is not negligible even with the volumes covered by the GOODS survey.
In summary, we have carried out a detailed comparison between the LBG, DRG and BzK selection criteria. The selection of galaxies according to the LBG criterion is sensitive only to the moderately obscured SF galaxies, missing the dusty starburst objects (60% of star forming galaxies at ). DRGs, instead, are less sensitive to dust obscuration effects, but comprises a mix of two populations, the old/evolved galaxies and the dusty starbursts at intermediate/high redshifts. The BzK criterion is highly efficient in the redshift range , but when galaxies start to become faint, it is critical to distinguish between star-forming and evolved galaxies, resulting in an underestimation of the passively evolving population.
3.4 Intrinsic properties
To overcome the limitations of LBG, DRG and BzK selection criteria, which are based simply on observed colours, we use another approach based on spectral fitting technique.
The spectral fitting technique adopted here is the same that has been developed in previous papers (Fontana et al. (2003, 2004); Grazian et al. 2006a and Fontana et al. (2006)), and similar to those adopted by other groups in the literature (e.g. Dickinson et al. (2003), Drory et al. (2004)). Briefly, it is based on the comparison between the observed multicolour distribution of each object and a set of templates, computed with standard spectral synthesis models (Bruzual & Charlot 2003 in our case), and chosen to broadly encompass the variety of star–formation histories, metallicities and extinction of real galaxies. To compare with previous works, we have used the Salpeter IMF, ranging over a set of metallicities (from to ) and dust extinction (, with a Calzetti or a Small Magellanic Cloud extinction curve). Details are given in Table 1 of Fontana et al. (2004). For each model of this grid, we have computed the expected magnitudes in our filter set, and found the best–fitting template with a standard normalisation. The stellar mass and other best–fit parameters of the galaxy, like SFR, age, (the star formation e-folding timescale), metallicity and dust extinction, are fitted simultaneously to the actual SED of the observed galaxy. The redshift of each galaxy is fixed during the fitting process to the spectroscopic or photometric redshift derived in Grazian et al. 2006a . Clearly, this approach requires the availability of spectroscopic or photometric redshifts of good quality, in order to derive precisely rest frame properties for these galaxies.
We define passively evolving galaxies according to the physical criterion . This quantity is in practice the inverse of the Scalo parameter and a ratio of 4 is chosen as an arbitrary value to distinguish galaxies with pure evolved stellar populations from galaxies with recent episodes of star-formation. Moreover, an corresponds to a residual SFR 2% of the initial SFR, for an exponential star formation history, as adopted in this paper. We have checked that around this typical value galaxies at show a prominent 4000 Å and Balmer break, the typical signatures of an emerging old stellar population.
The two parameters used in this context, the ratio and the stellar mass, are subject to uncertainties and biases related to the synthetic libraries used to carry out the fitting of the galaxy SEDs, as we discuss here. In addition, the stellar mass generally turns out to be the least sensitive to variations in input model assumptions, and the extension of the SEDs to mid-IR wavelengths with IRAC tends to reduce the formal uncertainties on the derived stellar masses, as shown in Fontana et al. (2006).
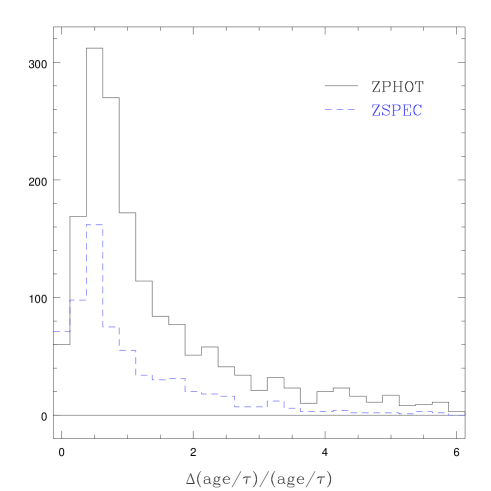
The uncertainties in the ratio are derived as follows: we compute the confidence level on each estimate of and parameters by scanning the levels, allowing the redshift to change in case of objects with photometric redshifts. The typical uncertainty, shown in Fig. 4, for the parameter is of the order of 50%, while the uncertainty for the mass estimate within the GOODS-MUSIC sample is 40%. Though the age and parameters are individually poorly constrained and highly degenerate, the ratio is comparatively better constrained.
Using the criterion based on the ratio on our Ks selected sample, we identify 130 passively evolving galaxies () in the redshift range . Analogously, we find 508 young star forming galaxies (defined by the criterion ) in the same redshift range.
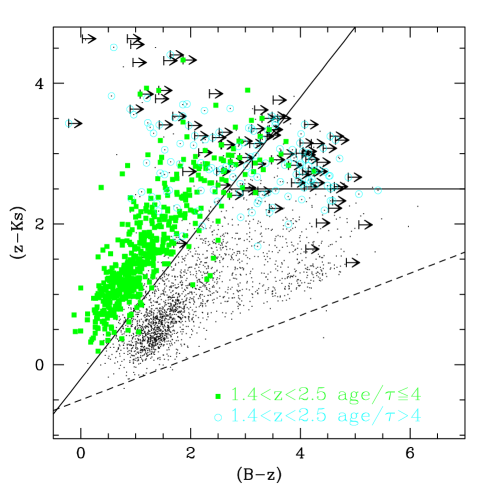
Fig. 5 compares these galaxies selected through the index with those identified by the BzK-PE and BzK-SF criteria. It is clear from this plot that the BzK and criteria are largely consistent. In particular the BzK-SF criterion is very effective in recovering the starburst phase of galaxies at since it is able to select the large majority (94%) of galaxies with . On the other hand the BzK-PE criterion is more incomplete (34%), since it misses a great fraction of passively evolving galaxies, having , especially at faint Ks magnitude limits and for objects with extreme colours, as shown in the previous section. In this case, the DRG criterion turns out to have enhanced completeness in recovering passively evolving galaxies, but also strong contamination from dusty starbursts at . As a further validation of our approach based on the ratio, we have selected all passively evolving galaxies with and in the BzK-SF locus and found one galaxy (ID=9853 in GOODS-MUSIC, ID=139 in K20) with a spectroscopic redshift of from the K20 survey (Mignoli et al. (2005)) without [OII] line in emission and with MgII line in absorption; it is thus consistent with being an evolved galaxy. Other galaxies of this type are fainter, but the spectroscopic identification is at the reach of deep or ultradeep spectroscopy carried out by the GOODS (Vanzella et al. (2006)) and GMASS (Cimatti (2006)) teams in the CDFS field.
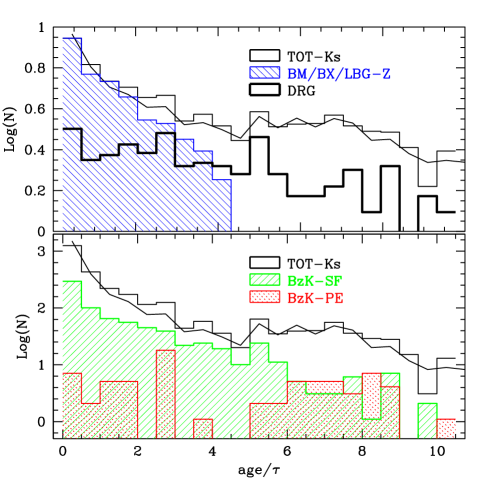
We investigate also the distribution of for different galaxy types. The distribution of the ratio calculated using the probability distribution function of this parameter for each galaxy, is consistent within the uncertainties with the histogram built using the best fit values for each object. This shows that our approach, based on the best fit quantities for are equivalent to results that one would obtain with a Monte Carlo approach. Fig. 6 confirms that BzK-SF and DRG galaxies are mixed populations, and the distribution of the parameters is an extended function, in which the relatively young objects dominate, especially for the BzK-SF class. For DRGs the distribution is less steep, with 110 objects with and 69 objects with . The BM/BX/LBGs are almost all at , confirming that they are predominantly young star forming galaxies, while the BzK-PE class, despite the low statistic, shows a bimodal distribution, with equal populations of young starbursts and passively evolving objects. These facts strengthen our previous conclusions.
Note that from these figures (5 and 6) we infer a posteriori that the value is a good separator since an apparent bimodality is evident in the distribution. In particular, as shown in Fig. 6, the distribution for the Ks–selected galaxies flattens at , indicating that a population of passively evolving galaxies can be isolated with this proposed criterion.
4 The stellar mass and mass density of high redshift galaxies
The contribution of massive galaxies to the stellar mass function at high redshifts has been already discussed by Fontana et al. (2006); Caputi et al. (2006) and McLure et al. (2006). A study of Franceschini et al. (2006), based on detailed morphological analysis with HST of a sample of galaxies detected at 3.6 m in the GOODS-South, indicates that the high mass tail of the stellar mass function at is due mainly to evolved galaxies. It is thus interesting to derive the relative contribution of DRGs and BzK-PEs to the stellar mass density (SMD) at high redshift. To provide a clear comparison, we compute the SMD also for LBGs and BzK-SF galaxies, deriving the contribution of star forming objects to the universal SMD at high-z. Finally, we also derive the mass distribution and mass density for and galaxy samples, and provide a global picture on the SMD for various galaxy types at .
The method that we applied to estimate the galaxy stellar masses is described in Section 3.4. A cautionary note on the stellar mass derivation is necessary here, to remind that it always depends on the assumed star–formation history. As discussed by many authors (e.g. Fontana et al. (2004) and Shapley et al. (2005)), the assumption of an exponential decreasing SFR for all galaxies may provide biases in the estimate of the stellar mass. In particular, it may lead to an underestimate of the contribution of older stellar population in the case of an actively star–forming galaxy, whose luminosity is dominated by the glare of young stars. The advantage of the exponential approach is that it can be compared with many previous estimates. In Fontana et al. (2004) we have shown that it may lead to a maximal underestimate of the stellar mass by a factor of 2, in the most extreme cases. Another approach is the so-called maximally old model, in which the near- and medium-IR SED is fitted with a burst of star formation at , while the UV part of the spectrum is reproduced by a more recent burst. This method recovers a larger stellar mass than that evaluated by the best fit approach, but is based on extreme assumptions, as shown in Fontana et al. (2004), and it is only useful to provide an upper limit to the stellar mass assembled in a galaxy. We finally note that recent papers (Rettura et al. (2006); Erb et al. (2006)) show that the dynamical mass derived from spectroscopy is consistent with the stellar mass derived by the best fit approach, reinforcing the robustness of our method.
4.1 The observed mass distribution of high redshift galaxies
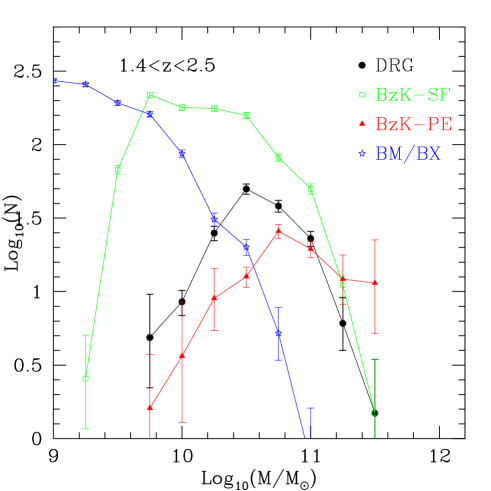
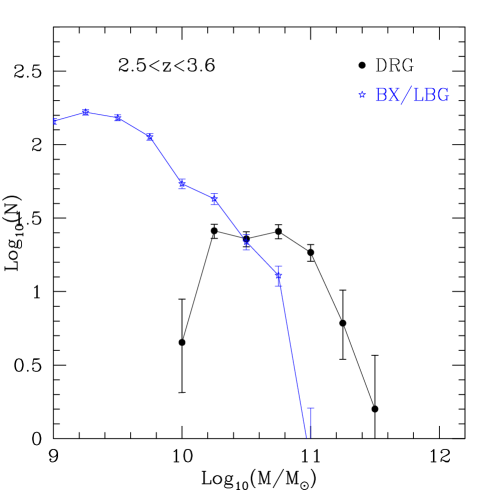
We first present the observed distribution of stellar masses. Fig. 7 (left) represents the distribution of stellar mass (note the logarithmic scale in the y–axis) for BM/BX/LBGs-Z, BzKs and DRGs in the redshift interval , while Fig. 7 (right) refers to the redshift interval . Since the magnitude limit of the GOODS-MUSIC sample is not unique both in z- and in Ks-band, the resulting mass distributions are weighted for the different magnitude limits in the various sub-areas (see Section 2 of this paper and also Grazian et al. 2006a ).
It must be emphasised that the observed distributions do not arise from a mass–limited sample, but rather from magnitude–limited samples (in the or in the –band), and are therefore to be critically used. At high masses, all the samples are complete (in stellar mass): all the conclusions drawn on such samples at high masses are therefore robust. At low masses, two different effects are in place. First, the –selected sample extends to fainter flux levels, and hence lower masses. In addition, even within the –selected samples (DRGs and BzKs), star–forming spectral types extends to lower masses because their typical ratio is lower than those of passively evolving objects333We remind that the stellar mass of each galaxy is derived through the mass-to-light ratio fitted by the spectral synthesis model. Since evolved galaxies and star forming galaxies are characterised by distinct ratios, a given cut in luminosity translates in different cuts in mass for evolved and young stellar populations. As described at length in Fontana et al. (2006), a safe mass threshold, i.e. the mass over which the samples are definitely () complete in stellar mass, may be computed at each redshift using a maximally old, single burst model. When applied to the present –selected sample, it turns out to be at and at . For the BM/BX/LBGs, selected from the band, we do not apply any cut in stellar mass, since the relation between rest frame UV light (redshifted in the optical bands) and the stellar mass is too scattered at these redshifts for this type of galaxies.
The observed mass distributions are also sensitive to the redshift selection function of different galaxy types. This selection function is not known a priori, but from the observed redshift distributions, which are not uniform over , as shown in Fig. 3, it is clear that the selection functions of BzKs, DRGs and BM/BX/LBGs are quite different.
We therefore emphasise that the results of this sub-section are intended to provide a comparison of the contribution of different samples of galaxies as provided by current methods and surveys. A comparison of their overall impact on the global stellar mass density is discussed instead in the following section.
With all these caveats in mind, we can compare the observed distributions of stellar masses. At (Fig. 7, left), the fraction of galaxies at the high-mass tail () is dominated by DRGs and by BzK galaxies (both SF and PE), while LBGs dominate the distribution at lower masses. Current surveys detect an extended tail of low–mass star–forming galaxies (LBGs and BzK-SF) that is missed if the mass budget at high-z is measured only using DRGs. Such galaxies are much more numerous than the higher mass, redder galaxies, and their contribution to the mass budget is not negligible, as we shall discuss in the following. At higher redshifts (Fig. 7, right), the mass distributions of both DRGs and BX/LBGs resemble those at lower redshift, especially in the massive tail.
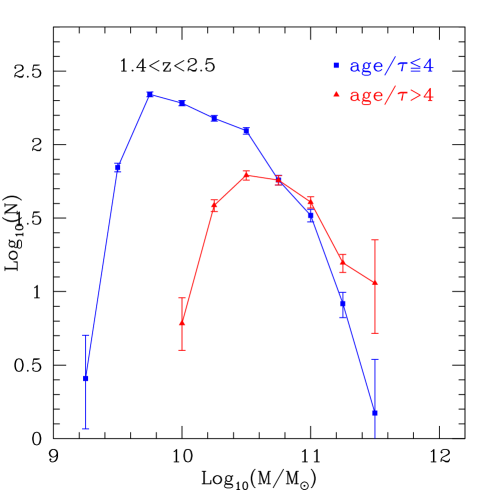
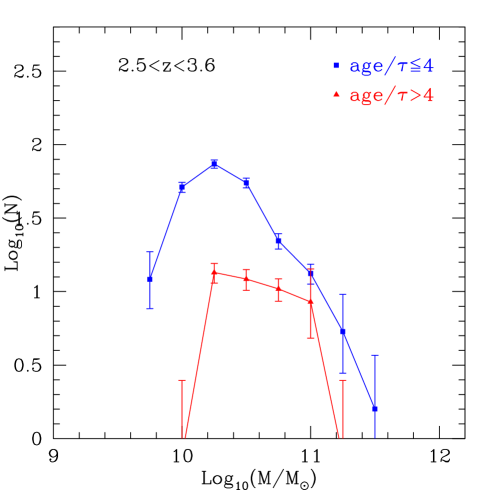
We also investigate the stellar mass distribution according to the parameter: in Fig. 8 we plot the distribution of stellar mass for and galaxies in the redshift range (left panel) and (right panel).
Fig. 8 shows that at and at the passively evolving galaxies are the dominant population, while at the high mass tail is mainly due to star forming galaxies. We are thus witnessing the epoch of mass assembly (“upsizing”) of passively evolving galaxies, confirming the strong density evolution of the Stellar Mass Function for such galaxies at , as shown in Drory et al. (2005); Franceschini et al. (2006) and Fontana et al. (2006). On the other hand, the high mass tail of star forming galaxies () shows no evolution from to , while the low mass distribution experiences a strong negative evolution at higher redshifts, yet an other indication of the so-called “downsizing”.
We finally note that the mass distribution of passively evolving galaxies extends somewhat below the mass cut of the BzK-PE. The fall down of the mass distribution for BzK-PE is indeed due to the selection effect already described in Sect. 3.5, by which the BzK criterion turns out to be incomplete in the selection of passively evolving galaxies at faint magnitudes.
4.2 The stellar mass density of high redshift galaxies
The Stellar Mass Density analysis for high-z galaxies is a more appropriate description than the mass distribution presented in the previous paragraph, since it takes into full account volume effects. In addition, and even more important, it allows to compare the contribution of the different classes of galaxies, as selected with the various methods described here, with the total stellar mass density, as obtained by integrating the stellar mass function at the corresponding redshifts.
The contribution to the total observed SMD at and has been derived by van Dokkum et al. (2006) and is 77% and 17% for DRGs and LBGs, respectively. In a similar way, Rudnick et al. (2006) measured the SMD of DRGs at over different lines of sight and found that these galaxies contribute to 64% of the observed SMD at this redshift.
We compute the contribution to the SMD for LBGs and DRGs in the same mass and redshift range of van Dokkum et al. (2006) and we find that BM/BX/LBGs-Z recover 9% of the total observed SMD, while DRGs make up 64% of the observed SMD. This result agrees quite well with that of van Dokkum et al. (2006) and Rudnick et al. (2006).
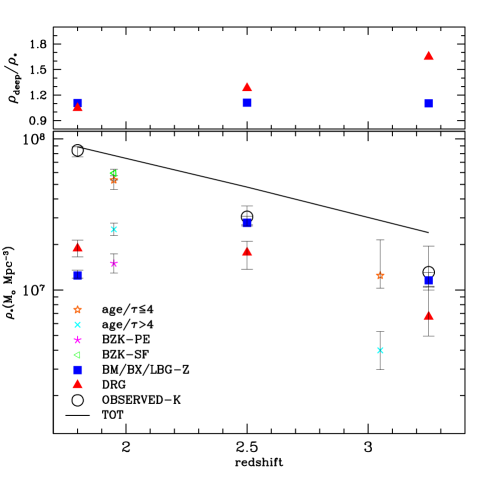
We can expand this analysis using our deeper GOODS-MUSIC catalog: we derive the mass density for DRGs, BzKs and BM/BX/LBGs separately as a function of redshift, and compare it with the observed for the Ks selected sample and with the total value obtained integrating the fitted mass function over the mass range (Fontana et al. (2006)). We then repeat the same analysis on the selected samples.
We have divided the DRGs and BM/BX/LBGs samples in three redshift intervals, following the BM, BX and LBG redshift distributions. The BzK contribution to the stellar mass density is computed only in the redshift interval where the BzK criterion is effective. The selected samples are arbitrarily divided into two redshift intervals, and ; the first redshift bin is chosen so that direct comparison with the BzK criterion is possible, while the second bin is almost identical to the high redshift DRG and LBG redshift distributions as in Fig. 7 and 8. Fig. 9 shows the SMD for DRGs, LBGs and BzK galaxies at different redshifts, while Tab. 2 contains the SMDs for these galaxy types. The error bars of the SMD have been computed with a full Monte Carlo simulation where we take into account the redshift probability distribution for each galaxy in the sample.
These numbers are to be compared with the total mass density obtained by integrating between and the global Galaxy Stellar Mass Function (GSMF) observed in the same GOODS–MUSIC sample (Fontana et al. (2006)). Clearly, these fractions are relatively small since the lower integration limit for the total SMD is far below the observational limits for both the Ks and the z–selected samples. Finally we repeat the same calculations for .
The value of the total (integrated) stellar mass density depends on the slope of the GSMF at the low mass side, which is presently not known at these redshifts. The Schechter slope index is observed to remain considerably flat, changing from at to at (Fontana et al. (2006)). As a first estimate, we shall assume that this trend of slowly decreasing will continue up to (where would be ), as implicit in the Schechter parametric representation of the GSMF provided in Fontana et al. (2006). We shall discuss in the following the impact of releasing this assumption on the slope of the GSMF.
In the first redshift bin, , DRGs recover 21% of the total mass density, similar to the contribution of BM-Z galaxies, that is 14% (see Tab. 2). BzK-SF proves to be a more efficient criterion recovering 75% of the total SMD, while BzK-PE provide around 19% of the total mass density. Consistently with our previous discussion of the relative efficiency of the selection criteria, the BzK criteria turn out to be more efficient than BM-Z or DRGs for deriving the total SMD. Moreover, BzK-SF galaxies contribute to 75% of the total SMD, indicating that at these redshift a considerable fraction of the mass budget can be found in star forming galaxies, possibly obscured by dust.
In the higher redshift bins, BX/LBG-Z galaxies contribute to 58% and 48% of the total SMD at and , respectively, while DRGs recover 37 and 28% in the same redshift intervals. This implies that BX/LBG-Z galaxies cannot be neglected when the total SMD is investigated. Of course, limiting the analysis to the high mass tail of the galaxy mass function, i.e. masses larger than , the contribution of DRGs is predominant, as we can see in the lower part of Tab.2 and in agreement with van Dokkum et al. (2006) and Rudnick et al. (2006).
To further check these results we have derived the contribution of passively evolving and star forming galaxies selected according to the age/ parameter: star forming galaxies provide a considerable fraction of the total mass budget, in particular at redshift 3. The contribution of passively evolving galaxies () at is 32%. At higher redshift the contribution of such galaxies becomes even lower, only 13%.
These results are in practice obtained by integrating the observed mass distributions of Fig. 7 and Fig. 8 (with the proper volume element) and comparing them with the integrated GSMF. As mentioned before, the observed distributions of Fig. 7 and Fig. 8 are biased by selection effects against low mass, red galaxies, while the total SMD depends on the assumed slope of the GSMF. Because of these systematics, it is possible that the observed distributions of Fig. 7 and Fig. 8 are only the results of a selection effect, and that red (or passively evolving galaxies) keep dominating the stellar mass budget even at lower masses, overpredicting the total SMD. This would imply that the slope of the GSMF becomes significantly steeper than what assumed here at high redshift. In the following subsection, we try using the same GOODS–MUSIC data as a first attempt in this direction.
4.3 Looking for faint DRGs in the Ks-band
As discussed above, the DRGs and in general all red galaxies are limited to high masses simply due to their typically higher : pushing our analysis to one magnitude deeper than the actual magnitude limits, it is possible to investigate the existence of a population of faint/low-mass DRGs, whose contribution to the SMD could overcome that of LBGs.
To push the present sample toward lower mass galaxies, we derive the stellar mass density shifting by one magnitude both the actual magnitude limits of the survey, in the z as well as in the Ks bands, (corresponding to 90% completeness all over the GOODS-South field, as described in Section 2). In this case, the distribution is only a lower limit to the number density of galaxies at low masses, while it is well constrained at the high mass tail. If we compute the SMD for LBGs and DRGs using a mass limit 2.5 times lower (corresponding to one magnitude deeper in the z and Ks bands, or alternatively to 75% completeness) than the conservative one, we derive a SMD higher both for LBGs and DRGs, as we expect. The differential increase however is not constant, as shown in Fig. 9 (upper panel), but DRGs gain more ( times) than LBGs in terms of SMD, especially at . This provides an indication for the existence of a numerous population of faint and less massive DRGs than those observed today, although it is still unclear whether they could overcome in number and mass density the contribution of LBGs at high redshift.
The mass distribution of DRGs thus seems to be continuous and not limited to the high mass tail. A survey much deeper than GOODS, like the ultra-deep FIRES Ks-band observation of the HUDF (Beckwith et al. (2003), Labbé et al., in prep.), will probably be able to constrain the number density of low-mass DRGs in this redshift range.
| Sample | |||
|---|---|---|---|
| TOT | 7.947 | 7.681 | 7.380 |
| OBSERVED-Ks | 7.924 | 7.485 | 7.118 |
| DRG | 7.275 | 7.248 | 6.823 |
| BM/BX/LBG-Z | 7.096 | 7.440 | 7.064 |
| BzK-SF | 7.774 | – | |
| BzK-PE | 7.177 | – | – |
| 7.402 | – | 6.601 | |
| 7.728 | – | 7.096 | |
| Type/TOT | |||
| DRG | 0.21 | 0.37 | 0.28 |
| BM/BX/LBG-Z | 0.14 | 0.58 | 0.48 |
| BzK-SF | 0.75 | – | – |
| BzK-PE | 0.19 | – | – |
| 0.32 | – | 0.13 | |
| 0.68 | – | 0.42 | |
| Type/TOT() | |||
| DRG | 0.30 | 0.77 | 0.79 |
| BM/BX/LBG-Z | 0.01 | 0.09 | 0.10 |
| BzK-SF | 0.57 | – | – |
| BzK-PE | 0.37 | – | – |
| 0.55 | – | 0.25 | |
| 0.45 | – | 0.75 |
is the stellar mass density in . The three redshift intervals, , and , correspond to the BM, BX and LBG selection criteria, respectively. is the mass density obtained integrating the stellar mass function between and . The BzK criterion is effective only in the redshift range , and for the higher redshift bins it is not possible to compute its stellar mass density. The SMD for galaxies divided according to their parameter is computed in the redshift intervals and . The total SMD in these redshift ranges are and , and these two quantities are used to compute the relative contribution of BzK galaxies and of objects selected by their ratio.
5 Discussion and Conclusions
In this work we have used the GOODS-MUSIC sample to compare the colour criteria commonly used for selecting high redshift galaxies, and to estimate their contribution to the universal stellar mass budget.
The GOODS–MUSIC sample is particularly suited for this exercise, since it provides a reasonable statistics (nearly 3000 galaxies in the –selected sample and more than 9000 in the –selected one), a 14 bands wavelength coverage that allows a direct application of most colour selection criteria and well tested, accurate photometric redshifts. Most important, it includes the Spitzer observations of the complete data set, that are necessary to provide reliable estimates of the stellar mass for galaxies at relatively high redshift (Fontana et al. (2006)).
We have initially selected samples of BM/BX/LBGs, DRGs and BzK galaxies, discussing the overlap between the various sets and the limitations of each criterion. As expected from previous works, the selection of galaxies according to the BM/BX/LBG criteria is sensitive to moderately obscured star-forming galaxies, missing the dusty starburst objects. DRGs, instead, are less sensitive to dust obscuration effects, but comprise a mix of two populations, the old/evolved galaxies and the dusty starbursts at intermediate/high redshifts. The BzK criterion is highly efficient in the redshift range , but when galaxies start to become faint in the Ks band and red in the colour, it is difficult to distinguish between star-forming and evolved galaxies, resulting in an underestimation of the passively evolving population.
To better separate actively star–forming galaxies from passively evolving ones, we have then applied a physical criterion, based on the ratio between the age of the stellar component and the star–forming timescale, both derived from the best–fitting models applied to the full SED of each galaxy. We show that the ratio age is a relatively well constrained parameter, and we adopt a threshold age to separate passively evolving galaxies from star forming ones.
We have then analysed the observed distribution of stellar masses associated to each selection criterion. At , the fraction of galaxies in the high-mass tail () is dominated by DRGs and by BzK galaxies (both SF and PE), while BM/BX and BzK-SF dominate the distribution at lower masses. The same kind of bimodality is apparently in place at , where DRGs make the high mass tail of the distribution and BX/LBGs the low mass side. Clearly, the lack of red galaxies with low stellar mass results from the selection criteria adopted: since the –selected sample extends to fainter fluxes than the –selected one, and given that the ratio of red galaxies is larger than that of blue galaxies, current samples are biased against the detection of low mass red galaxies.
If we look at the intrinsic properties, it is remarkable that at passively evolving galaxies, selected with , exist in a large number, such that they are slightly dominant at the highest masses () over the star–forming population. However, they show a significant negative evolution with redshift, with a more modest contribution to the high mass tail at . This transition suggests that the epoch from to 3 is crucial in the assembly of passively evolving galaxies.
We have then derived the contribution of each selected sample to the Stellar Mass Density (SMD) at various redshifts. This is compared with the total SMD, as obtained by integrating the Galaxy Stellar Mass Function of Fontana et al. (2006) from to . Such a comparison is based on the assumption that the slope of the Galaxy Stellar Mass Function at high redshift remains relatively flat, as inferred from an the extrapolation of its evolution at lower redshifts (Fontana et al. (2006)). Under this assumption, the overall contribution of BM/BX/LBGs to the total SMD from to is comparable to or even higher than that of DRGs, since they outnumber the DRGs at low masses. Clearly, if only the high mass tail is considered, DRGs are the dominant population. The importance of star forming galaxies is even more noticeable if one considers the BzK-SF sample, which is dominating the SMD at , since it recovers both moderately obscured and dusty young galaxies.
If this picture is correct, it presents a similarity and a difference with the present-day Universe. The similarity is that a bimodality seems to exist, with star–forming galaxies dominating the low mass population and passively evolving galaxies dominating the high mass tail. At variance with the local Universe, however, the integrated contribution of passively–evolving galaxies is lower than that of star–forming ones. These two clues provide a different view of the so called “downsizing” scenario.
However, there is the possibility that a large population of low–mass, intrinsically red galaxies exists, still undetected in current K–selected surveys. Such a population could in principle produce a Galaxy Stellar Mass Function much steeper than assumed here, and would significantly change the relative contribution of different galaxy types to the SMD. Detecting the existence of such a population, and constraining its nature (passively evolving vs. star–forming) would be very important to understand the physical processes in high redshift galaxies, since in theoretical scenarios feedback effects and star–formation histories are strongly dependent on the halo mass. Only much deeper IR–selected surveys will be able to discover whether the contribution of DRG and other red galaxies to the SMD at is actually higher than what observed with present data: DRGs indeed could eventually overcome the BM/BX/LBG SMD when their contribution is integrated till the very low mass tail of the mass distribution.
Acknowledgements.
It’s a pleasure to thank the GOODS Team for providing all the imaging material available worldwide. Observations have been carried out using the Very Large Telescope at the ESO Paranal Observatory under Program IDs LP168.A-0485 and ID 170.A-0788 and the ESO Science Archive under Program IDs 64.O-0643, 66.A-0572, 68.A-0544, 164.O-0561, 163.N-0210 and 60.A-9120. We are grateful to the referee for useful, detailed and constructive comments. AG warmly thanks E. Daddi for useful discussions about the nature of faint red BzK galaxies.References
- Adelberger et al. (2004) Adelberger, K. L., Steidel, C. C., Shapley, A. E., et al. 2004, ApJ, 607, 226
- Baldry et al. (2004) Baldry, I.K., Glazebrook, K., Ivezic, Z., et al. 2004, ApJ, 600, 681
- Beckwith et al. (2003) Beckwith, S. V. W., Caldwell, J., Clampin, M., et al. 2003, AAS, 202, 1705
- Bertin & Arnouts (1996) Bertin, E. & Arnouts, S. 1996, A&AS, 117, 393
- Brandt & Hasinger (2005) Brandt, N. & Hasinger, G. 2005, ARA& A, 43, 827
- Bruzual & Charlot (2003) Bruzual, G., & Charlot, S. 2003, MNRAS, 344, 1000
- Caputi et al. (2004) Caputi, K. I., Dunlop, J. S., McLure, R. J., Roche, N. D. 2004, MNRAS 353, 30
- Caputi et al. (2006) Caputi, K. I., McLure, R. J., Dunlop, J. S., Cirasuolo, M., Schael, A. M. 2006, MNRAS, 366, 609
- Cimatti et al. (2002) Cimatti, A., Daddi, E., Mignoli, M., et al. 2002, A&A, 381, L68
- Cimatti (2006) Cimatti, A., 2006, Mem. SAIT, 77, 703
- Daddi et al. (2000) Daddi, E., Cimatti, A., Pozzetti, L., et al. 2000, A&A, 361, 535
- Daddi et al. (2004) Daddi, E., Cimatti, A., Renzini, A., et al. 2004, ApJ, 617, 746
- De Santis et al. (2006) De Santis, C., Grazian, A., Fontana, A. & Santini, P., 2006, New Astronomy, accepted.
- Dickinson et al. (2003) Dickinson, M., Papovich, C., Ferguson, H.C., Budavari, T. 2003, ApJ, 587, 25
- Drory et al. (2004) Drory, N., Bender, R., Feulner, G., et al. 2004, ApJ, 608, 742
- Drory et al. (2005) Drory, N., Salvato, M., Gabasch., A., et al. 2005, ApJ, 619, L131
- Erb et al. (2006) Erb, D. K., Steidel, C. C., Shapley, A. E., et al. 2006, ApJ, 646, 107
- Fontana et al. (2000) Fontana, A., D’Odorico, S., Poli, F., et al. 2000, AJ, 120, 2206
- Fontana et al. (2003) Fontana, A., Donnarumma, I., Vanzella, E., et al. 2003, ApJ, 594L, 9
- Fontana et al. (2004) Fontana, A., Pozzetti, L., Donnarumma, I., et al. 2004, A&A, 424, 23
- Fontana et al. (2006) Fontana, A., Salimbeni, S., Grazian, A., et al. 2006 A&A in press
- Forster Schreiber et al. (2004) Forster Schreiber, N. M., van Dokkum, P. G., Franx, M., et al. 2004, ApJ, 616, 40
- Franceschini et al. (2006) Franceschini, A., Rodighiero, G., Cassata, P., et al. 2006, A&A, 453, 397
- Franx et al. (2003) Franx, M., Labbé, I., Rudnick, G., et al. 2003, ApJ, 587, L79
- Giallongo et al. (2005) Giallongo, E., Salimbeni, S., Menci, N., et al. 2005, ApJ, 622, 116
- Giavalisco et al. (2004) Giavalisco, M., Ferguson, H. C., Koekemoer, A. M., and the GOODS Team 2004, ApJ, 600, L93
- (27) Grazian, A., Fontana, A., De Santis, C., et al. 2006a, A&A, 449, 951.
- (28) Grazian, A., Fontana, A., Moscardini, L., et al. 2006b, A&A, 453, 507
- Kauffmann et al. (2002) Kauffmann, G., Heckman, T. M., White, S. D. M., et al. 2003, MNRAS, 341, 54
- Kong et al. (2006) Kong, X., Daddi, E., Arimoto, N., et al. 2006, ApJ, 638, 72
- Kriek et al. (2006) Kriek, M., van Dokkum, P., Franx, M., et al. 2006, ApJ, 645, 44
- Labbé et al. (2003) Labbé, I., Franx, M., Rudnick, G., et al. 2003, AJ, 125, 1107
- Madau et al. (1996) Madau, P., Ferguson, H. C., Dickinson, et al. 1996, MNRAS, 283, 1388
- McCarthy (2004) McCarthy, J. P. 2004 ARA& A, 42, 477
- McLure et al. (2006) McLure, R. J., Cirasuolo, M., Dunlop, J. S., et al. 2006, MNRAS, 372, 357
- Mignoli et al. (2005) Mignoli, M., Cimatti, A., Zamorani, G., et al. 2005, A&A, 437, 883
- Papovich et al. (2005) Papovich, C., Moustakas, L. A., Dickinson, M., et al. 2006, ApJ, 640, 92
- Poggianti & Barbaro (1997) Poggianti, B. M. & Barbaro, G. 1997, A&A, 325, 1025
- Popesso (2006) Popesso, P. 2006, poster presented at the conference “Galaxies and Structures through Cosmic Times”, Venice 2006
- Quadri et al. (2006) Quadri, R., van Dokkum, P., Gawiser, E., et al. 2006, astro-ph/0606330
- Reddy et al. (2005) Reddy, N. A., Erb, D. K., Steidel, C. C., et al. 2005, ApJ, 633, 748
- Reddy et al. (2006) Reddy, N. A., Steidel, C. C., Fadda, D., et al. 2006, ApJ, 644, 792
- Renzini (2006) Renzini, A. 2006, ARA& A, 44, 141
- Rettura et al. (2006) Rettura, A., Rosati, P., Strazzullo, V., et al. 2006, A&A, 458, 717
- Rudnick et al. (2006) Rudnick, G., Labbé, I., Forster Schreiber, N. M., et al. 2006, ApJ, 650, 624
- Shapley et al. (2005) Shapley, A. E., Steidel, C. C., Erb, D. K., et al. 2005, ApJ, 626, 698
- Smail et al. (2004) Smail, I., Chapman, S. C., Blain, A. W., and Ivison, R. J., 2004, ApJ, 616, 71
- Steidel & Hamilton (1993) Steidel, C. C. & Hamilton, D. 1993, AJ, 105, 2017
- Steidel et al. (1995) Steidel, C. C., Pettini, M., Hamilton, D., 1995, AJ, 110, 2519
- Steidel et al. (1999) Steidel, C. C., Adelberger, K. L., Giavalisco, M., Dickinson, M., Pettini, M., 1999, ApJ, 519, 1
- Steidel et al. (2003) Steidel, C.C., Adelberger, K. L., Shapley, A. E., et al. 2003, ApJ, 592, 728
- van Dokkum et al. (2003) vanDokkum, P. G., Forster Schreiber, N. M., Franx, M., et al. 2003, ApJ, 587, L83
- van Dokkum et al. (2006) vanDokkum, P. G., Quadri, R., Marchesini, D., et al. 2006, ApJ, 638, 59
- Vanzella et al. (2006) Vanzella, E., Cristiani, S., Dickinson, M., et al. 2006, A&A, 454, 423
- Yan et al. (2004) Yan, H., Dickinson, M., Eisenhardt, P. R. M., et al. 2004, ApJ, 616, 63