The GLARE Survey II. Faint Ly- Line Emitters in the HUDF
Abstract
The galaxy population at has been the subject of intense study in recent years, culminating in the Hubble Ultra Deep Field (HUDF) – the deepest imaging survey yet. A large number of high redshift galaxy candidates have been identified within the HUDF, but until now analysis of their properties has been hampered by the difficulty of obtaining spectroscopic redshifts for these faint galaxies. Our “Gemini Lyman-Alpha at Reionisation Era” (GLARE) project has been designed to undertake spectroscopic follow up of faint () -drop galaxies at in the HUDF. In a previous paper we presented preliminary results from the first 7.5 hours of data from GLARE. In this paper we detail the complete survey. We have now obtained 36 hours of spectroscopy on a single GMOS slitmask from Gemini-South, with a spectral resolution of . We identify five strong Lyman- emitters at , and a further nine possible line emitters with detections at lower significance. We also place tight constraints on the equivalent width of Lyman- emission for a further ten -drop galaxies and examine the equivalent width distribution of this faint spectroscopic sample of galaxies. We find that the fraction of galaxies with little or no emission is similar to that at , but that the population has a tail of sources with high rest frame equivalent widths. Possible explanations for this effect include a tendency towards stronger line emission in faint sources, which may arise from extreme youth or low metallicity in the Lyman-break population at high redshift, or possibly a top-heavy initial mass function.
keywords:
1 Introduction
The Hubble Ultra Deep Field (HUDF, Beckwith et al., 2006) opened a new window on the early universe. The exceptionally deep, multiwavelength data provided opportunities to study colour-selected samples of high redshift galaxy candidates with modest luminosities more typical of the general galaxy population. Previously, only the most luminous ‘tip of the iceberg’ had been accessible. By pushing to redshifts around 6 with the -band filter and the -drop Lyman break selection technique (e.g. Bunker et al., 2004), the HUDF explored the end of the reionization epoch signaled by the Gunn-Peterson HI absorption trough in QSOs (Becker et al., 2001).
Nonetheless, the use of the Lyman break colour selection criterion to isolate star-forming galaxies at a specific redshift, first developed to study galaxies (Steidel et al., 1995) and extended to candidates in analysis of the Great Observatories Origins Deep Survey (GOODS) and HUDF fields (e.g. Stanway et al., 2003; Bouwens et al., 2006), presents challenges. Before the properties of the population can be meaningfully discussed, the selection function itself must be understood. Estimates must be obtained of the contaminant fraction and the redshift distribution of -drop galaxies.
Many colour-selected galaxies are significantly fainter than the conventional spectroscopic limit of today’s large telescopes. The HUDF reaches limits of (10 ) – a depth that, until JWST becomes available, requires unreasonable exposure times to obtain a high signal-to-noise ratio (S/N) spectrum for the continuum. However, line emission (e.g. Lyman-) may be within reach of ultra-deep moderate-dispersion spectroscopy on 8-10 m telescopes even for the faintest galaxies, provided the equivalent width of the line is large enough. If the properties of the star-forming population at are similar to those of the Lyman Break Galaxy (LBG) population at (Steidel et al., 2003), then half the sources are expected to show the resonant Lyman- transition in emission. Detection of a Lyman- emission line fixes the redshift of a source, while detection or constraints on nearby high ionisation emission lines can quantify contribution by an AGN. Furthermore, spectroscopy can enable the identification of lower-redshift contaminants in the sample which will not emit Lyman- photons at these wavelengths, but may show other emission lines. When a population of Lyman- emitters is studied, the distribution of equivalent widths is sensitive to the stellar initial mass function (since the Lyman- transition is excited by emission from hot, massive, short-lived stars), and also to the fraction of neutral gas in the intergalactic medium (IGM) and the emergent photon fraction (Malhotra & Rhoads, 2004b).
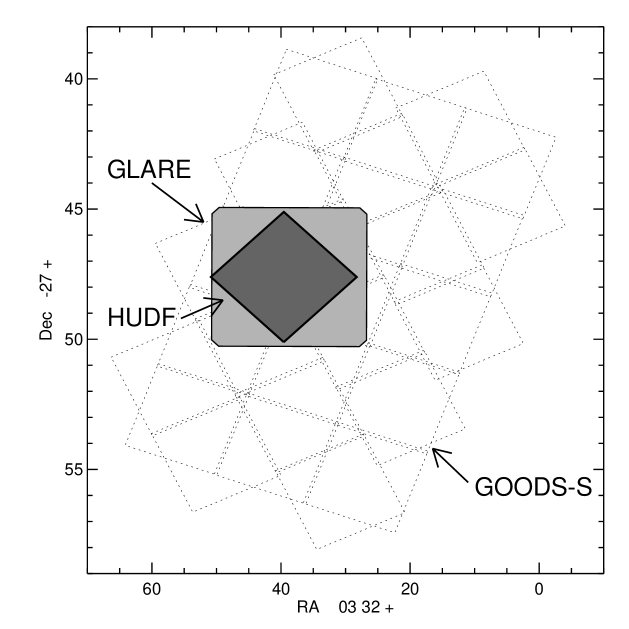
In this paper we present results from the Gemini Lyman-Alpha at Reionisation Era (GLARE) project. This program used the 8-m Gemini South telescope to obtain extremely deep spectroscopy on a single slitmask, centered on the HUDF (Figure 1). By obtaining extremely long exposures using a telescope with a large collecting area, we aimed to study continuum-selected galaxies fainter than those targeted by any other survey, and to quantify the line emission properties of our -drop sample in the HUDF. We presented initial results from this programme in Stanway et al. (2004b, hereafter Paper I), which was based on 7.5 hours of on-source exposure taken at low spectral resolution (). In this paper we present an analysis of the twenty-four -drop selected candidates targeted for 36 hours of spectroscopy at higher resolving power (). In section 2 we describe the GLARE program, and in section 3 we present the results of our observing campaign. In section 4 we analyse the equivalent width distribution of the GLARE line emitters, and in section 5 we discuss the implications of this distribution in the context of other work in this field. Finally in section 6 we present our conclusions.
We adopt the following cosmology: a flat Universe with , and . All magnitudes are quoted in the AB system (Oke & Gunn 1983).
2 The GLARE Project
2.1 Candidate Selection
The objectives of the GLARE project were to determine the redshift and line emission properties of our targets, reaching low equivalent width limits on Lyman- emission for a uniformly-selected sample of -drop Lyman-break galaxies (Stanway et al., 2003; Bouwens et al., 2004; Bunker et al., 2004). The -drop colour selection is sensitive to galaxies at , although the selection sensitivity falls off rapidly above (see Stanway et al. 2003). With this data we aim to probe galaxies at the end of the epoch of reionisation, and compare their properties to comparable galaxy samples at lower redshift, in order to explore possible evolution in the nature of the star-forming galaxy population.
Initial results obtained from this survey were reported in Stanway et al. (2004b), which presented 7.5 hour spectra of three Lyman- line emitters observed on the 2003 GLARE slitmask. Selection of targets for our 2003 observations was made possible by the early release of a list of red sources in the HUDF, based on observations to one third of its final depth, and supplemented by -drop galaxies selected from the shallower, but wider field, GOODS survey of the same region (Stanway 2004).
Between observations of our 2003 GLARE mask, and the start of semester 2004B, the full HUDF data were made public and the GLARE slitmask was redesigned accordingly. Sources with and in the HUDF imaging (i.e. the catalog of Bunker et al., 2004) were assigned the highest priority for spectroscopic follow-up and fifteen such sources were placed on the slitmask. The agreement is excellent between the HUDF -drop discovery catalog of Bunker et al. (2004), which we use as our GLARE source list, and the recent data paper by the HUDF team (Beckwith et al., 2006). All the robust -drops targetted on the GLARE slitmask were are also identified by Beckwith et al.
In order to maximise use of the mask, additional objects were targetted. Seven slits were placed on candidates (including the two emitters identified in Paper I, GLARE 3001 & 3011) from a brighter selection with and , selected from the GOODS imaging (Stanway 2004), primarily at the edges of the slitmask and lying outside the HUDF region. A further three slits were placed on candidates with colours lying marginally outside of our GOODS selection criteria, either in colour (i.e. ) or magnitude (i.e. ), or in noisy regions of the GOODS images, and two slits on sources from the original UDF early release list of red sources that did not meet our final criteria. Two slits were placed on -band dropout candidates, and two on known low redshift [OII] 3727 Å emitters, previously observed by VLT/FORS2 (Vanzella et al., 2006) and used as a check on flux calibration. Finally, five slits were placed on alignment stars to ensure accurate positioning of the mask, and six slits were used to conduct a blank sky survey for serendipitous sources. The composition of the 2004 GLARE slitmask is summarised in table 1.
| ID | No of Slits | Description |
|---|---|---|
| 1XXX | 15 | HUDF, , |
| 2 | HUDF, other red sources | |
| 2XXX | 5 | Alignment Stars |
| 3XXX | 7 | GOODS , |
| 4XXX | 2 | GOODS selected, cands |
| 5XXX | 2 | Known, low z, [OII] emitters |
| 6XXX | 6 | Blanks sky slits |
| 7XXX | 3 | GOODS marginal -drop candidates |
| 42 | Total Number of Slits on Mask |
Both the cut applied in the GOODS data and the cut applied in the HUDF correspond to a signal to noise of approximately 8. We chose to work well above the detection limit in order to have confidence in the reality and nature of our candidate sources (many of which are detected only in this one band). In the event of non-detection in the -band we use the limiting magnitudes (GOODS) and (HUDF) corresponding to 3 variation in the sky background, as measured on the images. All sources were required to be undetected in the available (F435W) imaging but faint detections in the deep (F606W) filter (which lies above the Lyman limit at , and which is present in several spectroscopically confirmed galaxies) were permitted. Completely unresolved sources were omitted from the selection although at faint magnitudes, the dividing line between unresolved and slightly-resolved sources becomes blurred.
Of the line emitter candidates presented in section 3, only GLARE 1042 and GLARE 1040 lie within the NICMOS HUDF field (Thompson et al., 2005). Both have near-infrared colours consistent with a high redshift interpretation, as indeed did all the -drop sources in this field discussed by Stanway et al. (2005).
2.2 Observations and Data Analysis
The 2004 GLARE slitmask was observed in semester 2004B using the GMOS spectrograph on Gemini-South (Hook et al. 2003). This mask was observed at higher spectral resolution than the 2003 GLARE mask, using the GMOS-S R600 grating rather than the R150, blazed at an angle of 48.5 giving a central wavelength of Å. As the CCD over-sampled the typical seeing and spectral resolution, the image was binned at pixels so as to reduce the readout noise and improve the S/N. After this binning, the spectral scale was 0.94 Å/pixel, and 0.146 arcsec/pixel spatially on the detector. The slit width was 1.0 arcsec, which produced a spectral resolution of 6.5 Å FWHM for objects which fill the slit. Both mask and slits were oriented due north. The higher spectral resolution of the 2004 GLARE mask ( compared with for 2003 GLARE) decreases the fraction of the wavelength range adversely affected by OH sky lines, and also enables us to better study the profiles of emission lines from the targets. The OG515 filter was used to suppress second order light from shorter wavelengths. In order to fill CCD chip gaps and ensure full wavelength coverage in the range Å three different central wavelength settings were observed (8580Å, 8700Å and 8820Å). The shortest wavelength reached was 6420Å, while the longest wavelenth surveyed was 10950Å.
Wavelengths were calibrated from the night sky lines in each slit, leading to a solution with an rms error of approximately 0.3Å. Fluxes were calibrated from the broadband magnitudes of the alignment stars on the mask, and checked against both line emission of known [OII] emitters also observed in VLT/FORS2 spectroscopy that had been placed on our mask for verification purposes, and existing spectroscopy for the known Lyman- emitter GLARE 1042 (Stanway et al., 2004b, a; Dickinson et al, 2004). We estimate a 20% error on the flux calibration, associated with slit losses and centroiding uncertainty in the narrow slits.
To optimise the subtraction of night sky emission lines (which occupy a large fraction of the spectrum at Å) we used the instrument in ‘nod & shuffle’ mode (Glazebrook & Bland-Hawthorn, 2001; Abraham et al., 2004). Each exposure was 30 minutes long, nodding every 60 seconds. Hence we are able to suppress sky emission that varies on timescales longer than one minute. The total exposure time on this mask was 36 hours.
The reduction of nod & shuffle data involves the subtraction of positive and negative spectra, observed in alternate 60 second exposures and offset spatially by the telescope nodding. We employed slits 2.47 arcseconds in length, nodding by 1.25 arcseconds between sub-exposures. Our queue scheduled observations were constrained by the requirement that the seeing was less than 0.5 arcseconds FWHM, and the nod distance set such that the signals were separated by at least twice the seeing disk. Hence the characteristic signal of an emission line comprises a ‘dipole’ signal of positive and negative emission at the same wavelength, spatially offset by 1.25 arcseconds. In visually identifying candidate line emitters, we looked for this dipole signature with positive and negative channels of comparable strengths; this requirement effectively increases the sensitivity of the spectroscopy beyond the formal limit, since random background fluctuations are unlikely to produce simultaneous signals in both positive and negative channels.
Dipole signals lying under strong emission sky lines are treated with caution; as well as having more Poisson noise, sky line variability and charge diffusion at the red end of the spectrum may lead to a spurious signal.
A number of charge traps and CCD artifacts were also masked when the individual exposures were combined. These charge traps affect some regions of the CCD more severely than others, and so the noise properties vary from slitlet to slitlet, and also with wavelength. However, the 1 sigma rms pixel-to-pixel variation in the background at 8500Å was erg cm-2 s-1 Å-1 for the binned pixels, measured between skylines on the nod & shuffle background-subtracted spectra. Hence, our sensitivity to an emission line extending over 500 km s arcsec is erg cm-2 s-1 ( combining both nod positions, or per nod channel).
3 Line Emitters in the 2004 GLARE Mask
In the 36 hour exposure of the 2004 GLARE mask, we identify five strong Lyman- emission line sources (including the three candidates tentatively proposed in Stanway et al., 2004b). We identify a further four sources which have lower significance detections, but which are considered possibly to be real emission lines due to their dipole natures and separation from possible sky line residuals. Finally we identify five sources with tentative emission line detections that are considered unlikely to be real.
3.1 Strong Emission Lines
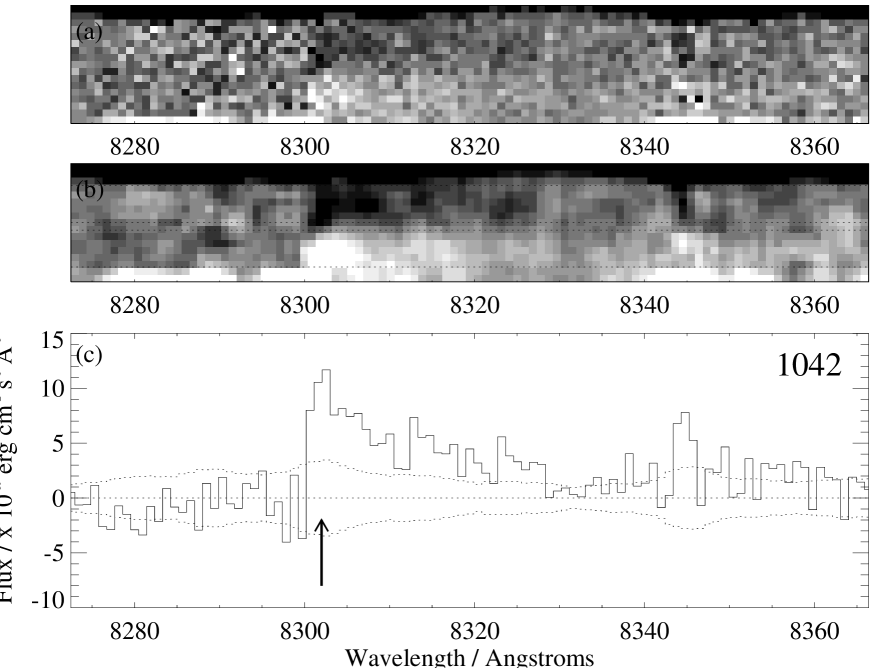
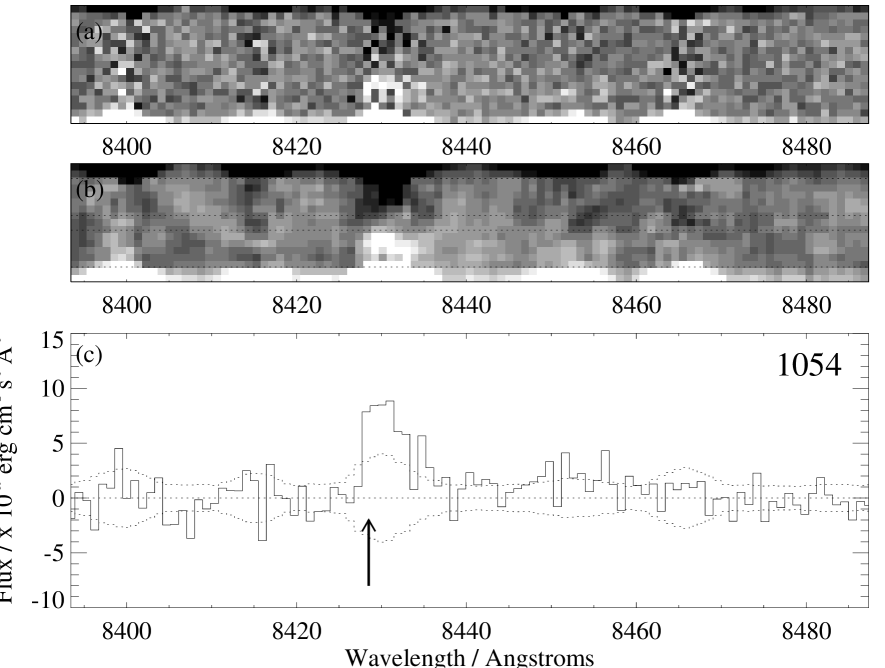
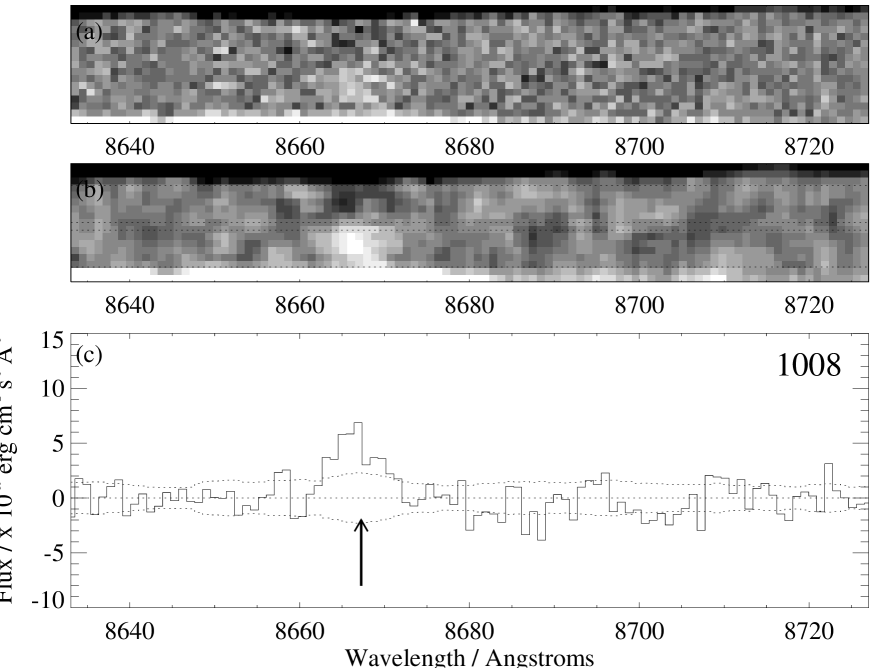
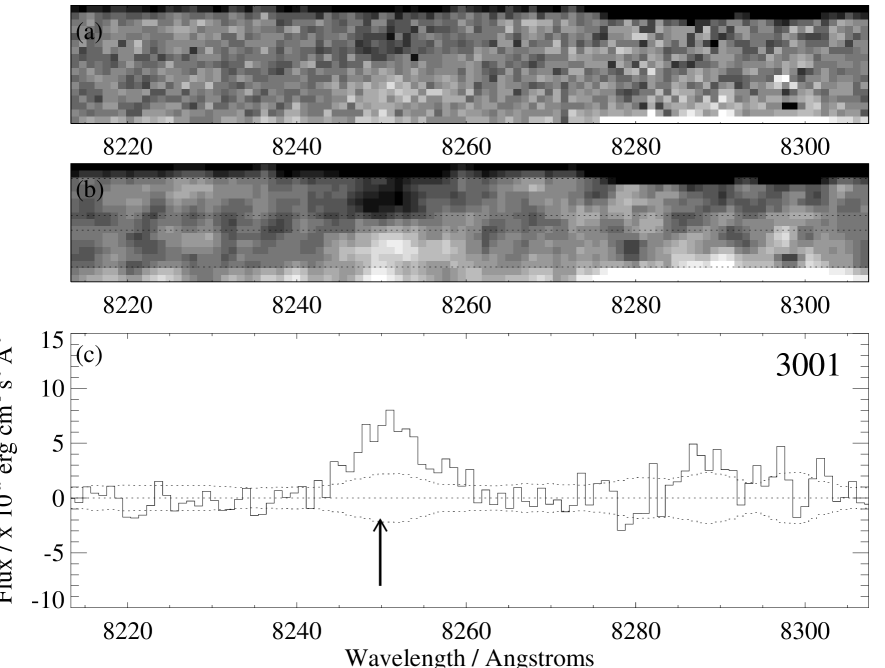
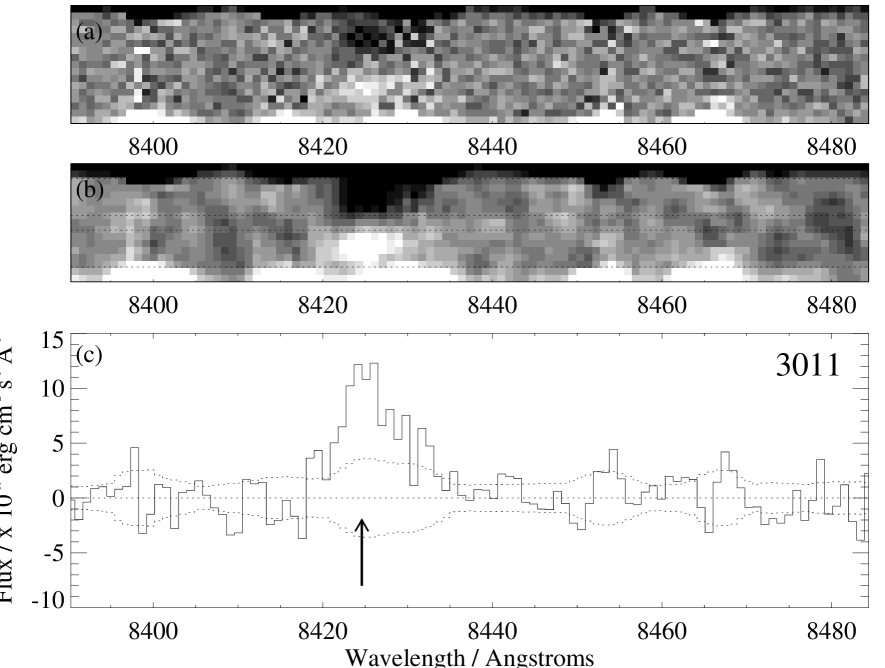
Table 2 lists the properties of the five sources with strong Lyman- line emission. Figure 2 presents the two dimensional spectra obtained for these sources, and the summed flux from positive and negative spectral channels. We also placed two known lower-redshift galaxies on the 2004 GLARE mask, placing [OII] within our spectral range, as a check on our sensitivity and calibration. These are galaxies GDS J033235.79-274734.7 () and GDS J033229.63-274511.3 () from the ESO VLT/FORS2 survey of Vanzella et al. (2005). We detect the [OII] emission at Å & Å, with line fluxes & , respectively.
For the Lyman- detections, GLARE sources 1042 and 3001 were previously identified as line emitters in Paper I from the 2003 GLARE mask, Stanway et al. (2004b). GLARE 3011 was tentatively identified as a line emitter, and this identification is now strongly confirmed. GLARE 1054 and 1008 are presented for the first time here.
Since its discovery (SBM03#1 in Stanway et al., 2003) GLARE 1042 at has been spectroscopically confirmed (Stanway et al., 2004a, b; Dickinson et al, 2004, – SiD002) and extensively studied, including in the infrared with Spitzer (Eyles et al., 2005; Yan et al., 2005, – #1ab). GLARE 1054 was identified from the -drop selection in the HUDF, GLARE 3001 and 3011 from the somewhat brighter GOODS selection. GLARE 1008 is a source selected from the initial early data release list of red sources in the HUDF survey. It lies outside the final overlap region of the HUDF which has been used for catalogue construction and analysis, but within the noisy outer regions of the HUDF mosaic. It is technically below the detection limit of the GOODS survey, although it is faintly detected in the GOODS -band. It is faintly detected in the -band in the shallower edges of the HUDF.
Given the higher resolution and more sensitive flux limit of this spectroscopy, we can rule out a low redshift interpretation for these sources and confirm them as Lyman- emitters. The spectral resolution of the GMOS configuration used in our 2004 GLARE mask is sufficient to resolve the [OII] Å doublet (and does so in the case of the two known [OII] emitters on our 2004 GLARE mask), and we would expect to identify weaker emission lines such as [NII], [SII] within our observed redshift range if the detected line was H (=6563Å). The other strong optical emission lines (H 4861, [OIII] 4959,5007) would always yield other strong lines within our spectral range. Sources at these low redshifts are also unlikely to satisfy the colour cut criterion used for target selection.
All five detected strong Lyman- emission lines also show significant asymmetry as expected for high redshift emitters (in which the blue wing of the line is significantly self absorbed, and the red wing broadened by re-emission). This phenomenon is well known at and is believed to arise in outflows from the actively star-forming galaxies (Adelberger et al., 2003). Similar asymmetry has now been observed in all galaxies confirmed to date by spectroscopy that resolves the Lyman- emission line (e.g. Bunker et al., 2003), suggesting that similar outflows are produced at higher redshift galaxies.
|
|
|
|
|
| ID | RA & Declination | Alternate | z | Line Flux | W | |||
|---|---|---|---|---|---|---|---|---|
| J(2000) | ID | erg cm-2 s-1 | Å | erg s-1 | ||||
| 1042† | 03 32 40.01 -27 48 14.9 | 20104 | 5.83 | 25.350.02 | 1.640.04 | 1.58 | 22.9 | 5.90 |
| 1054 | 03 32 33.20 -27 46 43.3 | 42414 | 5.93 | 27.650.07 | 1.450.17 | 0.68 | 120 | 2.63 |
| 1008 | 03 32 47.97 -27 47 05.1 | 6.13 | 28.510.18 | 1.35 | 0.43 | 159 | 1.80 | |
| 3001 | 03 32 46.04 -27 49 29.7 | 5.79 | 26.690.06 | 1.670.20 | 0.77 | 44.1 | 2.83 | |
| 3011 | 03 32 43.18 -27 45 17.6 | 5.93 | 27.470.12 | 1.860.50 | 1.13 | 242 | 4.39 |
3.2 Possible Emission Lines
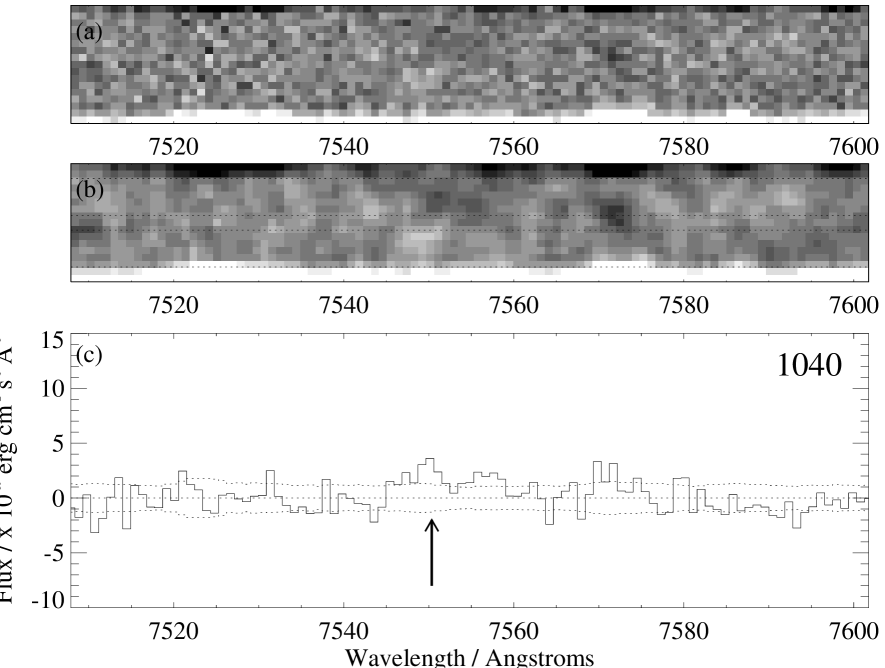
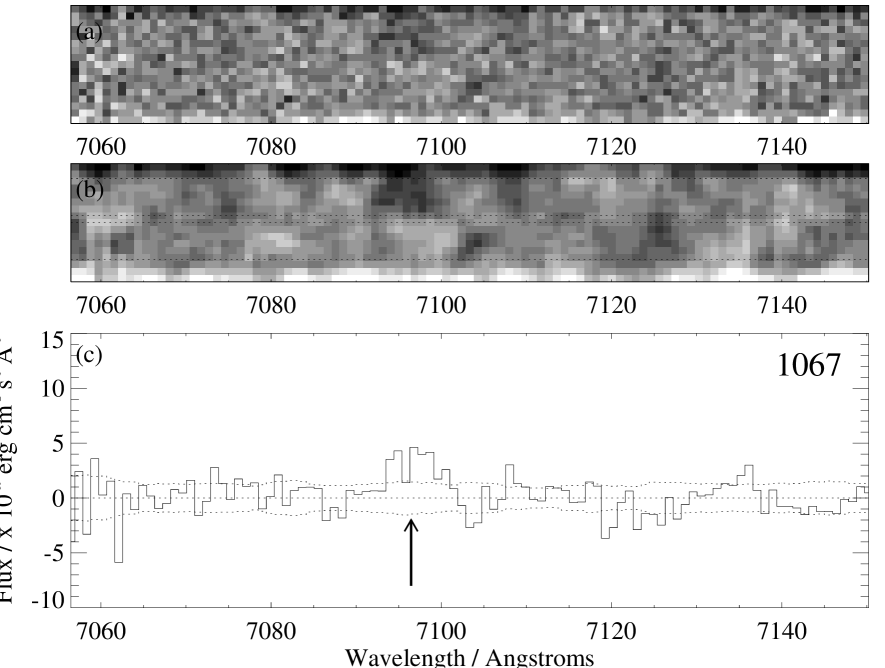
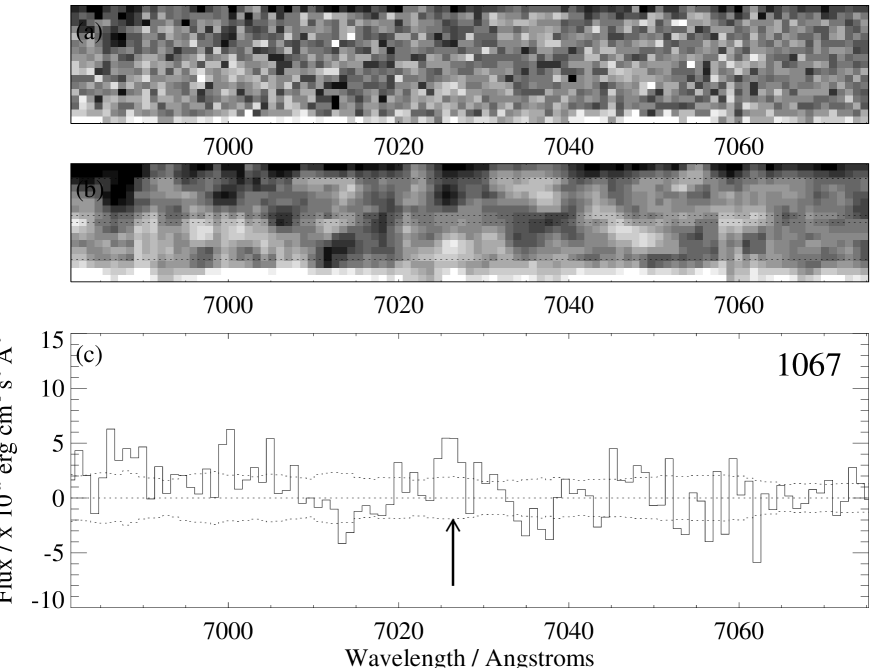
We identify a further four sources (listed in table 3) as possible line emitters. In most cases, the detection in each channel is of low significance, but the coincidence of positive and negative signals suggests that the emission lines are real. Alternately some candidate lines may lie on top of skylines, leading to the suspicion that these represent skyline residuals. These sources are illustrated in figure 3. All but one of the candidate emission lines lie shortward of the lower redshift limit selected by the -drop technique. Sources at these redshifts would be expected in a -drop rather than -drop selection. It is possible for sources with large errors on their colour to scatter into the -drop selection, although it is unlikely that photometric scatter alone could explain this discrepancy.
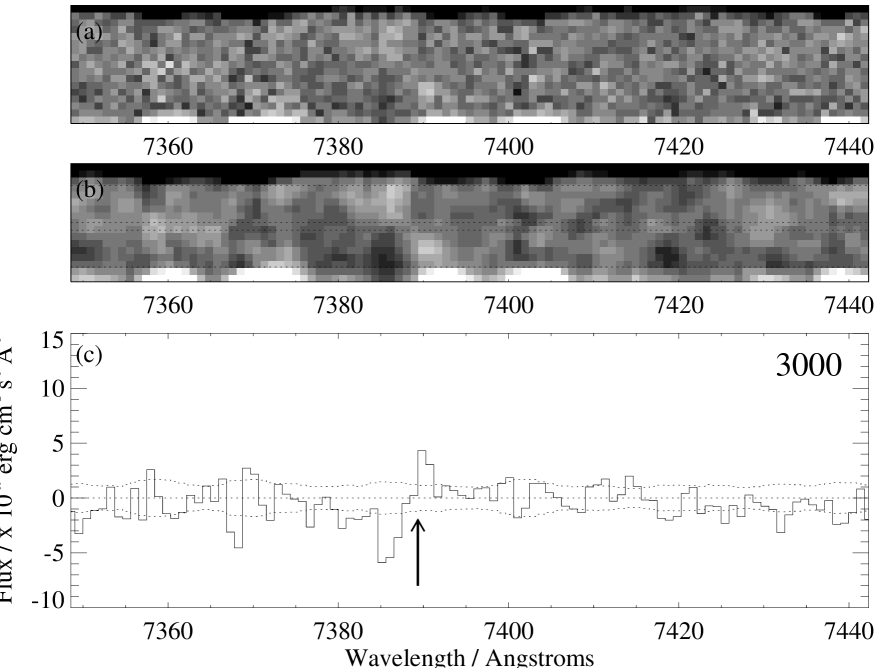
Three of these sources were identified in the HUDF -drop sample, one (GLARE 3000) from the GOODS sample. GLARE 3000 was first identified as an -drop source in Stanway et al. (2003, , SBM03#05) but considered likely to be an M or L class Galactic dwarf star, as it is unresolved in HST imaging. The candidate emission line in this source lies beside a strong sky line residual. FORS2 spectroscopy of this source by Vanzella et al. (2004) also interpreted the spectrum obtained as that of a Galactic star. The stellar identification is almost certainly correct, given the broadband colours and unresolved half light radius of this source, suggesting that possible emission lines at this significance should be considered highly suspect.
There are two possible emission lines of similar strength in GLARE 1067 (at 7037Å & 7099Å), rendering it unlikely that this source lies at high redshift. The observed line separation may be consistent with [OIII] emission (Å) at , although a galaxy at this redshift is predicted to have colours that are significantly bluer (i.e. and detected in the band, as opposed to the observed and no detection). In addition, the redward line of this [OIII] doublet is expected to be three times stronger than the blueward line, while the observed emission peaks are of comparable strength. An alternate explanation might be that two galaxies, separated by km s-1 lie within the slit. While this source has a close neighbour (at 03:32:35.8, -27:48:49, with a separation of arcsecond), the neighbouring galaxy is blue in colour (), and likely lies at significantly lower redshift. Therefore the most probable interpretation of these lines (if they are real) is that they represent [OIII] emission arising not in the targeted galaxy but rather in the neighbouring source.
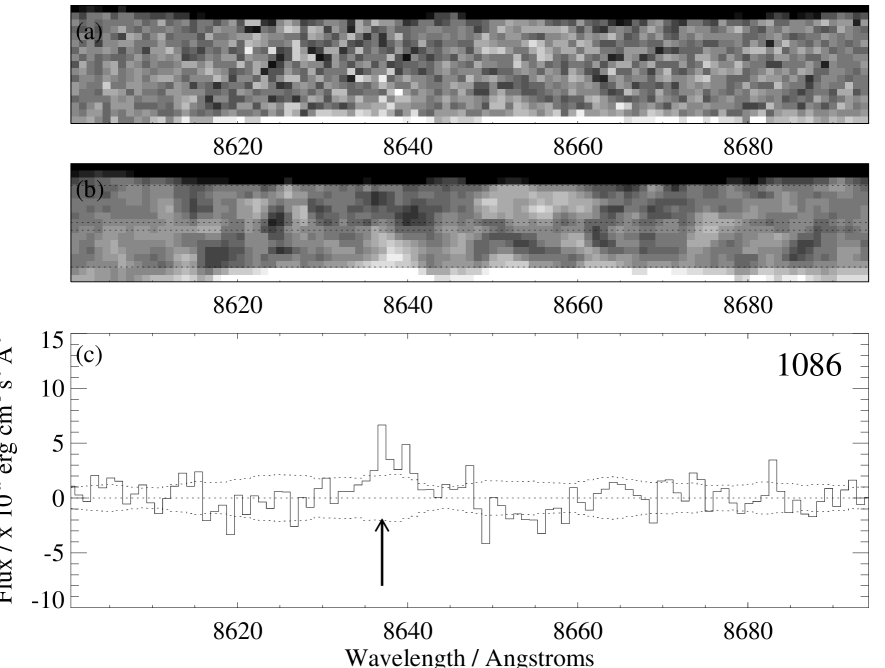
GLARE 1040 and GLARE 1086 are the most convincing candidates in this category. GLARE 1040, is an isolated source that clearly drops between the and -bands, and is undetected in the HUDF -band. The candidate emission line lies at , just shortward of the -drop selection, although it is possible for a faint galaxy such as this to scatter upwards into the selection window.
The candidate line in the final source, GLARE 1086, lies firmly in the redshift range selected by the -drop technique, and may well be a high redshift emission line, although the detection is too weak to rule out a low redshift [OII] explanation, or to detect line asymmetry.
|
|
|
|
|
| Slit | RA & Declination | Alternate | Line Flux | W | ||||
|---|---|---|---|---|---|---|---|---|
| J(2000) | ID | erg cm-2 s-1 | Å | erg s-1 | ||||
| 1040 | 03 32 38.28 -27 47 51.3 | 24458 | 5.21? | 27.510.07 | 1.600.17 | 0.17 | 20.2 | 0.49 |
| 1067 | 03 32 35.83 -27 48 48.9 | 14210 | 4.84?† | 28.080.10 | 1.430.24 | 0.30 | 81.5 | 0.72 |
| 4.78?† | 0.31 | 88.0 | 0.73 | |||||
| 1086 | 03 32 30.14 -27 47 28.4 | 30359 | 6.10? | 28.130.11 | 1.460.25 | 0.37 | 68.1 | 1.53 |
| 3000∗ | 03 32 38.80 -27 49 53.7 | 5.08? | 25.650.03 | 3.50 | 0.11 | 2.24 | 0.30 |
† GLARE 1067 has two emission lines, which are consistent with [OIII] at ;
if these are instead Lyman-, both are at .
∗ GLARE 3000 is most likely a low-mass Galactic star.
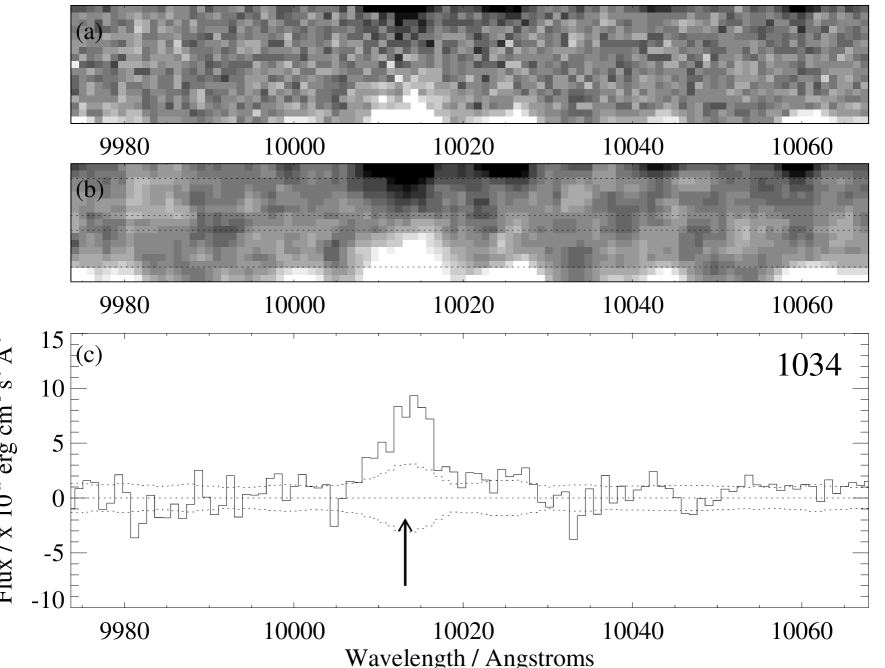
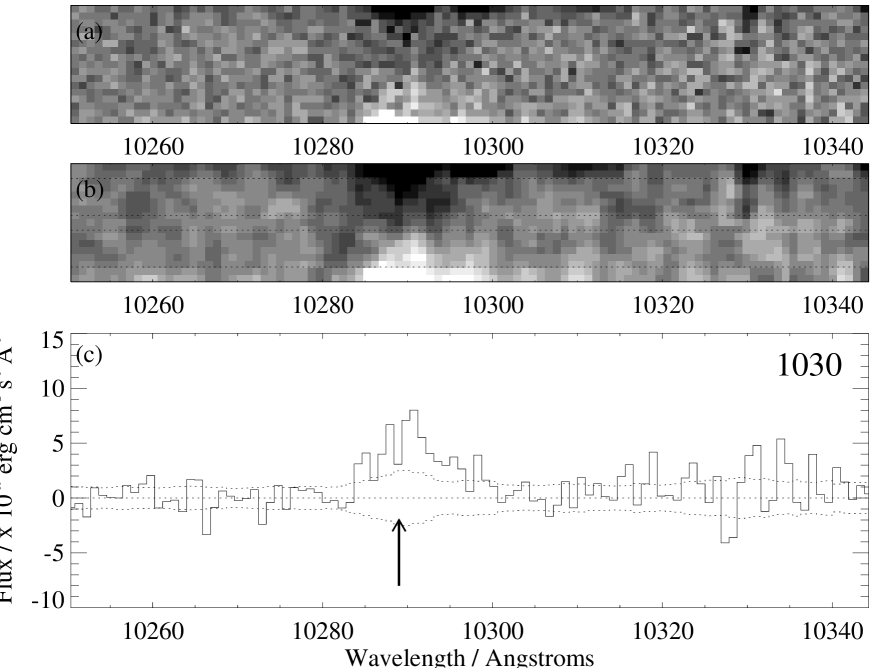
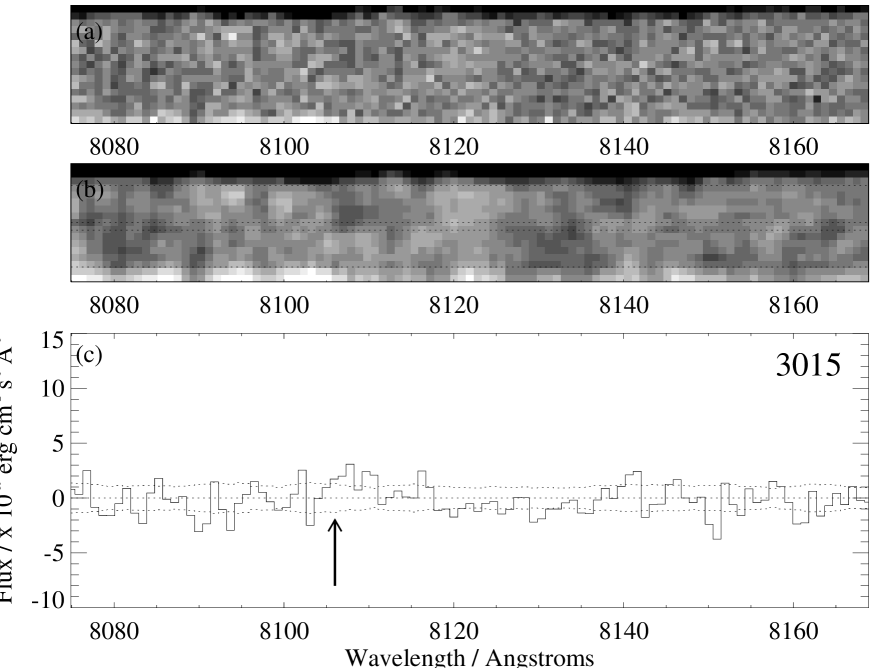
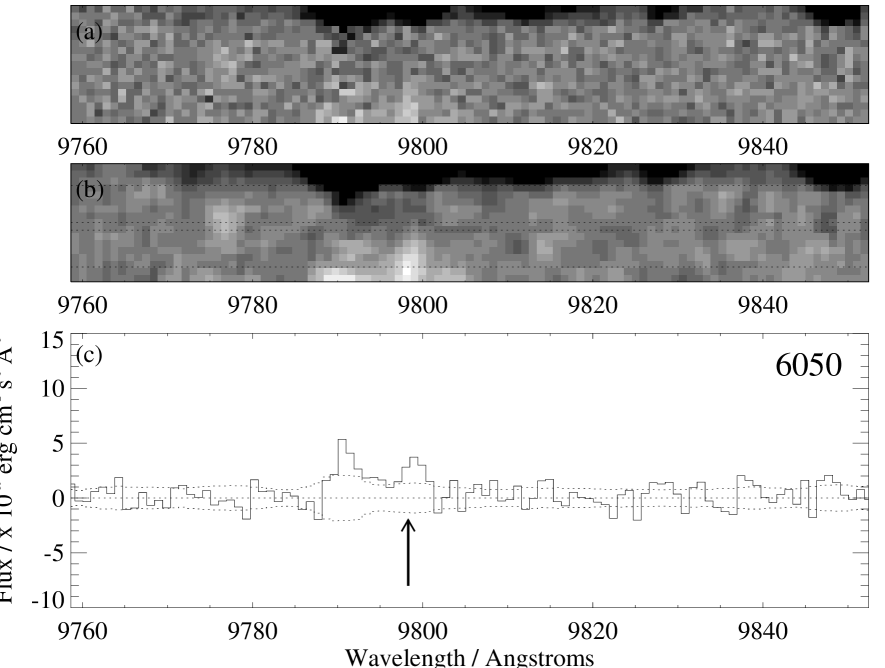
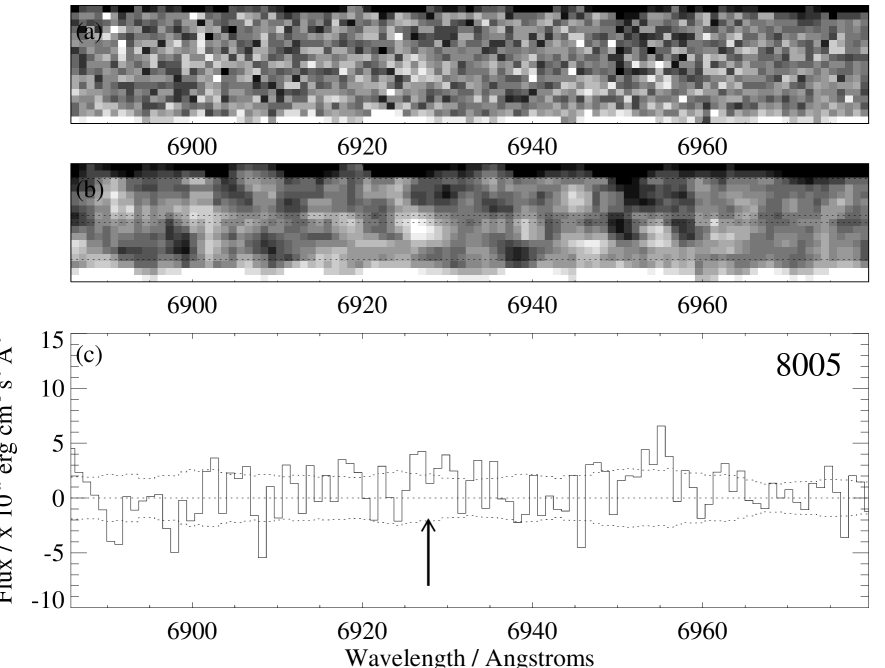
Finally, we identify signals in a further five sources as ‘unlikely’ emission lines. These are shown in table 4 and figure 4. Although the dipole signal from the first two sources appears strong, they lie on bright skylines and so may be partly or wholly due to sky subtraction residuals. They may also arrise as a result of charge diffusion from the adjacent slit. Both candidates lie at Å (not far from the 10500Å Si bandgap) where the diffusion is strong. The signal in the remaining candidates is weak. Slit GLARE 6050 was a blank sky slit, and there is nothing visible in any waveband at the depth of the GOODS imaging of this region. The possible serendipitous line emitter is offset from the centre of the slit by approximately 02 to the north.
|
|
|
|
|
| Slit | RA & Declination | Alternate | z | W | ||
|---|---|---|---|---|---|---|
| J(2000) | ID | Å | ||||
| 1034 | 03 32 39.454 -27 45 43.42 | 52086 | 7.24? | 27.970.09 | 2.43 | 10.6 |
| 1030 | 03 32 41.184 -27 49 14.81 | 10188 | 7.46? | 27.100.05 | 2.040.16 | 4.4 |
| 3015 | 03 32 27.910 -27 49 41.98 | 5.67? | 27.300.10 | 1.85 | 16.7 | |
| 6050∗ | 03 32 37.450 -27 49 47.60 | 7.05? | - | - | 104 | |
| 8005 | 03 32 34.392 -27 45 33.01 | 4.69? | 27.110.16 | 1.150.36 | 66.6 |
∗ 6050 is a ‘blank sky’ slitlet
3.3 Sources with No Line Emission
The remaining 21 science targets on the slitmask showed no evidence for line emission in the wavelength range observed, Å (corresponding to , with some slit to slit variation depending on slit location).
Of these, 11 formed part of our high priority -drop selection, with marginal targets (5 sources) and sky slits (5 slits) constituting the remainder. We discuss the implications of these non-detections of line emission below.
It is possible that, despite optimising our experimental setup for sky line subtraction, we are missing flux from emission lines that fall in regions dense with skylines. The noise in such areas is greater than the slit average, making identification of line candidates more difficult. Some 35% of the wavelength coverage of this spectroscopy lies under sky lines (defined as regions where sky emission exceeds 150% of the inter-line sky continuum level) which leave Poisson noise and sky brightness fluctuation residuals of varying strength, although only 10% lies under strong skylines (sky line emission times sky continuum). The noise under the residuals of bright sky lines is a factor of 2.5 greater than that between lines, and might also be prone to systematics in the sky subtraction leading to potentially spurious emission lines.
Only half of Lyman Break Galaxies at show Lyman- in emission (Shapley et al., 2003), and one quarter have W20Å. Given that we reach a limiting rest-frame equivalent width of 6Å for the majority of our targets, we might naïvely expect to observe emission in half our slits, less ten percent lost to strong sky line residuals. However, the fraction of Lyman Break Galaxies with emission at is still unknown, and it is likely that a large fraction of -drop galaxies will not be spectroscopically confirmed until the continuum level is reached with either longer exposures or more sensitive telescopes, and interstellar absorption lines can be used for redshift determination (see, for example, Dow-Hygelund et al., 2005, for rest-frame UV continuum spectroscopy of a bright galaxy).
Finally in the case of the marginal candidates used to fill the slitmask, it is possible that the true redshift of the sources lies above (set by the dual requirements of non-detection in the band, and the colours of these sources), but below the limit of our spectroscopy. Two of the slits without detections were placed on -drop galaxies expected to lie in this range, while a further four slits were placed on sources slightly too blue to meet our strict selection criteria. It seems unlikely that photometric scatter could place these sources in our detectable redshift range.
We will discuss the equivalent width limits on our -drop galaxies in Section 4.
3.4 Agreement with Other Spectroscopic Surveys
A subset of sources in our sample have also been observed spectroscopically as part of the concerted campaign of follow up observations to the GOODS survey.
Sources in the GOODS-S field have been targeted for 8m spectroscopy by FORS 2 on the VLT (Vanzella et al, 2006), by DEIMOS on Keck (Stanway et al., 2004a, , Bunker et al 2006) and by GMOS on Gemini (Paper I and this work). In addition, this field was surveyed with the HST/ACS grism as part of the GRAPES survey (Malhotra et al, 2005). This slitless spectroscopy has been obtained to varying depths, and at different spectral resolutions. In particular, the GRAPES grism spectroscopy is of too low a resolution to detect all but the highest equivalent width Lyman- emission lines adjacent to the Lyman- forest continuum break (compare, for example, the DEIMOS spectrum of SBM03#1/GLARE1042 in Stanway et al. 2004 showing the strong Lyman- line, with the HST/ACS spectrum of the same object, SiD002, in fig. 2a of Dickinson et al. 2004, which shows a continuum break but the line is washed out). However, GRAPES does provide a redshift estimate by localising the wavelength of the Lyman- break in the spectrum.
Where redshifts have been determined by multiple groups, our results are generally in reasonable agreement with previous observations, given the difficulty in obtaining precise redshifts from the self-absorbed and resonantly-broadened Lyman- lines at moderate spectral resolution. In the case of GLARE 1042, our measured redshift of is in close agreement with that measured by FORS 2 (, Vanzella et al., 2004), by the GRAPES team (, Malhotra et al, 2005) and, using Keck/DEIMOS spectra, by Stanway et al. (2004a, ). GLARE 3001 was spectroscopically identified by FORS 2 as a line emitter at , agreeing with our redshift of .
GLARE 1054 and 1030 were both placed at by GRAPES spectroscopy (Malhotra et al, 2005). This contrasts with our measured redshifts of for GLARE 1054 and (tentatively) for GLARE 1030. The discrepancy for GLARE 1054 is within the expected level of agreement for GRAPES grism spectroscopy and so these results are consistent. Given the low significance of our line candidate in GLARE 1030, and the -drop redshift selection function, the GRAPES redshift remains the more likely.
The remaining source, GLARE 3000 was identified by the VLT/FORS 2 observations as a Galactic star on the basis of weakly detected [OI] and [NII] lines. This source, which corresponds to the unresolved candidate SBM03#5 in Stanway et al. (2003), falls in our ‘possible’ category. We note that the FORS II spectrum is flagged with their quality class ‘C’ and that there is no secure continuum detection. Despite this, a Galactic star is still the most likely identification of this target, illustrating the caution with which we present our fainter line candidates.
No other target on our 2004 GLARE mask has been reported as a line emitter by other teams, or has an estimated redshift from GRAPES spectroscopy.
3.5 Limits on NV and other Emission Lines
Lyman break galaxies at show few other emission lines in the rest frame ultraviolet. The composite spectrum of 1000 such galaxies produced by Shapley et al. (2003) shows weak emission features due to SiII* (1265Å, 1309Å, 1533Å), OIII] ( 1661Å, 1666Å) and CIII] (1908Å), and absorption features due to stellar winds, primarily SiII and CIV.
The presence of an AGN in our target galaxies could also lead to the presence of emission lines due to high excitation states, primarily NV (1238.8Å, 1242.8Å) and SiIV (1394Å, 1403Å), and rarely OV] (1218Å).
For a galaxy at , our spectra extend to rest frame wavelengths of 1428Å. Given that we are not able to measure a high signal to noise continuum on any one target, we are unable to measure absorption features in the spectra, and therefore confine ourselves to searching for evidence of other emission features in the spectra of our Lyman- emitters.
A careful inspection of our five good Lyman- emission line candidates does not provide evidence for any other emission lines at the redshift of Lyman-. While this is not surprising given the weakness of secondary lines, the failure to detect NV in this spectrscopy suggests a large Ly- / NV ratio. Using our 3 limit on undetected lines as an upper constraint on NV flux we determine that respectively for GLARE targets [1042, 1054, 1008, 3001, 3011] Typical line ratios for AGN are (Osterbrock 1989), while those for galaxies are greater than this. The limits we determine disfavour an AGN origin to the Lyman- flux in all but the faintest target (in which the constraint is too weak to make a firm statement). These limits constrain AGN activity, if present, to only a weak contribution to the rest frame ultraviolet flux.
4 The Equivalent Width Distribution of GLARE line Emitters
4.1 The Observed Equivalent Width Distribution
Using the mean variance in the background of the exposed slits, and the broadband magnitudes of the targeted galaxies, we are able to calculate limits on the rest frame equivalent width for those sources which satisfy our colour selection criteria and yet are undetected in our spectroscopy. These are presented in table 5. In each case we assume that the galaxy lies at the mean -drop redshift () and that the emission line has not been lost behind a the subtraction residual of a bright night sky line.
Combining our line limits with those sources for which emission lines have been identified or tentatively proposed forms a sample of 24 sources uniformly selected from their -drop colours. The resultant distribution of Lyman- equivalent widths is plotted in figure 5.
If all the sources for which candidate emission lines are identified in this paper prove to be Lyman- emitters, then the escape fraction of Lyman- photons at appears qualitatively similar to that at . From our sample, 66% of the sources (16 out of 24) have Lyman- equivalent widths Å, compared with 75% at (Shapley et al., 2003), although the lower redshift sample loses a smaller fraction due to skyline contamination. The samples probe to similar points on the luminosity function in both cases (approximately 0.1 L∗). These fractions are consistent within the errors on our small number statistics. Harder to explain in comparison with lower redshift galaxies is the tail stretching to very high equivalent widths (Å) observed in this survey, a trait also observed in some narrowband selected sources at this redshift (e.g. Malhotra & Rhoads, 2002) and in other -dropout Lyman break galaxies (e.g. Dow-Hygelund et al., 2006, who find one source with 150Å). Although the number statistics are small, we observe four line emitters (%) with equivalent widths in the range Å, and a further four with 100Å (three of which come from our ‘robust’ list of line emitters). This contrasts with the Lyman Break Galaxy population at in which % of galaxies have line emission with Å (Shapley et al., 2003).
While high redshift galaxies at both redshifts are selected on their rest-frame ultraviolet continuum and the spectral break caused by Lyman- absorption, the two populations are not identical.
The sample discussed here reaches some two magnitudes fainter than the tentatively proposed and still uncertain typical luminosity L∗ at (Bouwens et al., 2006; Bunker et al., 2004). This contrasts with a sample reaching just one magnitude below L∗ at . Shapley et al. (2003) considered subsamples at , dividing their spectroscopic data into quartiles based on rest-frame equivalent width. They found a modest trend in the strength of line emission with magnitude. Galaxies in their highest equivalent width quartile are some 0.2 magnitudes fainter on average than their quartile of weak to moderate line emission. It is possible that the strong line emission observed here is more typical of sources with faint rest-frame ultraviolet continuum suggesting that faint sources differ physically from brighter members of the population.
A second difference between the samples is intrinsic rather than arising from a selection effect. Several authors (e.g. Stanway et al., 2005; Bouwens et al., 2006; Lehnert & Bremer, 2003) have now observed that Lyman break galaxies at have steeper rest-frame ultraviolet slopes than those at . Bouwens et al. (2006) interpret this as indicating that the dust properties of this population evolve over redshift. While a steep rest-ultraviolet slope can also arise due to low metallicity or a top-heavy initial mass function (as discussed below) dust evolution is a natural interpretation. At the universe is less than 1 gigayear old and galaxies may not have had time to develop a high dust content. Shapley et al. (2003) found that galaxies with high equivalent widths in Lyman- also had lower mean dust extinction. Lyman- photons are resonantly scattered by dust and hence the line is preferentially absorbed with respect to the rest-frame ultraviolet continuum. If the distribution of Lyman- equivalent widths in the population is truncated by dust absorption, this could produce an apparent ‘excess’ of strong lines at high redshift. However, even zero dust absorption cannot explain equivalent widths exceeding 200Å unless the sources are also very young and very low in metallicity. The full explanation for the equivalent width distribution observed in the GLARE data may well be a combination of these effects and those discussed below.
Several other possible explanations exist for both the steepening of the rest frame UV slope and the difference in equivalent width distributions. An interpretation of contaminant galaxies at lower redshifts seems unlikely due to our -drop selection criteria; low redshift sources with strong spectral breaks are likely to have more than one emission line in our observed redshift range.
A high equivalent width line can arise if the observed Lyman- photons excited by a population of AGN rather than by young, hot stars. The luminosity function of AGN is poorly constrained at these magnitudes and redshifts, but the space density of such sources is expected to be very low (e.g., the SDSS QSOs, Fan et al. 2003). At , the deep 2 Ms X-ray exposure of the UDF and surrounding region (Alexander et al., 2003) would detect only the brightest AGN ( ergs s-1 cm-2). None of the GLARE targets are detected in this X-ray observation. AGN would also be expected to show emission lines that are not just strong but also broad, while none of the GLARE line candidates are broad. There is also an absence of high-ionization lines such as NV 1240 Å which are common in AGN.
The tail of line emitters extending to higher equivalent widths may also arise from a difference in the fundamental properties of the stellar population between and that at lower redshifts.
Modeling of emission from metal-free Population III galaxies predicts rest frame Lyman- equivalent widths 1000Å for young starbursts (2 Myr), decreasing to W(Ly-)500Å for older bursts (Schaerer, 2002). These very high equivalent widths arise from the relatively hard spectrum of metal-free reactions in the most massive stars. However it is unlikely that zero metallicity (population III) stars are still contributing significantly to the emission from massive stars almost a billion years after the Big Bang, particularly given the identification of stellar populations Myr old in some sources (e.g. Egami et al., 2005; Eyles et al., 2005). Further evidence for moderate metallicity at has been observed in the spectroscopy of bright AGN from the Sloan Digital Sky Survey. Metals including iron (Barth et al., 2003) and carbon (Maiolino et al., 2005) have been detected from even the highest redshift quasar (at ).
By contrast, even 1/20th solar metallicity leads to a sharp reduction in the peak (zero age) equivalent width predicted to 300Å, with a more typical W(Ly-)100Å by an age of 10-100 Myr (Malhotra & Rhoads, 2002). Most of the candidate emission lines presented in this study can hence be explained with normal, if low metallicity, populations. However at least two of our good line emission candidates have rest frame equivalent widths exceeding 200Å. This is possible if the galaxy is in the first few Myrs of an ongoing starburst, but may also provide evidence for variation in the initial mass function of star formation.
High equivalent widths of Lyman- emission can arise from a “top-heavy” initial mass function (i.e. star formation weighted towards a population of high mass stars). Malhotra & Rhoads (2004b) calculated the Lyman- equivalent width expected for a metal-enriched population with a very extreme IMF, weighted towards massive stars (i.e. IMF slope ). As is the case for low metallicity populations, the flux is weighted towards a harder spectrum, and Lyman- emission is strengthened. They found that such an IMF could explain line equivalent widths of up to 240Å at ages of a few Myr, with higher IMFs possible for very young bursts.
The hard rest-frame ultraviolet spectrum associated with such an IMF may also be consistent with the steep rest frame ultraviolet spectral slopes observed in galaxies (e.g. Stanway et al., 2005). While the evidence from the GLARE study is limited, with the number of high equivalent width sources small, the existence of such sources suggests that the environment of star formation at is less metal enhanced, or weighted towards more massive stars than that at .
| ID | Alt | RA & Declination | W / Å | ||
|---|---|---|---|---|---|
| 1001 | 48989 | 03 32 41.43 -27 46 01.2 | 28.260.12 | 2.1 (2 ) | 6.5 |
| 1004 | 46223 | 03 32 39.86 -27 46 19.1 | 28.030.10 | 2.37 (2 ) | 5.2 |
| 1009 | 12988 | 03 32 38.50 -27 48 57.8 | 28.110.11 | 2.29 (2 ) | 5.6 |
| 1045 | 21111 | 03 32 42.60 -27 48 08.8 | 28.020.11 | 1.670.26 | 5.2 |
| 1047 | 35271 | 03 32 38.79 -27 47 10.8 | 28.440.14 | 1.330.30 | 7.6 |
| 1060 | 11370 | 03 32 40.06 -27 49 07.5 | 28.130.11 | 2.28 (2 ) | 5.7 |
| 1077 | 16258 | 03 32 36.44 -27 48 34.2 | 27.640.07 | 1.420.16 | 3.7 |
| 3002 | 03 32 43.35 -27 49 20.4 | 26.890.07 | 1.420.20 | 1.8 | |
| 3030 | 03 32 48.94 -27 46 51.4 | 27.040.08 | 1.410.23 | 2.1 | |
| 3033 | 03 32 49.08 -27 46 27.7 | 27.180.09 | 1.400.27 | 2.4 |

4.2 Implications of High Equivalent Widths
The presence of a tail of large equivalent width emission line sources has implications for the redshift distribution expected from an -drop selection.
The redshift distribution and number densities of -drop galaxies have usually been calculated assuming a negligible contribution from line emission to the measured magnitudes and colours. In the case of line emitters with rest frame equivalent widths Å this is a reasonable assumption, with the contribution to flux amounting to a few percent.
For line emitters with larger equivalent widths there can be a significant effect on the selection function of -drop galaxies. This effect falls into three main regimes as illustrated by figure 6. If the emission line falls in the -band filter (i.e. ), then the colour of the galaxy is reduced by the line emission, and sources with high equivalent widths fall out of the colour-magnitude selection window. A source at our detection limit with a rest frame Lyman- equivalent width of 100Åcan be as blue as (AB) and an intrinsic line width of 150Åwould lead to a colour of just (AB). These colours are similar to those of much lower redshift galaxies. Ensuring a complete selection of line emitting galaxies at is therefore impossible using a simple colour-selected sample without also including a great many lower redshift contaminant sources.
If the line emission falls in filter, the colour is enhanced and galaxies with continuum flux below the limit are promoted into the selection window. Hence at the -drop criterion can select a population of low continuum, strong line emission sources rather than the continuum break sources it targets. There is also a redshift range in which the line emission would fall in the overlap region between filters and both effects compete.
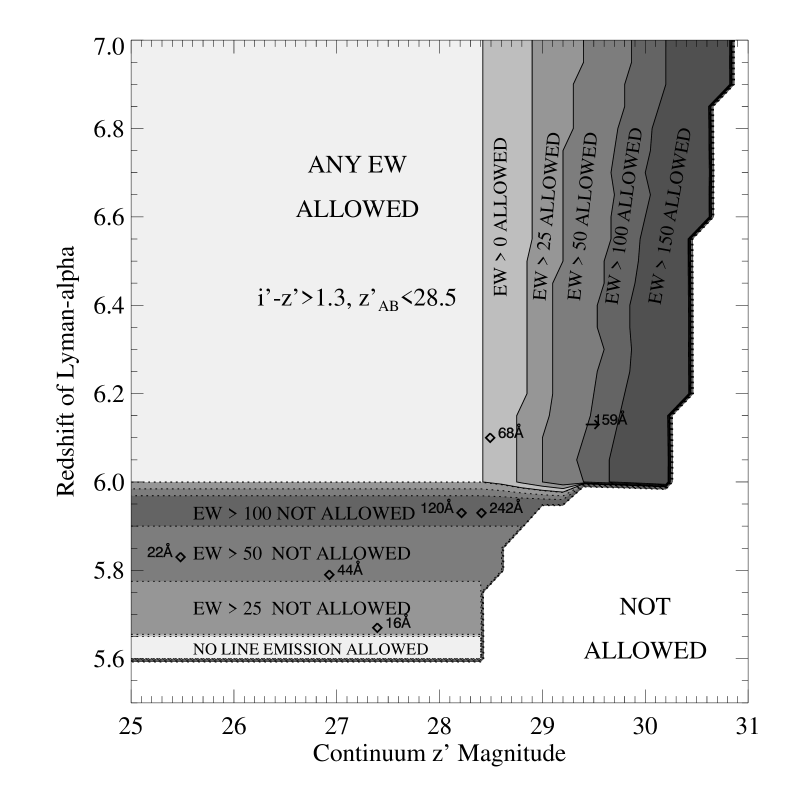
This effect may lead to a bimodal redshift distribution for -drop galaxies, with weak emission line sources preferentially selected towards lower redshift, and high equivalent width sources selected at higher redshifts. It is necessary to quantify the equivalent width distribution, combining galaxies at the faint limits explored here with brighter galaxies, in order to tightly constrain the galaxy luminosity function at any given redshift.
As figure 6 illustrates, our good line emission candidates all lie in regions of parameter space affected by equivalent width selection biases. Our candidates lie in parameter space theoretically allowed for their equivalent width with two exceptions - GLARE 1054 and 3011 both have strong emission lines in the tail of the filter that should have forced their colours out of our selection function. We note, however, that that both of these sources have colours within 1 of our minimum selection cutoff, and may have scattered up into out selection. Only one source is boosted into the selection function by virtue of its line emission rather than continuum flux, suggesting that our sample is, as expected, dominated by continuum-selected sources. If we are indeed missing sources with high emission line equivalent widths at the low redshift end of our survey (where our redshift selection function is at its peak), then our conclusion that the distribution of line emission at high redshift extends to larger equivalent widths is strengthened.
This effect has interesting implications for the luminosity functions presented in the literature for galaxies. If the -drop criteria are overestimating the number density of faint continuum sources (due to contamination by a tail in the distribution of strong line emitters) then it is possible that the faint end slope of the luminosity function is shallower than hitherto reported. If there is a large number of strong emitters at that have fallen out of the colour selection, then the number density of sources at these redshifts could be underreported. This may contribute towards the discrepancy between the observed evolution in the LBG luminosity function between and (e.g. Bunker et al., 2004; Bouwens et al., 2004) and the reported lack of evolution in the Lyman- emitter luminosity function over the same redshift range (e.g. Malhotra & Rhoads, 2004a).
Ando et al. (2006) studied the equivalent width distribution of a heterogeneous sample of -drop and narrowband selected galaxies with spectroscopically confirmed Lyman- emission at . They commented on an apparent dearth of UV-luminous galaxies with strong Lyman- emission lines, noting an increase in the fraction of strong line emitters at . In figure 7 we show the equivalent distribution of the GLARE line emitters as a function of absolute magnitude.
We detect five bright sources with a line luminosity brighter than ergs s-1, thus occupying a regime unoccupied by the Ando et al sample. Of these, two possible emission line sources have equivalent widths greater than any in the previous sample. The four sources with a calculated line luminosity between and ergs s-1 are uniformly distributed in absolute magnitude.
Although the number statistics of our sample is small, our sample is uniformly selected by broadband magnitude, removing possible biases due to the combination of two methods. Narrow-band surveys are biased towards sources with faint continuum and bright Lyman- emission lines, whereas the -drop selection method is more uniformly sensitive to Lyman- emission except at the very faint and low redshift ends of the sample. Our results do not support those of Ando et al., although clearly further observations are required to clarify the fraction of line emitters at bright magnitudes. It is possible that the fraction of sources with high equivalent width line emission is subject to environmental effects (e.g. the local number density of galaxies). The small HUDF field is, of course, subject to the effects of cosmic variance (Bunker et al., 2004). For sources as clustered as Lyman break galaxies at moderate redshifts are known to be, a variance in number density of 40% is expected in a field this size (Somerville et al., 2004).

5 Discussion
5.1 The Redshift Distribution of -drop Galaxies
The redshift distribution expected for line emitters detected by the GLARE survey is the convolution of the selection functions imposed by the -drop selection criteria and by the spectral response of Gemini/GMOS in this configuration, modified by the probability of detecting a line that falls on a night sky emission line.
In figure 8 we show the expected distribution of emission line redshifts, neglecting the influence of strong line emission on source magnitude and colour (see above), and assuming a Schecter (1976) luminosity function with parameters (), and () (Stanway 2004). Changing the parameters of the luminosity function has a slight effect on the shape of the distribution, with a reduction in with increasing redshift slightly broadening the peak of the distribution in redshift space.
We take the conservative assumption that a source has a detection probability of 0% if lying on a very strong line ( the inter-line sky continuum) and 50% on top of a weaker sky line ( sky continuum level). The night sky spectrum is measured directly from our spectroscopy.
Clearly, our survey is most sensitive to sources lying towards the lower-redshift end of our redshift range, and to sources lying in the low OH line regions commonly exploited by Lyman- surveys at and . Nonetheless, we have a reasonable probability of detecting sources in the skyline complexes at , particularly if the source emission lies between skylines.
Given this theoretical sensitivity distribution, it is interesting to note that the five robust line emitters presented in this paper (and one possible emission line also lying in this redshift range) do not fall at the peak of the detection sensitivity distribution, but rather within the skyline complexes. In Stanway et al. (2004b) we suggested weak evidence for large scale structure in the HUDF field at , based on the three redshifts known at the time. More recently Pirzkal et al. (2004) have found evidence for an over-density at in the same field based on GRAPES Grism spectroscopy. Given that it unlikely that our fainter targets will yield redshifts with the current generation of spectrograph, confirmation of this may prove challenging. However, our results so far appear consistent with large scale structure at in this field.

5.2 The Space Density of Lyman- Emitters
We have identified a total of 12 (5 of which were strong) candidate emission lines with a luminosity in the range ergs s-1 in our sample of 24 -drop galaxy candidates. If this is indicative of the -drop selected galaxy population as a whole, and if the equivalent width distribution is invariant with magnitude, we would expect to observe line emission of this strength in approximately 25 (11 strong) of the 51 -drop galaxies identified in the HUDF by Bunker et al. (2004) (which were used by GLARE for candidate selection). Hence, this suggests a line emitter space density of ()-1 Mpc-3), using the effective comoving volume for the -drop selection in the HUDF survey of Mpc3. This space density comparable to the space density of ()-1 Mpc-3 estimated by Shimasaku et al. (2006) for Lyman-alpha emitters of comparable luminosity () at in the Subaru Deep Field.
Similarly, at the Lyman-Alpha Large Area Survey (LALA) found a number density of Mpc-3 for Lyman- emitters with erg s-1 (Malhotra & Rhoads, 2004b). This would predict the detection of 7 Lyman- emitters to our detection limit in our survey volume. This is consistent with, although slightly lower, than the number of emitters we detect.
Inferring the space density of emitters from the relatively small sample in this survey is, of course, subject to large errors due to Poisson noise on the small number statistics. However, at least two physical explanations are possible for a discrepency between the line emitter density found by GLARE and by LAE surveys. As mentioned in section 5.1, the HUDF is in a region with a known overdensity of sources at . GLARE is also likely to detect a higher apparent density of line emitters if the Lyman- photon escape fraction is higher in the relatively faint galaxies studied here than in more massive galaxies. If this is true then the number of sources observed at faint magnitudes exceeds the number predicted from brighter surveys. This phenomenon may well be expected if the deeper potential well of more massive galaxies traps more dust and a denser ISM than that existing in the shallow potential wells of small, faint galaxies.
5.3 The Emission line properties of sub-L∗ Galaxies
This spectroscopy is the longest integrated exposure on a single mask using an 8m telescope. It reaches the faintest line limits available for a large sample with a homogeneous -drop colour cut. The 3 sigma limit in most slits is approx erg cm-2 s-1 Å-1.
Hence we are able to observe line emissions from candidates significantly fainter than other surveys targeting -drop galaxies.
Given the expenditure in telescope resources required to reach these faint limits, it is likely that many of the HUDF candidates may well remain inaccessible to ground based spectroscopy until the advent of the Extremely Large Telescopes, and from space by JWST with NIRSpec. HUDF -drops can be identified with reasonable confidence to (Bunker et al. 2004). A source with and an emission line of W=20Å (rest) at , with complete Lyman- absorption shortward of the line, would have a contamination fraction of 13.5% to the -band from this line, and a continuum flux of erg cm-2 s-1 Å-1 – i.e. a continuum flux a factor of less than we are able to detect at the level per spectral resolution element (6.5 Å) . However, such a source would possess a line flux of erg cm-2 s-1, well within our detection limits for emission lines.
Hence, although emission lines are detectable in surveys such as this, even for the faintest of our target sources, continuum spectra will remain inaccessible for some time to come. Even GLARE 1042, the brightest in the HUDF does not have sufficient signal to noise to in this spectroscopy to detect absorption features, even though the continuum is now detected at high significance. The detection of stellar absorption lines would provide valuable kinematic information on the galaxies and their outflows, however while such investigations may be possible on a stacked image of our faint spectra, it is impossible on individual slits. A stack of the faint GLARE spectra will be considered in a future paper.
6 Conclusions
In this paper we have presented spectroscopy of the faintest known sample of -drop galaxies, derived from the Hubble Ultra Deep Field. An exposure of 36 hours per target was obtained with the Gemini-South telescope.
Our main conclusions can be summarised as follows:
i) We have obtained extremely deep spectroscopy for twenty-nine science targets, reaching line flux limits of erg cm-2 s-1 – corresponding to equivalent width limits of Å for the majority of our targets.
ii) We identify five -drop galaxies as good Lyman- emitter candidates, four as possible candidates, and a further five tentative emission lines which we consider unlikely to be real.
iii) We have considered the observed equivalent width distribution of -drop galaxies in the HUDF, and identify a tail of line emitters with very high equivalent widths which is not seen in the lower-redshift Lyman-break galaxies at .
iv) Several possible explanations for this effect exist. These include a tendency towards stronger line emission in faint sources, extreme youth or low metallicity in the Lyman-break population at high redshift, or possibly a top-heavy initial mass function.
v) At the low redshift end of our selection function (), the -drop selection method will fail to select line emitters with high equivalent width due to line contamination producing blue colours. In contrast, at the high redshifts end (), continuum-faint line emitters may enter the selection function if the Lyman- line is sufficiently luminous. This has implications for the redshift and continuum magnitude selection function of -drop galaxies.
vi) This sample significantly increases the number of faint -drop galaxies with known redshifts, and may begin to bridge the divide between continuum and line selected galaxies at .
Acknowledgments
Based on observations obtained at the Gemini observatory, which is operated by AURA Inc, under a cooperative agreement with the NSF, on behalf of the Gemini partnership. Also based in part on observations with the NASA/ESA Hubble Space Telescope, obtained at the Space Telescope Science Institute which is operated by AURA Inc under NASA contract NAS 5-26555. We thank the GOODS and HUDF teams for promptly releasing their valuable surveys to the community. We also thank all members of the GLARE collaboration.
ERS gratefully acknowledges support from NSF grant AST 02-39425. AJB acknowledges support from a Philip Leverhulme Prize.
We thank the anonymous reviewer for their helpful comments which have enhanced this paper.
References
- Abraham et al. (2004) Abraham R. G., Glazebrook K., McCarthy P. J., Crampton D., Murowinski R., Jorgensen I., Roth K., Hook I. M., Savaglio S., Chen H., Marzke R. O., Carlberg R. G., 2004, ArXiv Astrophysics e-prints
- Adelberger et al. (2003) Adelberger K. L., Steidel C. C., Shapley A. E., Pettini M., 2003, ApJ, 584, 45
- Alexander et al. (2003) Alexander D. M., Bauer F. E., Brandt W. N., Schneider D. P., Hornschemeier A. E., Vignali C., Barger A. J., Broos P. S., Cowie L. L., Garmire G. P., Townsley L. K., Bautz M. W., Chartas G., Sargent W. L. W., 2003, AJ, 126, 539
- Ando et al. (2006) Ando M., Ohta K., Iwata I., Akiyama M., Aoki K., Tamura N., 2006, ArXiv Astrophysics e-prints
- Barth et al. (2003) Barth A. J., Martini P., Nelson C. H., Ho L. C., 2003, ApJ, 594, L95
- Becker et al. (2001) Becker R. H., Fan X., White R. L., Strauss M. A., Narayanan V. K., Lupton R. H., Gunn J. E., Annis J., Bahcall N. A., Brinkmann J., Connolly A. J., Csabai I., Czarapata P. C., Doi M., Heckman T. M., Hennessy G. S., Ivezić Ž., Knapp G. R., Lamb D. Q., McKay T. A., Munn J. A., Nash T., Nichol R., Pier J. R., Richards G. T., Schneider D. P., Stoughton C., Szalay A. S., Thakar A. R., York D. G., 2001, AJ, 122, 2850
- Beckwith et al. (2006) Beckwith, S. V. W. et al, 2006, AJ(submitted), astro-ph/0607632
- Bouwens et al. (2004) Bouwens R. J., Illingworth G. D., Blakeslee J. P., Broadhurst T. J., Franx M., 2004, ArXiv Astrophysics e-prints
- Bouwens et al. (2004) Bouwens R. J., Illingworth G. D., Thompson R. I., Blakeslee J. P., Dickinson M. E., Broadhurst T. J., Eisenstein D. J., Fan X., Franx M., Meurer G., van Dokkum P., 2004, ApJ, 606, L25
- Bouwens et al. (2006) Bouwens R. J., Illingworth G. D., Blakeslee J. P., Franx M., 2006, ApJ, 653, 53
- Bunker et al. (2004) Bunker A. J., Stanway E. R., Ellis R. S., McMahon R. G., 2004, MNRAS, 355, 374
- Bunker et al. (2003) Bunker A. J., Stanway E. R., Ellis R. S., McMahon R. G., McCarthy P. J., 2003, MNRAS, 342, L47
- Dickinson et al (2004) Dickinson M., Stern D., Giavalisco M., Ferguson H. C., Tsvetanov Z., Chornock R., Cristiani S., Dawson S., Dey A., Filippenko A. V., Moustakas L. A., Nonino M., Papovich C., Ravindranath S., Riess A., Rosati P., Spinrad H., Vanzella E., 2004, ApJ, 600, L99
- Dow-Hygelund et al. (2005) Dow-Hygelund C. C., Holden B. P., Bouwens R. J., van der Wel A., Illingworth G. D., Zirm A., Franx M., Rosati P., Ford H., van Dokkum P. G., Stanford S. A., Eisenhardt P., Fazio G. G., 2005, ApJ, 630, L137
- Dow-Hygelund et al. (2006) Dow-Hygelund C. C., et al., 2006, astro, arXiv:astro-ph/0612454
- Egami et al. (2005) Egami E., Kneib J.-P., Rieke G. H., Ellis R. S., Richard J., Rigby J., Papovich C., Stark D., Santos M. R., Huang J.-S., Dole H., Le Floc’h E., Pérez-González P. G., 2005, ApJ, 618, L5
- Eyles et al. (2005) Eyles L. P., Bunker A. J., Stanway E. R., Lacy M., Ellis R. S., Doherty M., 2005, MNRAS, 364, 443
- Glazebrook & Bland-Hawthorn (2001) Glazebrook, K. & Bland-Hawthorn, J. 2001. PASP, 113, 197
- Lehnert & Bremer (2003) Lehnert M. D., Bremer M., 2003, ApJ, 593, 630
- Maiolino et al. (2005) Maiolino R., Cox P., Caselli P., Beelen A., Bertoldi F., Carilli C. L., Kaufman M. J., Menten K. M., Nagao T., Omont A., Weiß A., Walmsley C. M., Walter F., 2005, A&A, 440, L51
- Malhotra & Rhoads (2004a) Malhotra S., Rhoads J., 2004a, ArXiv Astrophysics e-prints
- Malhotra et al (2005) Malhotra S., et al, 2005, ApJ, 626, 666
- Malhotra & Rhoads (2002) Malhotra S., Rhoads J. E., 2002, ApJ, 565, L71
- Malhotra & Rhoads (2004b) Malhotra S., Rhoads J. E., 2004b, ApJ, 617, L5
- Pirzkal et al. (2004) Pirzkal N., Xu C., Malhotra S., Rhoads J. E., Koekemoer A. M., Moustakas L. A., Walsh J. R., Windhorst R. A., Daddi E., Cimatti A., Ferguson H. C., Gardner J. P., Gronwall C., Haiman Z., Kümmel M., Panagia N., Pasquali A., Stiavelli M., Alighieri S. d., Tsvetanov Z., Vernet J., Yan H., 2004, ArXiv Astrophysics e-prints
- Schaerer (2002) Schaerer D., 2002, A&A, 382, 28
- Shapley et al. (2003) Shapley A. E., Steidel C. C., Pettini M., Adelberger K. L., 2003, ApJ, 588, 65
- Shimasaku et al. (2006) Shimasaku K., Kashikawa N., Doi M., Ly C., Malkan M. A., Matsuda Y., Ouchi M., Hayashino T., Iye M., Motohara K., Murayama T., Nagao T., Ohta K., Okamura S., Sasaki T., Shioya Y., Taniguchi Y., 2006, PASJ, 58, 313
- Somerville et al. (2004) Somerville R,. et al, 2004, ApJ, L121
- Stanway et al. (2003) Stanway E. R., Bunker A. J., McMahon R. G., 2003, MNRAS, 342, 439 Stanway E. R., 2004, PhD thesis, University of Cambridge
- Stanway et al. (2004a) Stanway E. R., Bunker A. J., McMahon R. G., Ellis R. S., Treu T., McCarthy P. J., 2004a, ApJ, 607, 704
- Stanway et al. (2004b) Stanway E. R., Glazebrook K., Bunker A. J., Abraham R. G., Hook I., Rhoads J., McCarthy P. J., Boyle B., Colless M., Crampton D., Couch W., Jørgensen I., Malhotra S., Murowinski R., Roth K., Savaglio S., Tsvetanov Z., 2004b, ApJ, 604, L13
- Stanway et al. (2005) Stanway E. R., McMahon R. G., Bunker A. J., 2005, MNRAS, 359, 1184
- Steidel et al. (2003) Steidel C. C., Adelberger K. L., Shapley A. E., Pettini M., Dickinson M., Giavalisco M., 2003, ApJ, 592, 728
- Steidel et al. (1995) Steidel C. C., Pettini M., Hamilton D., 1995, AJ, 110, 2519
- Thompson et al. (2005) Thompson R. I., et al., 2005, AJ, 130, 1
- Vanzella et al. (2004) Vanzella E., Cristiani S., Dickinson M., Kuntschner H., Moustakas L. A., Nonino M., Rosati P., Stern D., Cesarsky C., Ettori S., Ferguson H. C., Fosbury R. A. E., Giavalisco M., Haase J., Renzini A., Rettura A., Serra P., 2004, ArXiv Astrophysics e-prints
- Vanzella et al. (2005) Vanzella E., Cristiani S., Dickinson M., Kuntschner H., Moustakas L. A., Nonino M., Rosati P., Stern D., Cesarsky C., Ettori S., Ferguson H. C., Fosbury R. A. E., Giavalisco M., Haase J., Renzini A., Rettura A., Serra P., The Goods Team 2005, A&A, 434, 53
- Vanzella et al. (2006) Vanzella E., Cristiani S., Dickinson M., Kuntschner H., Nonino M., Rettura A., Rosati P., Vernet J., Cesarsky C., Ferguson H. C., Fosbury R. A. E., Giavalisco M., Grazian A., Haase J., Moustakas L. A., Popesso P., Renzini A., Stern D., the GOODS Team 2006, ArXiv Astrophysics e-prints
- Yan et al. (2005) Yan H., et al, 2005, ApJ, 634, 109