X-ray bright sources in the Chandra Small Magellanic Cloud Wing Survey - detection of two new pulsars
Abstract
We investigate the X-ray and optical properties of a sample of X-ray bright sources from the Small Magellanic Cloud (SMC) Wing Survey. We have detected two new pulsars with pulse periods of 65.8 s (CXOU J010712.6-723533) and 700 s (CXOU J010206.6-714115), and present observations of two previously known pulsars RX J0057.3-7325 (SXP101) and SAX J0103.2-7209 (SXP348). Our analysis has led to three new optical identifications for the detected pulsars. We find long-term optical periods for two of the pulsars, CXOU J010206.6-714115 and SXP101, of 267 and 21.9 d, respectively. Spectral analysis of a sub-set of the sample shows that the pulsars have harder spectra than the other sources detected. By employing a quantile-based colour-colour analysis we are able to separate the detected pulsars from the rest of the sample. Using archival catalogues we have been able to identify counterparts for the majority of the sources in our sample. Combining this with our results from the temporal analysis of the Chandra data and archival optical data, the X-ray spectral analysis, and by determining the X-ray to optical flux ratios we present preliminary classifications for the sources. In addition to the four detected pulsars, our sample includes two candidate foreground stars, 12 probable active galactic nuclei, and five unclassified sources.
keywords:
X-rays: binaries – stars: emission-line, Be – (galaxies:) Magellanic Clouds1 Introduction
The Small Magellanic Cloud (SMC) is turning out to be an exciting nest of X-ray binary pulsars. Estimates of the star formation rate (SFR) for the SMC range between yr-1 from H measurements (Kennicutt, 1991) to yr-1 from supernova birth rates (Filipovic et al., 1998). Using the relation between the X-ray luminosity function of high-mass X-ray binaries (HMXBs) and the SFR of the host galaxy (Grimm, Gilfanov & Sunyaev, 2003) and the upper and lower star formation rate estimates, Shtykovskiy & Gilfanov (2005) predict between 6 and 49 HMXBs with luminosities erg s-1 in the SMC. We now know of such systems in the SMC (Haberl & Pietsch, 2004; Coe et al., 2005).
Several of these detections have come from Chandra and RXTE work over the last couple of years (Edge et al., 2004; Laycock et al., 2005). This large number suggests a dramatic phase of star birth in the past, probably associated with the most recent closest approach between the SMC and the Large Magellanic Cloud (LMC; Gardiner & Noguchi, 1996). Even more extreme, Nazé et al. (2003) analysed a ks exposure of just one Chandra field and identified more than 20 probable Be/X-ray binary systems. Multiplying these numbers up by the size of the SMC, and allowing for % X-ray duty cycles, suggests the final number of Be/X-ray binaries could be well in excess of 1,000. Thus the study of the SMC is not only providing a great homogeneous sample of HMXBs for study, but is also providing direct insights into the history of our neighbouring galaxy.
| Object | Name | RA | Dec. | Error | Counts | Pulsed fraction | Obs ID | Date | |
|---|---|---|---|---|---|---|---|---|---|
| (J2000) | (J2000) | (arcsec) | (s) | (per cent) | |||||
| 1 | CXOU J005551.5-733110 | 00:55:51.54 | -73:31:10.1 | 0.88 | 231 | – | – | 5499 | 2006-03-03 |
| 2 | RX J0057.3-7325 | 00:57:27.08 | -73:25:19.5 | 0.83 | 433 | 101.16 | 5499 | 2006-03-03 | |
| 3 | CXOU J005754.4-715630 | 00:57:54.41 | -71:56:30.9 | 0.95 | 130 | – | – | 5480 | 2006-02-06 |
| 4 | CXOU J010014.2-730725 | 01:00:14.22 | -73:07:25.3 | 1.88 | 110 | – | – | 5498 | 2006-03-03 |
| 5 | CXOU J010206.6-714115 | 01:02:06.69 | -71:41:15.8 | 0.83 | 383 | 700.54 | 5481 | 2006-02-06 | |
| 6 | CXOU J010245.0-721521 | 01:02:45.01 | -72:15:21.7 | 0.91 | 81 | – | – | 5486 | 2006-02-10 |
| 7 | SAX J0103.2-7209 | 01:03:13.94 | -72:09:14.4 | 0.90 | 244 | 337.51 | 5486 | 2006-02-10 | |
| 8 | CXOU J010455.4-732555 | 01:04:55.50 | -73:25:55.2 | 1.33 | 58 | – | – | 5497 | 2006-03-03 |
| 9 | CXOU J010509.6-721146 | 01:05:09.68 | -72:11:46.6 | 1.17 | 50 | – | – | 5486 | 2006-02-10 |
| 10 | CXOU J010533.0-721331 | 01:05:33.08 | -72:13:31.2 | 1.21 | 80 | – | – | 5486 | 2006-02-10 |
| 11 | CXOU J010712.6-723533 | 01:07:12.63 | -72:35:33.8 | 0.87 | 1919 | 65.78 | 5487 | 2006-02-10 | |
| 12 | CXOU J010735.0-732022 | 01:07:35.00 | -73:20:22.6 | 1.20 | 66 | – | – | 5496 | 2006-03-03 |
| 13 | CXOU J010836.6-722501 | 01:08:36.65 | -72:25:01.7 | 0.99 | 67 | – | – | 5487 | 2006-02-10 |
| 14 | CXOU J010849.5-721232 | 01:08:49.51 | -72:12:32.9 | 0.90 | 144 | – | – | 5485 | 2006-02-08 |
| 15 | CXOU J010855.6-721328 | 01:08:55.64 | -72:13:28.2 | 1.02 | 54 | – | – | 5485 | 2006-02-08 |
| 16 | CXOU J011021.3-715201 | 01:10:21.31 | -71:52:01.2 | 0.80 | 94 | – | – | 5483 | 2006-02-06 |
| 17 | CXOU J011050.6-721025 | 01:10:50.62 | -72:10:25.9 | 0.92 | 82 | – | – | 5484 | 2006-02-06 |
| 18 | CXOU J011154.2-723105 | 01:11:54.28 | -72:31:05.0 | 0.92 | 82 | – | – | 5488 | 2006-02-12 |
| 19 | CXOU J011303.4-724648 | 01:13:03.46 | -72:46:48.4 | 1.83 | 86 | – | – | 5490 | 2006-02-27 |
| 20 | CXOU J011744.7-733922 | 01:17:44.77 | -73:39:22.7 | 0.96 | 89 | – | – | 5494 | 2006-03-01 |
| 21 | CXOU J011832.4-731741 | 01:18:32.44 | -73:17:41.6 | 1.40 | 71 | – | – | 5493 | 2006-02-27 |
| 22 | CXOU J012027.3-724624 | 01:20:27.31 | -72:46:24.8 | 0.78 | 64 | – | – | 5491 | 2005-07-24 |
| 23 | CXOU J012223.6-730848 | 01:22:23.65 | -73:08:48.5 | 0.96 | 301 | – | – | 5492 | 2005-08-12 |
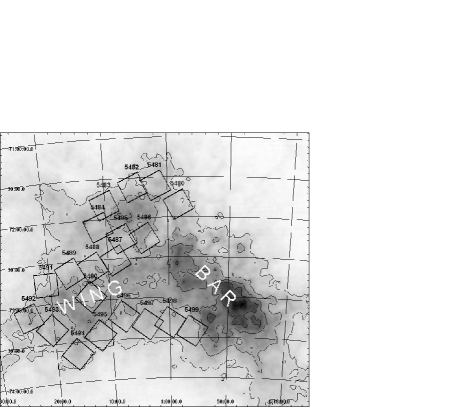
It is important to note that, despite appearances, the SMC is a very three dimensional object. Studies of the Cepheid population by Laney & Stobie (1986) have revealed that the depth of the SMC is up to ten times its observed width. The two main structures, the Bar and the Wing, lie kpc behind, and kpc in front of the main body of the SMC respectively.
To date most of the X-ray studies by Chandra and RXTE have concentrated on the Bar which has proved to be a large source of HMXBs. The Chandra work presented here focuses on a study of the Wing of the SMC. Its intention is to compare the pulsar population of the Wing with what we already know for the Bar. Coe et al. (2005) studied the locations of the detected X-ray pulsars and believed they identified a relationship between the HI intensity distribution and that of the pulsars. They found that the pulsars seem to lie in regions of low/medium HI densities, suggesting that high-mass star formation is well suited to these densities. The locations of the Chandra observations reported here are based upon this analysis.
2 The Chandra SMC Wing Survey
We performed a survey with Chandra of the wings of the SMC between 2005 July and 2006 March (see Figure 1). A total of 20 fields were observed using the standard ACIS-I imaging mode configuration which utilises chips I0-I3 plus S2 and S3. The exposure times for each field ranged from 8.6–10.3 ks. We performed the data reduction using CIAO V3.2. The event files were filtered to restrict the energy range to 0.5–8.0 keV and we barycentrically corrected the data. Potential sources were detected using the WAVDETECT algorithm. Here we present the analysis of the 23 brightest X-ray sources ( counts) in the survey (see Table 1). The positional errors quoted are the 95% confidence region for the source position that takes into account the properties of the telescope optics and the source brightness (see Hong et al., 2005), combined in quadrature with the boresight error ( at 95% confidence). A full analysis and catalogue of sources from all 20 fields will be presented in a future publication (McGowan et al., in preparation).
| Object | Model | (dof) | |||
| K | ergs cm-2 s-1 | ||||
| 1 | PL | … | 0.5 (20) | ||
| Brem | … | 0.4 (20) | |||
| Mekal | … | 0.6 (20) | |||
| 2 | PL | … | 1.0 (35) | ||
| Brem | … | 2314 | 2.3 (35) | ||
| Mekal | … | 927 | 2.5 (35) | ||
| 3 | PL | … | 1.1 (55) | ||
| Brem | … | 1.1 (55) | |||
| Mekal | … | 1.1 (55) | |||
| 4 | PL | … | 0.8 (45) | ||
| Brem | … | 0.8 (45) | |||
| Mekal | … | 1.4 (45) | |||
| 5 | PL | … | 0.8 (34) | ||
| Brem | … | 2314 | 3.2 (34) | ||
| Mekal | … | 927 | 3.6 (34) | ||
| 7 | PL | … | 1.4 (21) | ||
| Brem | … | 2314 | 2.0 (21) | ||
| Mekal | … | 927 | 2.2 (21) | ||
| 11 | PL | … | 1.1 (159) | ||
| PLa | … | 1.1 (158) | |||
| Brem | … | 2314 | 4.4 (159) | ||
| Mekal | … | 927 | 4.8 (159) | ||
| 14 | PL | … | 1.1 (59) | ||
| Brem | … | 133.4 | 2.0 (59) | ||
| Mekal | … | 1.1 (59) | |||
| 23 | PL | … | 0.8 (105) | ||
| Brem | … | 0.8 (105) | |||
| Mekal | … | 0.9 (105) |
The data were fitted with absorbed power-law (PL), bremsstrahlung (Brem) and Mekal models, assuming a neutral hydrogen column density of cm-2, where is the photon index and is the temperature determined from the fits. The goodness of fit using the C-statistic () and the unabsorbed flux in the 0.3–10 keV range are also given. a Model fit results in cm-2
2.1 Temporal Analysis
The main goal of the SMC Wing Survey is to detect new pulsars. We created background subtracted light curves for the 23 sources in our sample and searched for periodic variations from 6.5–1000 s. The temporal analysis was performed using the Starlink PERIOD software and we generated Lomb-Scargle and Phase Dispersion Minimisation periodograms for each of our sources.
We determined the 90% and 99% confidence levels for the Lomb-Scargle periodograms from a cumulative probability distribution appropriate for each data set. Using a Monte Carlo method we generated 10,000 simulated light curves with the same time sampling and variance as the real data. The simulated light curves were taken from a Gaussian distribution. A Lomb-Scargle periodogram was produced for each simulated light curve, and the peak power was recorded. From these values the probability of obtaining a given peak power from pure noise can be calculated and the cumulative distribution function derived.
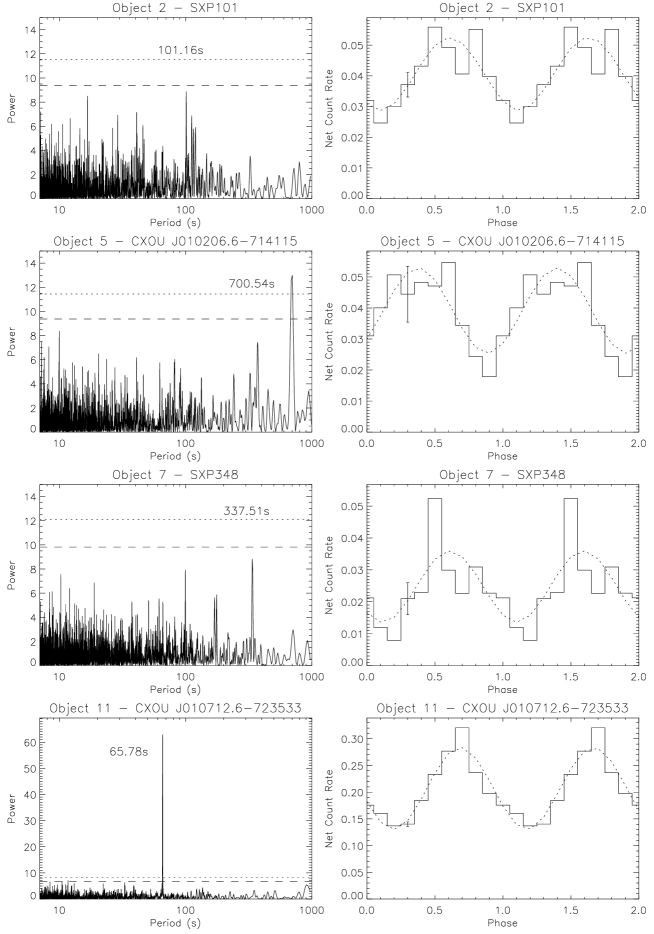
Two sources show a significant peak in the Lomb-Scargle periodogram and a corresponding strong peak in the Phase Dispersion Minimisation periodogram. Two of the other sources in the sample are the previously known pulsars, RX J0057.3-7325 = SXP101 and SAX J0103.2-7209 = SXP348. These two show pulsations, but at a level below the 90% confidence limit. The power spectra for all four sources are shown in Figure 2 (left). We folded the light curves on the detected periods (see Figure 2, right) and fitted the resulting pulse profiles with a sine function to determine the pulsed fractions (see Table 1). We define the pulse fraction as , where and are the maximum and minimum of the fitted pulse light curve.
The error on the periods were determined using Kovács formula (Kovács, 1981; Horne & Baliunas, 1986). Using this method the uncertainty calculated takes into account both the resolution due to the light curve sampling and the signal-to-noise ratio of the detected modulation.
| Optical Counterpart | |||||
| Object | OGLE III | OGLE II | MACHO | Period | Comment |
| (d) | |||||
| 1 | SMC106.8 21521 | - | Changes of mag over d | ||
| 2 | SMC106.7 15343 | 211.16415.11 | 21.9 | SXP101. Optical period seen in both OGLE III | |
| and MACHO data | |||||
| 3 | SMC108.4 384 | - | Some variability ( mag) on timescales | ||
| of d | |||||
| 4 | 211.16591.6 | 29.6 | MACHO data only, saturated in OGLE III. Period | ||
| is not strong in MACHO and affected by many | |||||
| saturated points | |||||
| 5 | SMC114.7 39 | 267 | New pulsar, CXOU J010206.6-714115. Overall | ||
| brightness change of 0.5 mag over d | |||||
| 6 | SMC-SC9 168928 | 206.16775.520 | - | No variability | |
| 7 | SMC-SC9 173121 | 206.16776.17 | - | SXP348. Variability ( mag) | |
| on timescales of d | |||||
| 8 | SMC111.7 8943 | 1.49 | Sinusoidal folded light curve of 0.04 mag amplitude | ||
| 9 | SMC113.2 13190 | 206.16947.35 | - | No variability | |
| 10 | SMC113.2 13509 | 206.16946.1089 | - | No variability | |
| 11 | SMC-SC11 48835 | 206.17055.21 | - | New pulsar, CXOU J010712.6-723533. Brightening | |
| of mag over d | |||||
| 12 | ? | ? | Not in OGLE or MACHO fields | ||
| 13 | SMC113.1 9719 | SMC-SC11 116013 | 206.17114.1658 | - | Brightening of mag over d |
| 14 | SMC118.7 galaxy | SMC-SC11 120966 | 206.17175.739 | - | No variability |
| 15 | SMC118.7 galaxy | 206.17174.524 | - | No variability | |
| 16 | SMC118.5 1160 | - | Some variability ( mag) on timescales | ||
| of d | |||||
| 17 | SMC118.7 10314 | - | No variability | ||
| 18 | SMC115.5 12842 | - | No variability | ||
| 19 | SMC115.7 18128 | - | Brightening of mag in d | ||
| 20 | SMC117.4 3274 | - | Brightening of mag in d | ||
| 21 | SMC121.6 galaxy | ? | Galaxy | ||
| 22 | SMC120.7 6336 | - | No variability | ||
| 23 | SMC121.4 542 | - | No variability | ||
2.2 Spectral Analysis
We have extracted spectra for the sources with counts using CIAO V3.2 tools. The spectra were regrouped by requiring at least 10 counts per spectral bin for the brighter sources ( counts), and 2 counts per bin for the fainter sources ( counts ). The subsequent spectral fitting and analysis were performed using XSPEC V12.3.0. We fitted each spectrum with a power-law, thermal bremsstrahlung and Mekal model. In each fit we included absorption. Due to the low number of counts detected we fixed the column density at the value for the SMC of cm-2, only in the case of source #11 (CXOU J010712.6-723533) have we also allowed the to be fit. The small number of detected counts renders chi-squared statistics invalid. We have therefore used an alternative statistic, the C-statistic (Cash, 1979), for our model fitting. The goodness of fit given in Table 2, , is determined in a similar way to reduced . The unabsorbed flux in the 0.3–10 keV band has been determined for each fit. For sources that are members of the SMC, or assumed members (see Section 2.4), we have also calculated the luminosity in the 0.3–10 keV range, using a distance to the SMC of 60 kpc (based on the distance modulus Westerlund (1997)). The results of the spectral fitting are summarised in Table 2.
2.3 Long-term Optical Light Curves
All 23 objects were investigated for possible optical periods (see Table 3). Such periods have been found in many previous HMXB systems in the SMC and can either represent the binary period of the system or non-radial pulsations (NRPs) from the mass-donor star (for examples of both see Edge et al., 2005; Schmidtke & Cowley, 2006). Data were collected from as many of the following possible sources: OGLE II (Szymański, 2005; Udalski et al., 1997), OGLE III and MACHO (Alcock et al., 1999). The OGLE III archive contains -band photometry spanning 5 years, the data are not yet public. In each case the optical light curves were searched for periods in the ranges d and d by generating Lomb-Scargle periodograms. If a significant period was found, then the data were folded modulo that period with phase zero set to the time of maximum light phase. In one case (source #5, CXOU J010206.6-714115) the data were first detrended with a polynomial fit. Quite a few of the objects revealed long-term variations on timescales of d - such changes are similar to the common Type 4 variations reported by Mennickent et al. (2002) from Be stars in the SMC. The errors on the periods were determined using the same method as for the pulse periods (see Section 2.1).
2.4 X-ray to Optical Flux Ratios
Using the results from the spectral fitting and information from optical catalogues we have constructed X-ray to optical flux ratios for the majority of the sources in our sample (Table 4). It has been shown that such ratios are a good discriminator for different classes of sources (see e.g. Maccacaro et al. 1988; Hornschemeier et al. 2001), with typical values for active galactic nuclei (AGN) lying in the region . We have used the flux in the 0.5–2 keV band and Eq. (3) from Hornschemeier et al. (2001) to calculate the ratio for each source that has a measured magnitude. In the case of a source that has too few counts to model in XSPEC, we have determined the flux given the count rate and assuming a power-law index of 1.6 (see Section 4) and neutral hydrogen column density of cm-2, using PIMMS v3.9a. The results of this analysis allows us to provisionally classify the sources and determine whether the object is a member of the SMC (see Section 3).
2.5 Quantile Analysis
We have used the quantile analysis technique of Hong et al. (2004) to investigate the X-ray colours of the 23 sources in our sample. In a traditional hardness ratio the photons are split into predefined energy bands. The quantile method divides the photon distribution into a given number of equal proportions, where the quantiles are the energy values that mark the boundaries between consecutive subsets. This has the advantage, compared to traditional hardness ratios, that there is no spectral dependence and a colour can be calculated even for sources with very few counts (for more details see Hong et al., 2004).
For each source we determine the median and quartiles of the photon energy distribution. In Figure 3 we show the quantile-based colour-colour diagram (QCCD), using the median and the ratio of two quartiles, for our sample. In the diagram the spectrum hardens as one goes further right and changes from concave-downward to concave-upward moving from top to bottom (see Figure 7, Hong et al., 2004). We have included in the figure the pulsars detected by Edge et al. (2004). The new and known pulsars are marked.
3 Individual Sources
3.1 CXOU J005551.5-733110
This source was detected in observation ID 5499 taken on 2006 March 3 (MJD 53797). The temporal analysis does not reveal any significant periodicities. The location of CXOU J005551.5-733110 is close to source 65 in the ROSAT HRI catalogue of the SMC (Sasaki et al., 2000), being consistent within errors. The position of the Chandra source coincides with 2MASS 00555147-7331101 (, , ) and OGLE III source SMC106.8 21521 (). The optical light curve displays changes of mag over d. The X-ray emission from the source is well fitted by a thermal bremsstrahlung with a temperature of K, however the temperature is poorly constrained (see Table 2). A power-law also fits the data well with an index of 1.9. If this source is a member of the SMC the unabsorbed luminosities derived from these fits are and erg s-1, respectively.
| Object | Class | |||
|---|---|---|---|---|
| 1 | - | - | - | |
| 2 | 14.8 | -1.58 | pulsar | |
| 3 | 20.1 | 0.46 | AGN | |
| 4 | 10.9 | -3.03 | star | |
| 5 | 15.1 | -1.47 | pulsar | |
| 6 | 18.0 | -0.79 | AGN | |
| 7 | 13.3 | -2.34 | pulsar | |
| 8 | 14.5 | -2.25 | star | |
| 9 | 18.0 | -1.00 | - | |
| 10 | 18.7 | -0.51 | AGN | |
| 11 | 14.9 | -0.90 | pulsar | |
| 12 | - | - | - | |
| 13 | 18.5 | -0.65 | AGN | |
| 14 | 19.4 | 0.15 | AGN | |
| 15 | 18.9 | -0.64 | AGN | |
| 16 | 19.0 | -0.30 | AGN | |
| 17 | - | - | AGN | |
| 18 | 19.3 | -0.27 | AGN | |
| 19 | - | - | - | |
| 20 | 19.6 | -0.10 | AGN | |
| 21 | - | - | AGN | |
| 22 | - | - | - | |
| 23 | 19.1 | 0.29 | AGN |
is the unabsorbed flux in the 0.5–2 keV range. The X-ray to optical flux ratio is determined using (Eq. (3), Hornschemeier et al., 2001).
3.2 RX J0057.3-7325 = SXP101
RX J0057.3-7325 = AX J0057.4-7325 (Kahabka et al., 1999; Torii et al., 2000), also known as SXP101 (Coe et al., 2005), was detected in observation ID 5499 taken on 2006 March 3 (MJD 53797). Coherent pulsations with a period of s were detected in ASCA data (Torii et al., 2000). The strongest peak in both period searches of the Chandra data occurs at s (see Figure 2), however the peak in the Lomb-Scargle falls below the confidence level and would not have been regarded as significant if the source was not already known.
Edge & Coe (2003) narrowed the optical counterpart down to two sources, D and E in Table 2 in their paper. Our more precise Chandra position allows us to determine that the optical counterpart is source E, Table 2 in Edge & Coe (2003), the star MACS J0057-734 10 (Tucholke et al., 1996). This position is also consistent with 2MASS 00572706-7325192 (, , ), MACHO object 211.16415.11 (, ) and OGLE III source SMC106.7 15343 (). We find a period of d in both the OGLE III and MACHO data (Figure 4). From the Corbet diagram (Corbet, 1986) we would expect a longer period for the source, perhaps twice the detected period, however there are no strong peaks in that region of the periodogram. A period of 22.95 d is found in the X-ray data from RXTE with MJD 2452111.4 (Galache et al., in preparation). The spectrum of SXP101 is described well by a power-law with a photon index of 0.6. The resulting unabsorbed luminosity is erg s-1.

3.3 CXOU J005754.4-715630
This source was detected in observation ID 5480 taken on 2006 February 6 (MJD 53772). The temporal analysis does not reveal any significant periodicities. Within errors the position of CXOU J005754.4-715630 is consistent with USNO-B1.0 0180-0037995 (, ), 2MASS J00575428-7156306 (, , ) and OGLE III source SMC108.4 384 (). The OGLE III light curve displays slight variation ( mag) on timescales of d. The X-ray spectrum can be well-fitted with a power-law with photon index of 1.3. Statistically the data are equally well-fitted with the thermal models, however the models are very poorly constrained (see Table 2). The X-ray to optical flux ratio for this source implies that it is a background AGN.
3.4 CXOU J010014.2-730725
This source was detected in observation ID 5498 taken on 2006 March 3 (MJD 53797). The temporal analysis does not reveal any significant periodicities.
The position of CXOU J010014.2-730725 is close to the previously detected source RX J0100.2-7307 (Kahabka et al., 1999) and source 86 in the ROSAT HRI catalogue of the SMC (Sasaki et al., 2000). The archival source has a 90% confidence positional uncertainty of which encompasses the Chandra position making it probable that they are the same source. Sasaki et al. (2000) made a tentative classification of the source as a foreground star. The counterpart to CXOU J010014.2-730725 is ISO-MCMS J010014.0-730725 detected by the Infrared Space Observatory and has been classified as a long-period red variable (Cioni et al., 2003). The source position is also consistent with 2MASS 01001398-7307253 (, , ) and MACHO source 211.16591.6 (, ). The source is saturated in the OGLE III data. Cioni et al. (2003) analysed the MACHO data for periodicities. The blue light curve was considered of poor quality. The red light curve was found to have a period of 29 d. We have analysed the MACHO data, after removing all the saturated points we find a weak period at d in the red band (Figure 5). A larger peak at d is too close to one year to be considered as astrophysical in origin.
The X-ray emission from CXOU J010014.2-730725 is very soft with almost no photons above keV. The spectrum can be well-fitted with a power-law with index of 3.4 or a thermal bremsstrahlung with temperature K (see Table 2). The position of the source in the quantile-based colour-colour diagram suggests that it is a stellar coronal emission source (Hong et al., 2005). Assuming this is the case, the X-ray to optical ratio based on the thermal fit is consistent with a galactic source. The colour for the source is 1.3, consistent with an M star (M0-M2), as are the infrared colours. We classify CXOU J010014.2-730725 as a foreground star.
3.5 CXOU J010206.6-714115
Observation ID 5481 took place on 2006 February 6 (MJD 53772). Timing analysis of this object revealed a period of s with a confidence of % (see Figure 2). The data were examined to ensure that this periodicity was not an artifact of the 707 s Z dithering frequency.
The position of this pulsar coincides with the emission-line star [MA93] 1301 (Meyssonnier & Azzopardi, 1993), the mag O9 star AzV 294 (Massey, 2002), the OGLE III object SMC114.7 39 (), and 2MASS J01020668-7141161 (, , ). The colour index is (Massey, 2002) which is consistent with the value expected from the optical companion of a Be X-ray binary. The OGLE III light curve shows a strong period at d (Figure 6). This period is consistent with that predicted from the Corbet diagram (Corbet, 1986) for a 700 s Be/X-ray pulsar (following the convention of Coe et al. 2005 this source would be designated SXP700).
The X-ray spectrum of CXOU J010206.6-714115 can be well-fitted with a power-law with index of 0.4 (see Table 2). This model implies an unabsorbed luminosity of erg s-1.
3.6 CXOU J010245.0-721521
This source was detected in observation ID 5486 taken on 2006 February 10 (MJD 53776). The position of CXOU J010245.0-721521 is consistent with OGLE II SMC-SC9 168928 (, and ), a known quasar at (Dobrzycki et al., 2003). The source is also detected by MACHO and is designated 206.16775.520 (, ). The optical light curves do not show any variability. The position of the source on the QCCD indicates that the classification as a quasar is correct and the X-ray to optical flux ratio is consistent with a background AGN.


3.7 SAX J0103.2-7209 = SXP348
SAX J0103.2-7209 = 2E 0101.5-7225 = RX J0103.2-7209 was first identified by BeppoSAX in 1998 (Israel et al., 1998) and showed pulsations at a period of s. The source, also known as SXP348 (Coe et al., 2005), was also seen in ASCA data taken in 1996, with a reported pulse period of s and period derivative (with respect to BeppoSAX) of 1.7 s yr-1 (Yokogawa & Koyama, 1998). The pulse period determined from observations taken in 1999 with Chandra of s indicated that the pulsar had been spinning up with a constant rate since 1996 (Israel et al., 2000). Using serendipitous XMM-Newton observations of the source from 2000, Haberl & Pietsch (2004) measured a pulse period of s, implying that the spin-up was continuing.
We observed SXP348 on 2006 February 10 (MJD 53776). Although the highest peak in the Lomb-Scargle periodogram is at s, it falls below the 90% confidence limit (see Figure 2). While our results seem to suggest that SXP348 may still be spinning-up, due to the uncertainty on the spin period we are unable to determine if the previously observed trend is still persisting.
The pulsar has previously been identified with a mag Be star (Hughes & Smith, 1994; Israel et al., 1998), [MA93] 1367 (Meyssonnier & Azzopardi, 1993). Coe & Orosz (2000) analysed OGLE II data of the proposed optical counterpart and concluded that it was the likely companion. Timing analysis of the long-term -band OGLE II data did not show any periodic modulation in the range 1 to 50 d with an upper limit of mag. The source position is also coincident with the MACHO object 206.16776.17 (, ). Our analysis of the light curve does not reveal any coherent period in the range 1 to 1000 d. The source falls in a gap between the chips in OGLE III.
It has been shown that the spectrum of SXP348 can be well-fitted with an absorbed power-law with photon index (Israel et al., 1998; Yokogawa & Koyama, 1998; Haberl & Pietsch, 2004). We find that the X-ray emission is well-fitted by a power-law with index 0.8 (see Table 2). This fit gives an unabsorbed luminosity of erg s-1.
3.8 CXOU J010455.4-732555
This source was detected in observation ID 5497 taken on 2006 March 3 (MJD 53797). The source is located very near to the edge of the chip and only falls on the chip for part of the observation. We were therefore unable to perform a search for pulsations.
The position of CXOU J010455.4-732555 is coincident with USNO-B1.0 0165-0046936 (, , ), 2MASS 01045550-7325558 (, , ) and OGLE III source SMC111.7 8943 (). The OGLE III light curve reveals a period of d (Figure 7). The next largest peak is at 3.0238 d. It is unclear whether the true period is 1.4880 or 3.0238 d, however the values are not consistent with the shorter period being a harmonic of the longer one. The peak at d could be due to the beating of the true period with the 1 d sampling variation. If the source was a Be/X-ray binary it is hard to reconcile the detected variation with an orbital period; in this case it could be a NRP. However, the optical brightness of the object indicates that the source is likely to be a variable star. The results from the X-ray to optical flux ratio calculation are consistent with a Galactic foreground star. Further X-ray observations to search for pulsations and follow-up optical spectroscopy are needed to determine the nature of this source.
3.9 CXOU J010509.6-721146
This source was detected in observation ID 5486 taken on 2006 February 10 (MJD 53776). The temporal analysis does not reveal any significant periodicities. The location of CXOU J010509.6-721146 lies within the error circle of AX J0105-722 (Yokogawa & Koyama, 1998). A study of the region around AX J0105-722 by Filipovic et al. (2000) resolved several sources. Filipovic et al. (2000) proposed that the most likely counterpart to the ASCA source was RX J0105.1-7211. Within errors the Chandra source is also consistent with this ROSAT PSPC object. A search for the optical counterpart to the ASCA source was carried out by Coe et al. (2005). Based on H observations and temporal analysis of the H and optical data, they identified the ASCA X-ray source, designated SXP3.34, with [MA93] 1506 (Meyssonnier & Azzopardi, 1993). The position of this optical source also lies within the ASCA error circle but it is not consistent with the ROSAT or Chandra source. A search for pulsations could not be performed on the ROSAT data due to poor statistics, and we did not detect any significant pulsations in our search of the Chandra data, therefore no firm identification with AX J0105-722 can be made. The Chandra position coincides with 2MASS 01050959-7211470 (, , ), MACHO object 206.16947.35 (, ) and OGLE III source SMC113.2 13190 (). The optical light curves do not show any changes. The X-ray to optical flux ratio is -1.0, making it difficult to classify the source.
3.10 CXOU J010533.0-721331
This source was detected in observation ID 5486 taken on 2006 February 10 (MJD 53776). The temporal analysis does not reveal any significant periodicities.
The position of CXOU J010533.0-721331 is close to RX J0105.5-7213 (Filipovic et al., 2000). The statistical (90%) positional error of added in quadrature with the systematic error of gives an overall positional error of for RX J0105.5-7213. This error circle encompasses CXOU J010533.0-721331, implying that they are the same source. The position of the Chandra source coincides with the radio counterpart, J0105.5-7213 (Filipovic et al., 2000), of the ROSAT source. Filipovic et al. (2000) did not detect any optical counterpart to this source and classified it as an optically faint background AGN. However, we find that CXOU J010533.0-721331’s position is consistent with MACHO object 206.16946.1089 (, ) and OGLE III object SMC113.2 13509 (), and we propose that this source is the optical counterpart to the radio object. There are no long-term variations in the optical light curves and the X-ray to optical flux ratio is consistent with a background AGN.


3.11 CXOU J010712.6-723533
This source was detected in observation ID 5487 taken on 2006 February 10 (MJD 53776). Timing analysis of this object revealed a period of s with a confidence of % (see Figure 2).
The position of the source coincides with the emission line star [MA93] 1619 (Meyssonnier & Azzopardi, 1993). The source is also close to 2E 0105.7-7251 = RX J0107.1-7235 (Kahabka et al., 1999), taking into account the 90% confidence positional uncertainty of for this source, the position is consistent with CXOU J010712.6-723533 (following the convention of Coe et al. 2005 this source would be designated SXP65.8). 2E 0105.7-7251 has been identified with a Be star, the colour index is -1.2. CXOU J010712.6-723533’s position is consistent with 2MASS 01071259-7235338 (, , ), MACHO object 206.17055.21 (, ) and the OGLE II source SMC-SC11 48835 (). The long-term light curves show a brightening of mag over d, but no periodic modulation is detected. The source falls in a gap between the chips in OGLE III.
We fitted the spectrum of CXOU J010712.6-723533 with a power-law and a blackbody, both with photoelectric absorption. Initially we fixed the column density at cm-2. This resulted in a best-fitting power-law with index 0.3 and unabsorbed luminosity of erg s-1. Since we detected a high number of counts from this source, we also fitted the column density. In this case the spectrum was again best fit with a power-law with index 0.5, cm-2 and an unabsorbed luminosity of erg s-1 (see Table 2). Statistically the power-law fits cannot be distinguished from each other.
3.12 CXOU J010735.0-732022
This source was detected in observation ID 5496 taken on 2006 March 3 (MJD 53797). The temporal analysis does not reveal any significant periodicities. There are no optical or infrared matches for this source.
3.13 CXOU J010836.6-722501
This source was detected in observation ID 5487 taken on 2006 February 10 (MJD 53776). The temporal analysis does not reveal any significant periodicities. The position of CXOU J010836.6-722501 is consistent within errors to the position of source 117 in the ROSAT HRI SMC catalogue (Sasaki et al., 2000). The spectrum of the source was found to be hard (Haberl et al., 2000) and led Sasaki et al. (2000) to classify the source as an X-ray binary or AGN. The position of the Chandra source also coincides with MACHO object 206.17114.1658 (, ), OGLE II source SMC-SC11 116013 () and OGLE III source SMC113.1 9719 (). The long-term optical light curve shows a brightening of mag over d. As we do not detect pulsations from the source, and taking into account its position on the QCCD compared to the pulsars we have detected and its X-ray to optical flux ratio, we conclude it is likely that this source is a background AGN.
3.14 CXOU J010849.5-721232
This source was detected in observation ID 5485 taken on 2006 February 8 (MJD 53774). The temporal analysis does not reveal any significant periodicities. The position of CXOU J010849.5-721232 is consistent with the MACHO object 206.17175.739 (, ), the OGLE II object SMC-SC11 120966 () and the OGLE III object SMC118.7 galaxy (). The long-term optical light curves do not vary. The X-ray emission from CXOU J010849.5-721232 can be described by a power-law with a photon index of 1.7 or with a thermal emission model with temperature K (see Table 2). The temperature is poorly constrained and based on this the non-thermal fit is preferred. In this case the X-ray to optical ratio indicates that the source is a background AGN.
3.15 CXOU J010855.6-721328
This source was detected in observation ID 5485 taken on 2006 February 8 (MJD 53774). The temporal analysis does not reveal any significant periodicities. The position of CXOU J010855.6-721328 coincides with OGLE III source SMC118.7 galaxy and MACHO object 206.17174.524 (, ). There are no changes apparent in the optical light curves and the X-ray to optical flux ratio is consistent with a background AGN.
3.16 CXOU J011021.3-715201
This source was detected in observation ID 5483 taken on 2006 February 6 (MJD 53772). The temporal analysis does not reveal any significant periodicities. Within errors the position of CXOU J011021.3-715201 is consistent with USNO-B1.0 0181-0039286 (, , ) and OGLE III source SMC118.5 1160 (). The long-term optical light curve shows some variation ( mag) on d timescales. The X-ray to optical flux ratio implies that the source is a background AGN.
3.17 CXOU J011050.6-721025
This source was detected in observation ID 5484 taken on 2006 February 6 (MJD 53772). The temporal analysis does not reveal any significant periodicities. Within errors the position of CXOU J011050.6-721025 is coincident with the radio source [FBR2002] J011050-721026 (Filipovic et al., 2002) and OGLE III source SMC118.7 10314 (). Analysis of the long-term OGLE III light curve does not show any variations. Based on the identification of the Chandra source with a radio object suggests CXOU J011050.6-721025 is a background AGN.
3.18 CXOU J011154.2-723105
This source was detected in observation ID 5488 taken on 2006 February 12 (MJD 53778). A peak at s with confidence was detected in the Lomb-Scargle periodogram. A search using Phase Dispersion Minimisation does not find a similar modulation.
A tentative detection of an X-ray source, designated BKGS 20, from CXOU J011154.2-723105 has previously been reported (Bruhweiler et al., 1987). However, a more stringent analysis of the Einstein data by Wang & Wu (1992) failed to detect the source. The position of the Chandra source is coincident with USNO-B1.0 0174-0065503 (, , ) and the OGLE III source SMC115.5 12842 ().
The position of the source on the quantile analysis plot is intriguing (Figure 3); it seems to lie between the detected pulsars and the rest of the sources in our sample. The source shows possible pulsed emission, however the magnitudes of the optical counterpart, and its lack of variability on long timescales, indicates that it is not a Be/X-ray transient. In addition, the X-ray to optical flux ratio indicates that the source is a background AGN.
3.19 CXOU J011303.4-724648
This source was detected in observation ID 5490 taken on 2006 February 27 (MJD 53793). The temporal analysis does not reveal any significant periodicities. The position of CXOU J011154.2-723105 is consistent with OGLE III source SMC115.7 18128 (), whose light curve exhibits a brightening over d of mag.
3.20 CXOU J011744.7-733922
This source was detected in observation ID 5494 taken on 2006 March 1 (MJD 53795). The temporal analysis does not reveal any significant periodicities. A ROSAT PSPC X-ray source has previously been detected near the position of CXOU J011744.7-733922. The archival source, [HFP2000] 537 (Haberl et al., 2000), has a positional uncertainty of which encompasses the position of the Chandra source. This suggests that they are the same object. CXOU J011744.7-733922’s position is consistent with USNO-B1.0 0163-0044338 (, , ) and OGLE III source SMC117.4 3274 (). The OGLE III light curve shows a brightening of mag in d. The X-ray to optical flux ratio implies that the source is a background AGN.
3.21 CXOU J011832.4-731741
This source was detected in observation ID 5493 taken on 2006 February 27 (MJD 53793). The temporal analysis does not reveal any significant periodicities. A ROSAT PSPC X-ray source has previously been detected near to the position of CXOU J011832.4-731741. The archival source, [HFP2000] 449 (Haberl et al., 2000), has a positional uncertainty of which encompasses the position of the Chandra source. It is therefore likely that they are the same object. CXOU J011832.4-731741’s position coincides with OGLE III source SMC121.6 galaxy, which suggests that it is a background AGN.
3.22 CXOU J012027.3-724624
This source was detected in observation ID 5491 taken on 2005 July 24 (MJD 53575). The temporal analysis does not reveal any significant periodicities. The position of CXOU J012027.3-724624 coincides with OGLE III source SMC120.7 6336 (). The long-term optical light curve does not show any variability.
3.23 CXOU J012223.6-730848
This source was detected in observation ID 5492 taken on 2005 August 12 (MJD 53594). A peak with confidence was detected in the Lomb-Scargle periodogram at s, however there is no corresponding strong peak in the Phase Dispersion Minimisation periodogram. Analysis of the data with the method used for finding pulsars in RXTE data (Galache, 2006) reveals a possible periodicity at 282.49 s, approximately twice the value from the Lomb-Scargle periodogram. In this method the light curve is folded on the period found in the Lomb-Scargle to produce a pulse profile. The pulse profile is then used as a template to subtract the pulsations from the light curve. A Lomb-Scargle periodogram is generated for the cleaned light curve, and this power spectrum is subtracted from the original. The resulting power spectrum shows only the contribution of the pulsar to the Lomb-Scargle, allowing possible harmonics that may have been lost in the noise to be detected.
The position of CXOU J012223.6-730848 is consistent with USNO-B1.0 0168-0053065 (, , ) and OGLE III source SMC121.4 542 (). There are no changes detected in the optical light curves. The X-ray spectrum is described equally well by a power-law with photon index 1.5 and a bremsstrahlung with a temperature of K (see Table 2). The temperature is poorly constrained and we therefore prefer the non-thermal fit to the data.
The optical magnitude, lack of long-term variability in the optical light curve and the position of the source on the QCCD (see Figure 3 and Section 4) suggests that this source may not be a pulsar. The X-ray to optical flux ratio determined using the non-thermal model fit implies that the source is a background AGN. Further observations are needed to verify the existence of pulsations and determine the nature of the source.
4 Discussion
Observations have shown that the SMC contains a large number of HMXBs, providing a homogeneous sample with which to investigate the evolution of the SMC, and to compare with our Galaxy. The HMXBs are tracers of very young populations and the SMC seems to have a particularly prominent young population. To date, studies of the SMC have mostly concentrated on the Bar of the SMC. To obtain a full picture of the history of the SMC we need to broaden our study and include the outer regions of the SMC.
In this first paper from the SMC Wing Survey we have investigated the X-ray and optical characteristics of the 23 brightest X-ray sources. The temporal analysis, combined with identification of the optical counterparts, shows that our sample contains four pulsars, two newly detected and two previously known. The statistical significance of this cannot be determined until a full analysis of the entire SMC Wing Survey has been performed. The other sources include a quasar and possibly two foreground stars. The classification of the remainder are not conclusive, but the lack of pulsations, long-term periodic variability, optical identifications and X-ray to optical flux ratios imply that they are most likely background AGN. The classifications of several of the sources from the literature would seem to agree with this. If the preliminary classifications we have presented in this paper are confirmed our results indicate that the spectral hardness and quantile analysis could be used to distinguish between different classes of object (see below).
We have analysed the spectra of the 11 sources that have counts (see Table 2). Apart from source #4, which is probably a variable star, most of the objects exhibit non-thermal emission. We have been able to fit the spectra of all four pulsars in our sample, their power-law indices display a limited range of values with an average of 0.5 and standard deviation of 0.2. In comparison, the spectra of the remaining seven sources with counts have softer spectra, with an average photon index of (excluding #4). Haberl & Pietsch (2004) found that the distribution of photon indices for SMC HMXBs, mainly located in the Bar, had an average of . This is in agreement with the Bar pulsars studied by Edge et al. (2004) that have an average photon index of . In general, the pulsars that we have detected in the Wing have harder spectra than those in the Bar.
It is likely that the pulsars have a higher intrinsic neutral hydrogen column density than the AGN, however it is puzzling why the Wing pulsars as a group are harder/more absorbed than the Bar group. Could the Wing pulsars be situated at the back of the SMC? The work of Laney & Stobie (1986) would seem to rule out that possibility as they found that the Wing lies in front of the main body of the SMC. It is more likely that small number statistics are contributing to the observed division of sources.
A large fraction of our sources are too faint to extract a meaningful spectrum. By constructing a quantile-based colour-colour diagram we have been able to investigate the spectral properties of all 23 sources in our sample (see Figure 3). Our analysis shows that the pulsars we have detected in the Wing fall in a distinct group on the QCCD. The location of the Bar pulsars from Edge et al. (2004) also seem to fall in the harder part of the diagram, but the separation of sources is less clearly defined, with one source falling amongst the softer sources from the Wing. There does not seem to be anything remarkable about this particular Wing pulsar. The softer sources include an identified star, quasar and possible AGN. The source that appears to sit in the transition region between the majority of the pulsars and the other sources is CXOU J011154.2-723105 (source #18). This object displays a possible pulsation of 19.52 s, but its optical magnitude and lack of long-term variability seems to rule out a Be/X-ray transient, and the nature of the source remains unclear.
The classification of all of the sources will require optical spectroscopy, but the QCCD may be a useful tool for distinguishing pulsars from other types of object (stars, quasars, AGN) for the fainter X-ray sources in the SMC Wing survey.
5 Summary
We have detected two new pulsars, CXOU J010712.6-723533 and CXOU J010206.6-714115, and observed two previously known pulsars, SXP101 and SXP348. With the accurate positions provided by Chandra we have been able to determine new optical identifications for the two new pulsars, CXOU J010712.6-723533 and CXOU J010206.6-714115, and SXP101. We have found long-term optical periods of 267 d and 21.9 d for CXOU J010206.6-714115 and SXP101, respectively.
Acknowledgments
AU was supported by the BST grant of the Polish MNSW. RHDC and SL acknowledge support from Chandra/NASA grant GO5-6042A/NAS8-03060. This research has made use of the SIMBAD data base, operated by CDS, Strasbourg, France. This paper utilizes public domain data originally obtained by the MACHO Project, whose work was performed under the joint auspices of the U.S. Department of Energy, National Nuclear Security Administration by the University of California, Lawrence Livermore National Laboratory under contract No. W-7405-Eng-48, the National Science Foundation through the Center for Particle Astrophysics of the University of California under cooperative agreement AST-8809616, and the Mount Stromlo and Siding Spring Observatory, part of the Australian National University.
References
- Alcock et al. (1999) Alcock C., et al., 1999, PASP, 111, 1539
- Corbet (1986) Corbet R.H.D., 1986, MNRAS, 220, 1047
- Bruhweiler et al. (1987) Bruhweiler F.C., Klinglesmith D.A. III, Gull T.R., Sofia S., 1987, ApJ, 317, 152
- Cash (1979) Cash, W. 1979, ApJ, 228, 939
- Cioni et al. (2003) Cioni M.-R.L., et al., 2003, A&A, 406, 51
- Coe & Orosz (2000) Coe M.J., Orosz J.A., 2000, MNRAS, 311, 169
- Coe et al. (2005) Coe M.J., Edge W.R.T., Galache J.L., McBride V.A., 2005, MNRAS, 356, 502
- Dobrzycki et al. (2003) Dobrzycki A., Macri L.M., Stanek K.Z., Groot P.J., 2003, AJ, 125, 1330
- Edge & Coe (2003) Edge W.R.T., Coe M.J., 2003, MNRAS, 338, 428
- Edge et al. (2004) Edge W.R.T., Coe M.J., Galache J.L., McBride V.A., Corbet R.H.D., Markwardt C.B., Laycock S., 2004, MNRAS, 353, 1286
- Edge et al. (2005) Edge W.R.T., Coe M.J., Galache J.L., McBride V.A., Corbet R.H.D., Okazaki A.T., Laycock S., Markwardt C.B., Marshall F.E., Udalski A., 2005, MNRAS, 361, 743
- Filipovic et al. (1998) Filipovic M.D., 1998, A&AS, 127, 119
- Filipovic et al. (2000) Filipovic M.D., Haberl F., Pietsch W., Morgan D.H., 2000, A&A, 353, 129
- Filipovic et al. (2002) Filipovic M.D., Bohlsen T., Reid W., Staveley-Smith L., Jones P.A., Nohejl K., Goldstein G., 2002, MNRAS, 335, 1085
- Galache (2006) Galache J.L., 2006, PhD Thesis, 78
- Gardiner & Noguchi (1996) Gardiner L.T., Noguchi M., 1996, MNRAS, 278, 191
- Grimm, Gilfanov & Sunyaev (2003) Grimm, H.-J., Gilfanov M.R., Sunyaev R.A., 2003, MNRAS, 339, 793
- Haberl et al. (2000) Haberl F., Filipovic M.D., Pietsch W., Kahabka P., 2000, A&AS, 142, 41
- Haberl & Pietsch (2004) Haberl F., Pietsch W., 2004, A&A, 414, 667
- Hong et al. (2004) Hong J., Schlegel E.M., Grindlay J.E., 2004, ApJ, 614, 508
- Hong et al. (2005) Hong J., van den Berg M., Schlegel E.M., Grindlay J.E., Koenig X., Laycock S., Zhao P., 2005, ApJ, 635, 907
- Horne & Baliunas (1986) Horne J. H., Baliunas S. L., 1986, ApJ, 302, 757
- Hornschemeier et al. (2001) Hornschemeier A.E., et al., 2001, ApJ, 554, 742
- Hughes & Smith (1994) Hughes J.P., Smith R.C., 1994, AJ, 107, 4
- Israel et al. (1998) Israel G.L., Stella L., Campana S., Covino S., Ricci D., Oosterbroek T., 1998, IAUC 6999, 1
- Israel et al. (2000) Israel G.L., et al., 2000, ApJ, 531, 131
- Kahabka et al. (1999) Kahabka P., Pietsch W., Filipovic M.D., Haberl F., 1999, A&AS, 136, 81
- Kennicutt (1991) Kennicutt R.C., Jr., 1991, in Haynes R.F., Milne D.K., eds., Proc. IAU Symp. 148, The Magellanic Clouds. Reidel, Dordrecht, p. 139
- Kovács (1981) Kovács G., 1981, Ap&SS, 78, 175
- Laney & Stobie (1986) Laney C.D., Stobie R.S., 1986, MNRAS, 222, 449
- Laycock et al. (2005) Laycock S., Corbet R.H.D., Coe M.J., Marshall F.E., Markwardt C., Lochner J., 2005, ApJS, 161, 96
- Maccacaro et al. (1988) Maccacaro T., Gioia I.M., Wolter A., Zamorani G., Stocke J.T., 1988, ApJ, 326, 680
- Massey (2002) Massey P., 2002, ApJS, 141, 81
- Mennickent et al. (2002) Mennickent R.E., Pietrzynski G., Gieren W., Szewczyk O., 2002, A&A, 393, 887
- Meyssonnier & Azzopardi (1993) Meyssonnier N., Azzopardi M., 1993, A&AS, 102, 451
- Nazé et al. (2003) Nazé Y., Hartwell J.M., Stevens I.R., Manfroid J., Marchenko S., Corcoran M.F., Moffat A.F.J., Skalkowski G., 2003, ApJ, 586, 983
- Sasaki et al. (2000) Sasaki M., Haberl F., Pietsch W., 2000, A&AS, 147, 75
- Schmidtke & Cowley (2006) Schmidtke P.C., Cowley A.P., 2006, AJ, 132, 919
- Shtykovskiy & Gilfanov (2005) Shtykovskiy P., Gilfanov M., 2005, MNRAS, 362, 879
- Stanimirović et al. (1999) Stanimirović S., Staveley-Smith L., Dickey J.M., Sault R.J., Snowden S.L., 1999, MNRAS, 302, 417
- Szymański (2005) Szymański M.K., 2005, AcA, 55, 43
- Torii et al. (2000) Torii K., Kohmura T., Yokogawa J., Koyama K., 2000, IAUC, 7441, 2
- Tucholke et al. (1996) Tucholke H.-J., De Boer K.S., Seitter W.C., 1996, A&AS, 119, 91
- Udalski et al. (1997) Udalski A., Kubiak M., Szymański M., 1997, AcA, 47, 319
- Wang & Wu (1992) Wang Q., Wu X., 1992, ApJS, 78, 391
- Westerlund (1997) Westerlund B., 1997, The Magellanic Clouds, Cambridge Univ. Press, Cambridge
- Yokogawa & Koyama (1998) Yokogawa J., Koyama K., 1998, IAUC 7009, 3