The 8gr8 Cygnus Survey for New Pulsars and RRATs
Abstract
We are currently undertaking a survey to search for new pulsars and the recently found Rotating RAdio Transcients (RRATs) in the Cygnus OB complex. The survey uses the Westerbrok Synthesis Radio Telescope (WSRT) in a unique way called the 8gr8 mode, which gives it the best efficiency of any low-frequency wide-area survey. So far we have found a few new pulsars and the routines for the detection of RRATs are already implemented in the standard reduction. We expect to find a few tens of new pulsars and a similar number of RRATs. This will help us to improve our knowledge about the population and properties of the latter poorly known objects as well as provide an improved knowledge of the number of young pulsars associated with the OB complexes in the Cygnus region.
1 The 8gr8 survey of pulsars and RRATs
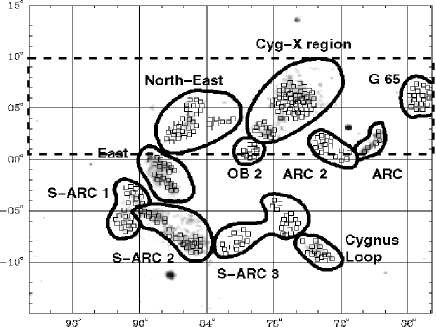
The 8gr8 Cygnus Survey will cover the region of the Galactic plane located between and respectively, covering around 420 sq deg. in Cygnus. This region is known as the Cygnus superbubble ([Uyanıker et al. 2001]), contains a lot of OB associations and hot gas that might be generated by SN explosions, producing a large amount of compact objects ([Perna & Gaensler 2004]).
In these regions we expect to find significant numbers of young pulsars. [Dewey et al. 1985] made a previous survey in this area finding a few tens of new pulsars. In the 8gr8 survey, we expect to have about 5 times better sensitivity than the previous surveys, for pulsars with s, and more than an order of magnitude for those with s. The 8gr8 survey will cover an area of the sky which has not been revisited in the latest big surveys for pulsars and according to our simulations we expect to find a few tens of pulsars.
1.1 Current pulsar surveys
Recent pulsar surveys have not been able to cover all of this region of Galactic plane and this survey provides an excellent way to do this with high sensitivity. To date the most successful survey is the Parkes Multibeam Survey ([Manchester et al. 2001]) which has discovered approximately half of the known pulsars.
This survey covered a region of the sky located along the Galactic plane at low latitude () and with a Galactic longitude of . This survey applied a multibeam technique using a receiver with 13 beams.
Another remarkable survey is the Arecibo-P Alfa survey ([Cordes et al. 2006]). This survey expects to find a few hundred new pulsars and is concentrated at very low Galactic latitudes and along the region of the Galactic plane visible from Arecibo, and from . This survey uses 7 beam receivers and to date has found, a few tens of new pulsars.
1.2 RRATs a new type of sources
These recently discovered RRATs are a new type of radio sources, and are one of the most extreme and powerful radio emitters. They were found by [McLaughlin et al. (2006)], in the Parkes Multibeam Survey. The 11 known RRATs are located at low Galactic latitudes (), they show burst of radio–emission that last between 2 and 30 ms. They can not be detected using the standard Fourier techniques used for pulsars making their detection very difficult. These sources have periods within the range 0.4–7 s, measured by analysing the arrival times of the individual pulses. For three of them, there are period derivatives now known, with values that vary from 7.87 to 12.6 10-15ss-1. These values imply the presence of a very strong magnetic field ( G). The true nature of the RRATs is still unknown. There is no consensus about the origin of their powerful bursts and also about their evolutionary stage. They have been related to different types of neutron stars: (a) radio quiet X–ray NS population somehow related with the AXPs and SGR, possible magnetar candidates (McLaughlin et al. 2006), see also ([Haberl 2004]) and ([Woods & Thompson 2004]); (b) isolated neutron stars ([Reynolds et al. 2006]); (c) re-activated radio pulsars ([Zhang & Dyks 2006]) and, (d) bright pulses of distant pulsars like PSR B0656+14 ([Weltevrede et al. 2006]).
Finding new pulsars and new RRAT–like sources will allow us to better understand the life-cycle of massive stars, their population, and to test, with better statistics, the theoretical models that predict the evolution and behaviour of these systems. Finally pulsars can provide a uniqe oportunity to study extreme gravitational fields and are excelent systems for testing General Relativity.
2 A low frequency survey
Most of the recent pulsar surveys have been carried out at frequencies near 400 MHz, or at 1.4 GHz for the Parkes Multibeam Survey ([Manchester et al. 2001]) and P–Alfa surveys ([Cordes et al. 2006]). Our survey is performed at 328 MHz to maximise the field-of-view/sensitivity trade off. The WRST in the 8gr8 mode allows us to explore this frequency range with better sensitivity than other radio telescopes. The observations are made using 12 WSRT telescopes which are arranged to form a grating array (i.e. they are equally spaced). The data is then combined in such a way that we have 8 separate beams pointing at different locations in the primary beam. Thus we get the sensitivity of all 12 dishes but a beam size of just one! To reach our sensitivity goals and to optimize the data reduction, our observations have samples with a sampling time of 819.2 s and a total dwell time of 6872s. In total we have 72 observation points and between 900 and 2200 beams per pointing. For each pointing we have a minimum of two observations, the original observation and a comparison observation.

3 Reducing the data
The observations were made between 2004 and 2005. Each observation consists of 8 sets of data of 10 MHz wide, per main beam. The data goes from the receivers located in the focal plane of each antenna to a tied array beam former that compensates for delays in arrival times due to the separation of the antenas. The data is then digitized using a digital filterbank known as the Pulsar Machine–PuMa ([Voûte et al. 2002]) which converts the analogue data into spectra of 512 frequency channels. These sets of data are stored locally for latter off–line analysis.
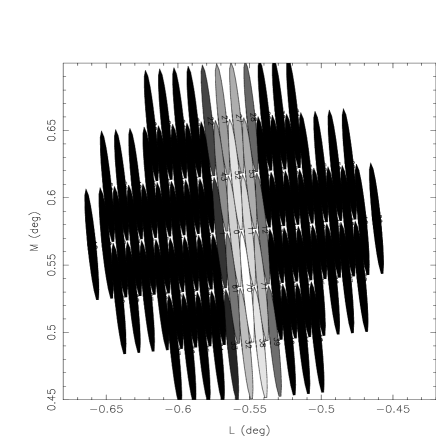
The first step in our analysis is to form dedispersed timeseries for a number of trial DM values. This is done using a cluster of computers with 31 nodes. In the same cluster, once the data is dedispersed, we combine the 8 beams into an array of sub–beams; the number depends on the position of the main beam on the sky (see Fig. 2). Each of the sub-beams is searched for periodicities and for single pulses. A typical search run takes between one and two days of computing time. For our reduction and also for the pulsar search described below, we are using the pse software developed by Russell Edwards with the single pulse search extensions discussed below.
3.1 Pulsar search
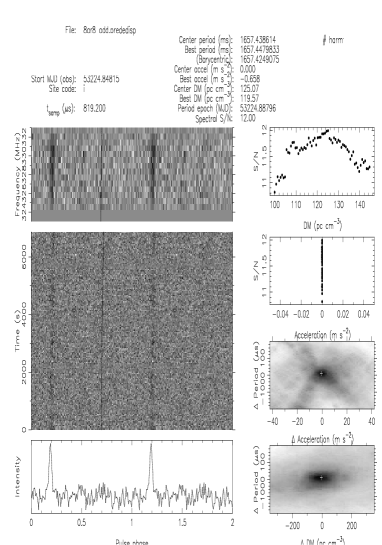
For the pulsar search, we use the so–called standard search, calculating an FFT for each time series per DM value. For the 8gr8 survey our DM range goes from 0 to 1200 pc cm-3. Once a candidate is identified a refined analysis is performed to get the best period and DM value for it. This analysis includes trying values for linear acceleration steps. The correction for acceleration should lead to a sharper pulse profile for real binaries.
A possible candidate for a new pulsar should have a plot like that shown in Fig. 3. and also it must appear at the same position in both of the beam plots for the first and for the comparison observations. In Fig 2 we show one of the beams for the pulsar candidate shown in Fig 3.
3.2 Single pulse search
For the detection of RRATs, we have implemented an approach similar to the one used by [McLaughlin et al. (2006)], this consists of a search in the data for high S/N events with the same DM value as shown in Fig. 4. We have also implemented a collection of scripts to search for high SN events (above the 5– threshold detection limit), and also for events at the same DM values. This will allow us to detect RRAT–like sources and potentially dim pulsars, without having to manually view many thousands of plots.
4 Work in progress & future plans
The aim of the survey is to locate as many candidates for pulsars and RRATs within the Cygnus region. We have already found a few candidates for new pulsars and we are already implementing and performing the analysis to search for RRATs. Besides this, we expect to make a comprehensive analysis of the data we have so far:
-
We expect to make an individual analysis of sources in order to establish their properties.
-
We have completed the search for new pulsars in a large fraction of the 72 observation points in the DM range 0-700 pc cm-3. We expect to have all the observations reduced in the near future.
-
We are currently undertaking the analysis of the 72 observations to search for RRAT sources.
-
A long term goal is to perform a multiwavelength follow up analysis of the objects to search for possible optical and high energy counterparts.
Acknowledgements.
We gratefully acknowledge the support by the LKBF and UvA for attending this conference.References
- [Uyanıker et al. 2001] Uyanıker, B., Fürst, E., Reich, W., Aschenbach, B., & Wielebinski, R. 2001, A&A, 371, 675
- [Perna & Gaensler 2004] Perna, R., & Gaensler, B. M.2004, ApJ, 606, 326
- [Dewey et al. 1985 ] Dewey, R. J., Taylor, J. H., Weisberg, J. M., & Stokes, G. H. 1985, ApJL, 294, L25
- [McLaughlin et al. (2006) ] McLaughlin, M. A.; 2006, Nat, 439, 817
- [Reynolds et al. 2006 ] Reynolds,S.P.; 2006 ApJL, 639, L71.
- [Zhang & Dyks 2006 ] Zhang, B, Dyks, J.; 2006 astro–ph0601063
- [Weltevrede et al. 2006 ] Weltevrede, P., et al. 2006, ApJL 645 L149.
- [Manchester et al. 2001] Manchester R.N. 2001, MNRAS, 328 17.
- [Cordes et al. 2006] Cordes, J. M., et al.2006, ApJ, 637, 446
- [Woods & Thompson 2004 ] Woods, P. M., & Thompson, C. 2004, ArXiv Astrophysics e-prints, arXiv:astro-ph/0406133
- [Haberl 2004 ] Haberl, F. 2004, Advances in Space Research, 33, 638
- [Voûte et al. 2002] Voûte, J. L. L., Kouwenhoven, M. L. A., van Haren, P. C., Langerak, J. J., Stappers, B. W., Driesens, D., Ramachandran, R., & Beijaard, T. D. 2002, A & A, 385, 733