2 Departamento de Física Teórica, C-XI, Universidad Autónoma de Madrid, 28049 Madrid, Spain
11email: alonginotti@sciops.esa.int
An X-ray look at the Seyfert 1 Galaxy Mrk 590: XMM-Newton and Chandra reveal complexity in circumnuclear gas
Abstract
Context. This paper reports on a partially simultaneous observation of the bright Seyfert 1 Galaxy Mrk 590, performed by XMM-Newton and Chandra.
Aims. The long exposure ( 100 ks) allows to investigate with great detail the Fe K complex at 6-7 keV and the presence of soft X-ray spectral features.
Methods. We have analysed XMM-Newton data from the European Photon Imaging Camera (EPIC) in the 0.5-12 keV band and from the Reflection Grating Spectrometer (RGS) in the 0.35-2.5 keV band, and data from the High Energy Transmission Gratings (HETGs) onboard Chandra. UV and optical data from the Optical Monitor (OM) onboard XMM-Newton are also included in the analysis.
Results. The broad band spectrum is well described by an unabsorbed power law and three unresolved Fe K lines in the 6-7 keV range. The presence of a Compton reflection component and a narrow Fe K line at 6.4 keV is consistent with an origin via torus reflection. The ionised Fe lines at 6.7 and 7 keV are instead most likely originated by scattering on a warm and ionised gas. The soft X-ray spectrum appears to be almost featureless due to the very bright continuum emission, except for one emission line identified as OVIII Ly detected at 19 by both RGS and Chandra-MEG. The emerging picture consists of an active nucleus seen directly on a “clean” line of sight without intervening material, surrounded by photoionised circumnuclear gas at a high ionisation level. We also study three serendipitous sources in the field of view of Chandra and XMM-Newton. One of these sources may be identified with an ULX of L0.3-10keV41040 ergs/s.
Key Words.:
Galaxies: Seyfert – Galaxies: individual:Mrk 590 – Line: profiles1 Introduction
Active Galactic Nuclei have been observed in the X-ray domain for many years. Nowadays, it is fair to say that the overall spectral shape of Seyfert 1 Galaxies is quite well-known. The hard X-ray continuum (2-10 keV) is well described by a power law produced by Inverse Compton scattering (Haardt & Maraschi 1993) with average photon index 1.9 (Piconcelli et al. 2005). The extrapolation of the power law to lower energies in some cases implies an excess in soft X-ray emission; in many sources the soft X-ray spectrum is affected by absorption or emission features originated in a photoionised medium along the line of sight (Kaastra et al. 2000, Kaspi et al. 2001).
Reflection of X-ray photons by optically thick material may also occur and in this case it gives rise to a hard X-ray Compton reflection component and prominent Fe K features (George & Fabian 1991). The properties of Fe K features can provide much information on the origin of the X-ray emitting gas. In the case of reflection by an accretion disc, the Fe line profile is relativistically broadened and skewed (Fabian et al. 2000). When X-ray photons are reflected by distant material, like the torus proposed in the Unification Scheme (Antonucci 1993, Ghisellini, Haardt & Matt, 1994), the resulting profile is narrow and, in most cases, unresolved by the current instrumentation. Since Fe K lines could also be produced in the Broad Line Region (BLR) in an analogous way to the broad UV/Optical lines, a contribution of the BLR emission to the cores of narrow Fe lines cannot be excluded (Yaqoob & Padmanabhan 2004, Nandra 2006).
What is as yet unclear is which scenario is the most common in Sy1 Galaxies. Recent observations with XMM-Newton and Chandra have shown that a narrow Fe K line is an almost ubiquitous component in the X-ray spectra of type-1 AGNs (Yaqoob & Padmanabhan 2004, Jimenez-Bailon et al. 2005). On the other hand, only a handful of sources seem to host a relativistically broadened diskline (Nandra et al. 1999, Turner et al. 2002, Ponti et al. 2002, Longinotti et al. 2003).
Mrk 590 (z=0.026) is a bright Seyfert 1 galaxy. It was observed by the Einstein observatory (Kriss et al. 1980) and by HEAO 1 as part of the Piccinotti sample (Piccinotti et al. 1982). Exosat data of Mrk 590 did not reveal any particular spectral complexity (Turner & Pounds 1989). More recently, it was detected in the high-energy domain by BATSE, in the 20-200 keV band (Malizia et al. 1999). Despite of being part of one of the best studied AGN sample (the Piccinotti’s), Mrk 590 has not been observed by ASCA nor by BeppoSAX. Therefore, the hard X-ray spectral properties of this AGN have remained almost unknown until the analysis of a 10 ks XMM-Newton observation was reported by Gallo et al. (2006). In this work, the 0.3-10 keV flux was reported to be about 8.410-12 ergs cm-2 s-1, the 2-10 keV luminosity was 0.71043 ergs s-1 and the presence of a strong Fe K line was revealed in the EPIC data. Here, we will discuss a quasi simultaneous observation of this source performed by XMM-Newton and Chandra for about 100 ks.
2 Observation and data reduction
2.1 The XMM-Newton data
Mrk 590 was observed by XMM-Newton on July 4, 2004 (OBSID 0201020201). Data from the EPIC, RGS and OM instruments were available (Struder et al. 2001; Den Herder et al. 2001, Mason et al. 2001). The nominal duration time was 100 ks. The observation was performed in Small Window mode for the pn and the MOS1 cameras, while the MOS2 was operated in Full Frame. The raw data were processed with SAS 6.5.0 with the tasks epchain for the pn data and emchain for the MOS data. During the satellite operation, the scheduled observation was stopped for about 15 minutes due to telemetry loss, so that two distinct event lists were obtained for each detector. These two event files were then merged in one file by running the SAS task merge (Gabriel et al. 2004). Screening for flaring background due to high-energy particle was applied to this final event list. Intervals affected by background flares were removed by selecting events with a count rate lower than 0.6 cts/s in the 10-12 keV light curve. Source and background counts were extracted from circular regions of 40 arcsec. No pile-up affects the observation, as tested with the task epatplot, so that pattern 0 to 4 were selected for the pn spectra and pattern 0 to 12 were selected for the MOS ones. The effective exposures times are 71, 85 and 90 ks respectively for the pn, MOS1 and MOS2 (see Table 1). Because of the different observing modes of the MOS data, it was not possible to co-add the spectra and therefore they are kept and analysed separately. Spectra were grouped in order to have 100 counts/bin for the pn data and 50 counts/bin for the MOS. Response matrices were created employing the SAS tasks arfgen and rmfgen for EPIC data.
RGS data were processed with the task rgsproc, yielding an useful exposure time of 105 ks. A response matrix was created for the spectral analysis by the task rgsrmfgen. No binning is applied to the RGS spectra. The data from the Optical Monitor were reduced running the task omichain.
| Satellite | Instrument | Exposure | Flux2-8 |
|---|---|---|---|
| - | - | (ks) | (10-12 ergs cm-2 s-1) |
| Chandra | HETG | 95 | 6.72 |
| XMM-Newton | EPIC/pn | 71 | 5.620.09 |
| EPIC/MOS1 | 85 | 5.970.09 | |
| EPIC/MOS2 | 90 | 5.600.09 | |
| RGS | 105 | - |
During the XMM-Newton observation, the source did not vary significantly in flux and it did not show spectral variations. The light curves of the pn data plotted in Fig. 1 do not reveal any particular temporal behaviour. Therefore, the spectral analysis described in the following sections is performed on the integrated spectrum.

2.2 The Chandra data
Mrk 590 was observed by Chandra HETG (High Energy Transmission Gratings: Canizares et al. 2005) in July 2004 for about 100 ks. The Chandra HETGS consists of two assemblies, the High Energy Grating (HEG) in the 0.8-10 keV, and the Medium Energy Grating (MEG), in the 0.4-5 keV. Data were reduced with the Chandra Interactive Analysis of Observations (ciao) 3.2.1 and the Chandra Calibration Database (caldb) 3.0.1, adopting standard procedures. In particular, a new evt2 file was created with acis_process_events, adopting an observation-specific bad pixel file and reconstructing the gratings extraction region and events with tgdetect, tg_create_mask and tg_resolve_events. An exam of the light curve confirms that no variability is observed during the Chandra exposure, as already emerged for the XMM-Newton data. First-order HEG and MEG spectra were extracted with tgextract and then co-added with add_grating_orders. In the following analysis, we binned the spectra at the resolution of the instruments, i.e. 0.012 and 0.023 (FWHM), for HEG and MEG, respectively. The C-statistic was employed in the spectral fitting and all statistical errors are given at 90% level of confidence (C=2.71).
3 Spectral analysis
3.1 XMM-Newton/EPIC spectra
Galactic absorption of column density NH=2.7 1020cm-2 is included in all the following spectral fits (Dickey & Lockman, 1990). Errors are quoted at the 90% confidence level for one interesting parameter (i.e. =2.71). Throughout the text, the energies are quoted in the source frame and the adopted cosmological constant is H0=70 km s-1Mpc-1. The measured flux and luminosity in the soft and hard X-ray band are: F0.3-2keV4.410-12 ergs cm-2 s-1, L0.3-2keV0.671043 ergs s-1 and F2-10keV6.410-12 ergs cm-2 s-1, L2-10keV0.971043 ergs s-1.
EPIC 2-12 keV best-fit: plaw+3 zgauss
ELine
EW
Flux
/dof
(keV)
(eV)
(eV)
(10-6 ph cm-2s-1)
6.39
36
121
9.621.07
948/964
7.02
57
52
3.61
-
6.70
85
18
1.61
-
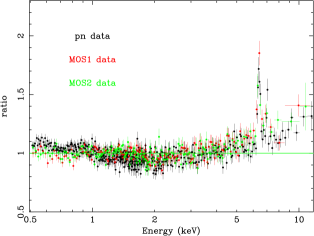
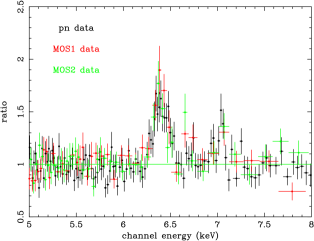
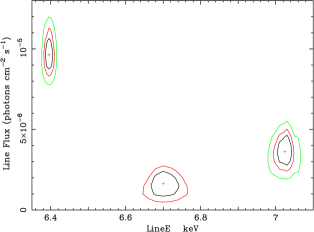
When the EPIC spectrum is fitted in the 0.5-12 keV energy range with a simple power law model, the residuals clearly reveal strong emission in the Fe K complex and emission in excess in the hard X-ray continuum (Fig. 2). The energy range has therefore been restricted to the 2-12 keV band in order to investigate this region of the spectrum. Fitting the data with a power law of photon index 1.6 yields an unacceptable fit (/d.o.f.=1209/971). A zoom of the ratio of the hard X-ray data to a power law model is shown in the top panel of Fig. 3: three emission lines are clearly seen in all the three detectors in the 6-7 keV range. Three Gaussian emission lines were added, initially with width free to vary. The best-fitting lines parameters are summarised in Table 2. Adding a 6.4 keV line yields an improvement in =215, for 3 d.o.f. The line width can be constrained for this line to =36 eV. A second line at 7.020.02 keV improves the fit of =36, for 2 d.o.f. with an upper limit on the line width of 57 eV. The width is thus kept fixed to 1 eV. A third line is detected with lower significance at 6.7 keV with an upper limit on the width of 85 eV (=10 for 2 d.o.f.). The line width is kept fixed to 1 eV, as for the previous case. The confidence contours for these three lines are plotted in the bottom panel of Fig. 3.
In the following, we analyse the spectrum over the entire energy range using the pn data only, since adding the MOS does not yield a relevant improvement for the analysis of the continuum. Nonetheless the MOS have been checked and they are confirmed to be consistent with the pn results. The power law+3 gaussian lines fit extended to the full energy range is not satisfactory (/d.o.f.=1173/750): the presence of a soft X-ray component is clear when the data below 2 keV are taken into account (Fig. 4). The data were checked for the presence of Compton reflection since the narrow neutral Fe K line is likely to be originated via reflection onto optically thick matter and the residuals still present above 5-6 keV indicate that this may be the case. A PEXRAV component (Magdziarz & Zdziarski, 1995) with an inclination angle fixed to 30∘ was thus added to the model. The reflection parameter is defined as R= with R1 if the reprocessing material covers 2 of the source. The addition of the reflection component improves the considerably (/d.o.f.=811/749), but the fit yields an extremely high reflection fraction, R3.6, and unsatisfactory residuals in the soft X-ray band. We have then tested for the presence of two additional components i.e. absorption and blackbody emission. No absorption seems to be required by the data and in fact neither cold (model WABS), nor warm absorber (ABSORI) models improve significantly the fit. Adding a blackbody component instead yields /d.o.f.=762/747, with best-fitting parameters =1.73, R=1.3 and blackbody temperature kT=156 eV. We note that the blackbody parameters are in good agreement with the results from Gallo et al. 2006. The spectrum fitted with this model and the resulting residuals are plotted in Fig.5. The description of the soft excess with a blackbody model is somewhat unsatisfactory. The issue of finding a physical explanation for the soft excess represent a well-known problem in AGNs studies (e.g. Gierlinski & Done, 2004). It has been shown in fact that the majority of Active Nuclei are characterised by the same temperature (kT0.1 keV, see Piconcelli et al. 2005, Crummy et al. 2006) when their soft X-ray spectra are fitted with a blackbody model. This is in contradiction with the prediction that the blackbody spectrum emitted by an accretion disc associated to a super-massive black hole emits at a much lower temperature (i.e. tens of eV). Alternative models have been tried in the following. A broken power law with break energy around 1.9-2 keV and with soft=1.890.01 and hard=1.620.01, yields a slightly better fit (/d.o.f.=758/746). This implies that the shape of the soft X-ray spectrum is not compatible only with a blackbody spectrum. Recently, the REFLION model (Ross & Fabian, 2005) has been successfully employed to fit the soft excess in AGN providing that relativistic blurring is applied to the spectrum (Crummy et al. 2006). The presence of the ionised Fe lines may suggest an origin in an ionised accretion disc, although there is no evidence of relativistic effects in Mrk 590, mainly because the Fe lines profiles are found to be narrow. We have tested REFLION with a power law and a narrow Gaussian line at 6.4 keV (which would not be calculated by the photoionised disc code). This model does not improve the fit statistic (/d.o.f.=793/750) and neither it does provide a good fit to the ionised lines. We conclude that ionised reflection and a disc origin for the ionised Fe lines can be excluded in this case.


3.2 XMM-Newton/RGS spectra
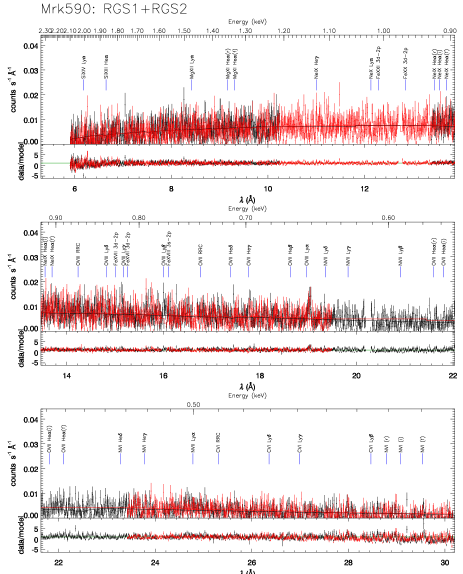
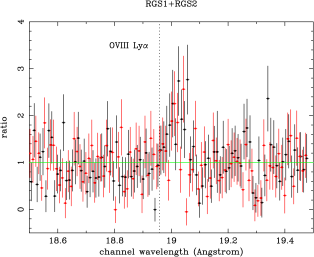
The absence of intrinsic absorption in the soft X-ray spectrum emerged by the analysis of the EPIC data, is confirmed by looking at the RGS spectrum (Fig. 6). Indeed no obvious emission or absorption features are visible above the noise, except for the OVIII Ly at 19 . The unbinned spectrum was therefore analysed with XSPEC in a small wavelength range around this emission line with the aim to perform a “local” fit. The C-statistic (Cash 1976) was applied because some energy bins may fall in the limit of few number of counts. Statistical errors are given at 90% level of confidence (C=2.71). The ratio of the data in the 18-20 to a model consisting of a power law and the Galactic absorption, is plotted in Fig.7: a narrow line is evident in the data. When the line is fitted with a 0-width Gaussian profile, it is detected at =19.020.01 with C=25.5 for 2 d.o.f. The flux is 1.0610-5 photons cm-2 s-1. The line appears to be emitted with some not negligible shift (=0.060) with respect to the rest wavelength of the OVIII Ly i.e. =18.96 .
We have checked the spectrum for the presence of similar shifts in other emission features, but the X-ray continuum is so intense that it may well hamper the detections of other line complexes. The only emission structure that may be strong enough to be detected is the OVII triplet at22 (see Fig.6). Unfortunately, only the RGS1 data are available in this wavelength range due the electronic chain failure of CCD 4 in RGS2 loss. The upper limits on the intensity of two lines in the triplet could be obtained: for the lines at 21.60 and 22.10 , they are respectively 1.1610-5 and 2.0510-5 photons cm-2 s-1, but no information on the lines position can be gained. We cannot thus confirm if the shift in the wavelength peak of the OVIII line is common to other features in the RGS.
3.3 The Chandra/HETGs spectra
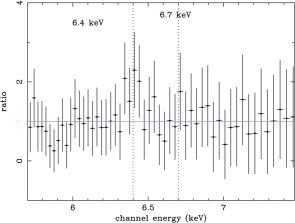
The HEG spectrum was fitted in the hard X-ray band by a power law with =1.68, consistent with the value found in the XMM-Newton data. The ratio of the data to a power law model in the 5-8 keV is plotted in Fig. 8. Only 190 counts are present in the 6-7 keV range.
We checked for the presence of the Fe K lines detected in the EPIC spectra. Adding a narrow line at 6.4 keV improves the fit by C=22 (for 3 d.o.f.). The parameters of the line are consistent with the results in Section 3.1 from the EPIC data. For the neutral line E=6.40 keV, =47 eV and EW=160 eV. The line flux is found to be 1.510-5 photons cm-2 s-1. Adding another Gaussian with unresolved width at 6.7 keV does not improve the fit very significantly (C=3, for 2 d.o.f.) in fact only the upper limit on the line intensity was found (7.810-5 photons cm-2 s-1). No line is detected at higher energies, but the upper limit on the flux and corresponding EW for a narrow line at 7.0 keV (respectively 2.510-6 photons cm-2 s-1 and 30 eV) are consistent with the results from XMM-Newton.
In the lower energy band, the MEG spectrum was searched for the presence of spectral lines, although the intense continuum would make their detection rather difficult, as already pointed out for the RGS data (section 3.2). We concentrate in particular in the range 18-20 with the intent to confirm if the 19 line is observed with the same shift as it was in the RGS. We have performed a local fit as done for RGS, employing C-statistic and fitting a zero-width Gaussian line in a narrow band around the expected emission wavelength. The line is actually present in the MEG data and it is detected with C=16.5 at a wavelength thoroughly consistent with the rest-frame position: =18.970.01 . The observed flux is 2.1010-5 photons cm-2 s-1. No other feature was found in the MEG spectrum.
The difference between the peak wavelength of the line observed in the RGS spectrum and in the MEG spectrum is not negligible (=0.060). We investigate the reasons of the discrepancy in the following.
As reported in Table 1 the XMM-Newton and Chandra observations are not exactly simultaneous, but they overlap for a total time of about 65 ks. Therefore, it was first checked if the discordancy found in the RGS and MEG data concerning the detection of the emission line at 19 , could be due to variability intrinsic to the source. The RGS spectrum was extracted from the portion of time when both satellites were operative, yielding an exposure of 58 ks. After repeating the analysis of the line using these data, no change in the line position is found, so it is very unlikely that the two measurements disagree for physical reasons related to source variability.
An error in the choice of the source coordinates may introduce a systematic error in the wavelength assigned to each photon of the source spectrum; in our case the RGS data were processed inputting the coordinates corresponding to the optical nucleus of Mrk 590 so we tend to exclude that the spectrum was shifted due to an erroneous choice of the source position occurred during the data reduction. We have checked if this same problem may have occurred in the Chandra data. In fact if the zero-order image in the Grating event list is piled up, it may lead to an incorrect wavelength scale 111See http://cxc.harvard.edu/ciao3.3/threads/tg_piled_zero/. Our observation resulted not affected by this issue. Once the goodness of the line position in Chandra is assured, it seems reasonable not to question it, simply because the line is detected at the rest wavelength, i.e. where it is expected.
The systematic errors in the wavelength scale in the RGS
are of the order of 20 m.
The difference between the laboratory and the measured wavelengths in a set of certain emission lines is generally around this value, but it may be larger for some
individual measurements 222http://xmm.vilspa.esa.es/external/
xmm_user_support/documentation/uhb/node54.html.
We conclude that the shift in the RGS is probably due to instrumental effects because of an atypical error in the wavelength occurred in this observation.
3.4 XMM-Newton: Optical Monitor data
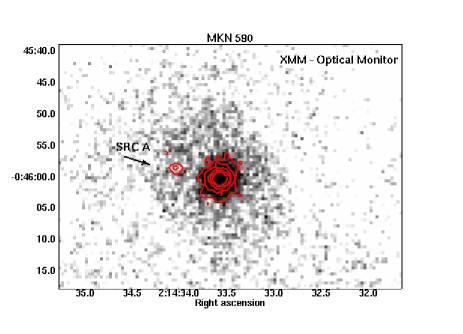
The fluxes from the Optical Monitor were obtained in five bands: B, U, UVW1, UVM2 and UVW2 ( see Table 3). These values were estimated by converting the mean count rates in each OM filter, according to the guidelines provided in the SAS documentation. They have been corrected for extinction assuming the extinction law by Cardelli et al. (1989). The images in the B and U bands could not be used in order to estimate the contribution of the galaxy in these filters because of instrumental artifacts. Nonetheless, it was possible to ascertain the presence of extended emission in these two images. We have fitted a 2-dimensional Gaussian to the brightest (point-like) sources in the field of view and to Mrk 590. This is in general a good model to fit emission from a point-like source, but it is not appropriate to model extended emission. From the comparison of the fits, it was possible to say that in the B and U filters Mrk 590 was not well fitted as the other point-like sources. This is due to the fact that the source must be more extended and therefore we can say that the contribution of the host galaxy is not negligible in B and U bands. In the UVW1 filter the image shows that the emission is concentrated in the nucleus rather than in the galaxy and in the other filters the contribution from the active nucleus is clearly predominant.
The spectral energy distribution was constructed by taking the OM fluxes and the X-ray data points in the 0.5-12 keV (Fig.9). The points in the U and B bands are marked as upper limits in order to highlight that the contribution of the host galaxy, although estimated qualitatevely, is not negligible. The fluxes measured in the optical/UV are located above the extrapolation of the X-ray power law, indicating the presence of a UV bump. It is nonetheless quite difficult to relate the shape of this component to the soft X-ray spectrum due to the Galactic absorption between the two bands. To clarify the relation between the emission in the optical/UV and X-ray band, the index defined as the slope of a power law extending between 2500 and 2 keV rest frame can be used as a good indicator of the “X-ray loudness” of an AGN. The definition =-0.3838log[F(2keV)/F(2500)] reported by Strateva and collaborators (2005) was adapted with the flux at 2310 to replace the UV flux in the ratio. This change would not affect the results because the fluxes at 2310 and 2910 differ by few% (see Table 3). The calculated in this way is found to be -0.88, slightly larger than the value found for the objects studied by Strateva et al. 2005, but still typical for Seyfert 1 galaxies.

| Filter | Flux | |
|---|---|---|
| - | () | (10-15 erg cm-2 s-1) |
| B | 4500 | 5.760.01 |
| U | 3440 | 2.970.01 |
| UVW1 | 2910 | 2.460.02 |
| UVM2 | 2310 | 2.490.07 |
| UVW2 | 2120 | 1.970.10 |
4 Discussion
4.1 The hard X-ray spectrum and the Fe K lines
The 6.4 keV Fe K line detected by both observatories in Mrk 590 appears too narrow to be produced in the inner accretion disc, otherwise its profile would be distorted and broadened by the black hole gravity. Consequently, the line producing material has to be situated in outer regions far away from the nucleus. One viable interpretation is that the line is originated via Compton reflection onto the torus-shaped material distributed at large distance from the central source according to the AGN Unification Models (Ghisellini, Haardt & Matt 1994). The reflection fraction determined in our best-fitting model and the EW of the 6.4 keV line are quite in good agreement with the predictions of George & Fabian (1991) for reflection on optically thick matter. The results from the spectral fit in section 3.1 therefore concur to suggest that the hard X-ray spectrum arises from reprocessing on the torus.
Another possible explanation for the Fe K line could be emission in the Broad Lines emitting gas. The extremely good quality of the XMM-Newton spectrum combined with the Chandra grating allowed to measure the width of the Fe K line in this source. The two measurements are in good agreement (=36 eV in EPIC and =47 eV in the HEG data), corresponding to a FWHM of 4000 km s-1 and 5250 km s-1 respectively. The FWHM of the H line in Mrk 590 is reported to be 2400 km s-1 (Stirpe 1990), implying that this source is actually much closer to the Narrow Line Sy 1 class (Boller, Brandt & Fink 1996), at least with respect to the optical lines properties. Unfortunately, this means that regardless of resolving the Fe K line width as done herein, it is somewhat difficult to ascertain if the line comes from the BLR because the width of the BLR lines in Mrk 590 is smaller than in the typical Sy1 case. The torus hypothesis, corroborated by the presence of the neutral reflection component in the spectrum, remains therefore the favoured scenario for the production of the Fe K line.
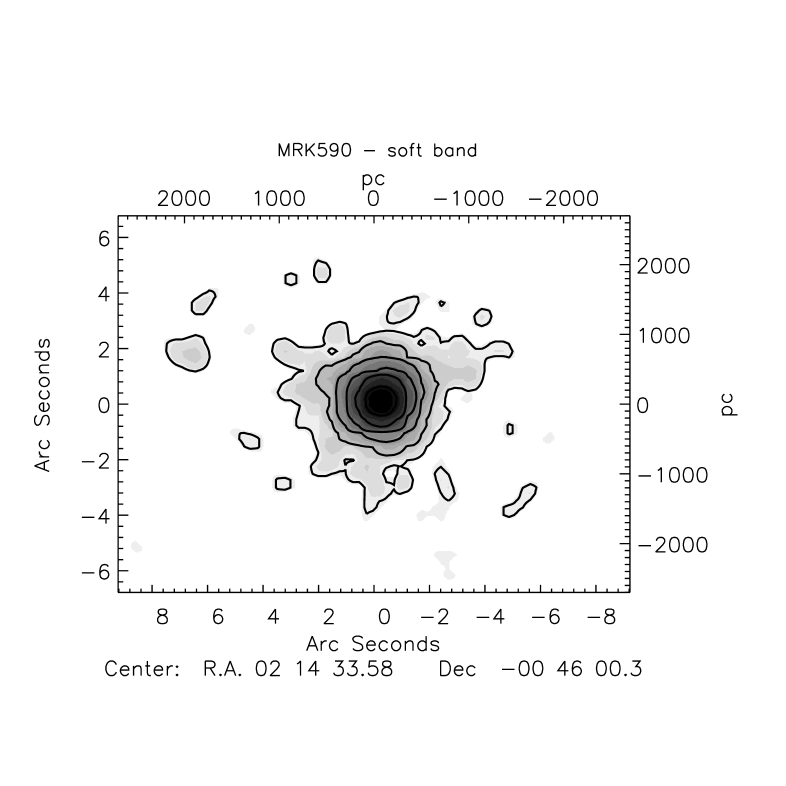
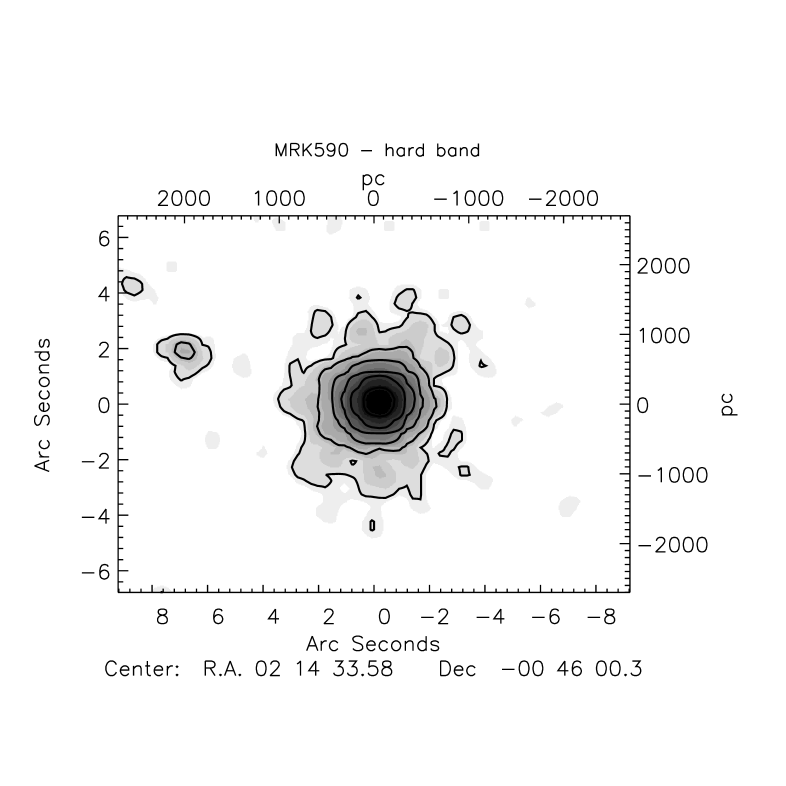
The two lines emitted at 6.7 and 7 keV are fully consistent with emission from Fe XXV (6.7 keV) and XXVI (6.96 keV), therefore from Iron in a very ionised state. A contribution of the K from neutral Fe to the Fe XXVI line cannot be ruled out by these data. The centroid energy of the line is in facts slightly higher (7.02 keV) than what would be expected for Fe XXVI only. The 7 keV line is not detected in Chandra and the addition of a K component in the EPIC best fit (Table 2) was not significant. Nevertheless, it is possible to obtain a qualitative estimate of the contribution of the K to the XXVI Fe line taking into account the flux ratio Fe K/Fe K, which has been calculated to be around 0.15 for neutral Iron (see Molendi et al. 2003). Referring to this value, we have included a fourth Gaussian line to the best fit reported in Table 2 with energy fixed to 7.06 keV and intensity fixed to 1.3410-6 photons cm-2 s-1, i.e. the energy and the estimated Fe K flux. In this way, the Fe XXVI line flux decreases to 2.4410-6 photons cm-2 s-1, corresponding to 35 eV. Ionised Iron lines with EW of tens of eV against the total continuum can be produced by fluorescence and scattering in a photoionised medium out of the line of sight, not only in Seyfert 1 objects as NGC 7213 (Bianchi et al. 2003a) and NGC 5506 (Bianchi et al.2003b), but also in many Seyfert 2 cases (Bianchi et al. 2005 and references therein). The Chandra images in Fig. 10 tentatively show that the X-ray emission may be extended on a kpc scale. The ionised lines may be be originated in this extended gas, which is not otherwise observable in the spectrum due to the intensity of the primary nuclear continuum.
The results obtained from the analysis of the hard X-ray spectrum do not provide any particular evidence for accretion disc signature, in agreement with many observations of type 1 AGNs (Bianchi et al. 2004, Matt et al. 2006).
4.2 The soft X-ray spectrum
As mentioned in section 3.1, the spectrum of Mkn 590 is not absorbed, making this source falling into the fraction of Sy1 Galaxies (50%) that do not show intrinsic absorption (Reynolds, 1997, George et al. 1998). The only relevant feature observed in the high resolution spectra is the O VIII Ly emission line. The line arises with most probability by photoionisation processes in warm gas. Netzer et al. (2005) provided photoionisation calculations of line ratios for the case of the starburst galaxy NGC 6240. Among these, the intensities of the Fe XXV and XXVI lines relative to the OVIII Ly were estimated (the line fluxes were quoted in units of ergs cm-2 s-1). Using the same units, the line ratios FeXXV/OVIII and FeXXVI/OVIII in our data are estimated around 1.6 and 1.3 (this last value is approximated because an exact estimate of the line flux is affected by the presence of the FeK). A qualitative comparison with Netzer’s results shows that it is possible to have photoionised gas producing OVIII Ly and strong Fe XXV and XXVI lines with these ratios, providing that the gas is characterised by a rather high value of the ionisation parameter, i.e. U 2 where U is defined as the photon to hydrogen density ratio in the range 0.54-10 keV. Of course, this cannot exclude a priori the more realistic picture of a multi-phase medium with various ionisation parameters. Likewise, the apparent lack of features from other transitions in the soft X-ray spectrum may indicate that the material is highly photoionised but this is a tentative conclusion since we are unsure about the detection of other lines in the RGS spectrum (e.g. the OVII triplet, section 3.2).
Most of the Seyfert 1 Galaxies with narrow emission in RGS spectra are also characterised by the presence of warm absorbers: for example the OVIII Ly emission line has been observed in NGC 3783 (Behar et al. 2003), NGC 7469 (Blustin et al. 2003) and Mrk 509 (Smith et al. 2006). Particularly, in the case of NGC3783 it was suggested to relate the X-ray absorbing gas with the OVIII line emitting plasma. Mrk 590 represents a peculiar case because of the absence of warm absorption and of the presence of X-ray emission lines from highly ionised elements at once. We can try to explain the unusual spectrum of this galaxy with simple considerations. The soft X-ray spectrum appears to be made by an intense nuclear component with a mild contribution of a photoionised medium probably in different ionisation phases revealed by the observation of highly ionised O and Fe lines. The characteristics of this medium resemble those found in Seyfert 2 objects, where the soft X-ray spectrum is due to photoionisation of circumnuclear gas (Guainazzi & Bianchi 2006). Let us assume an ionised cone geometry as for NGC 1068 (see Kinkhabwala et al. 2002). The lack of warm absorption in Mrk 590 implies that our line of sight does not intersect warm gas, or either that the gas in the line of sight is fully ionised and therefore it does not imprint absorption features. Thanks to this “clean” line of sight, we can see in this Seyfert 1 galaxy the scattering gas responsible for line emission in Seyfert 2. The observed EW of the emission lines in Mrk 590 are weaker than in Seyfert 2 because we are observing directly the active nucleus and they are diluted by the X-ray continuum. This scenario provides yet another confirmation of the Sy1/Sy2 dichotomy to be due to orientation effects.
5 Analysis of the serendipitous X-ray sources in the field of view
| Source | RA | DEC | Flux (0.3-10 keV) |
|---|---|---|---|
| - | - | - | (10-14 erg cm-2 s-1) |
| A | 02h 14m 34.0s | -00h 45m 58s | 2.88 (ACIS) |
| B | 02h 14m 34.7s | -00h 42m 43s | 26.7 (MOS-2) |
| C | 02h 14m 36.4s | -00h 42m 58s | 2.68 (MOS-2) |
Besides the main target of these two observations, we have also studied three X-ray sources detected in the field of view of the XMM-Newton and Chandra images. For clarity, they will be referred to as Source A, B, C. Table 4 lists their positions and fluxes.
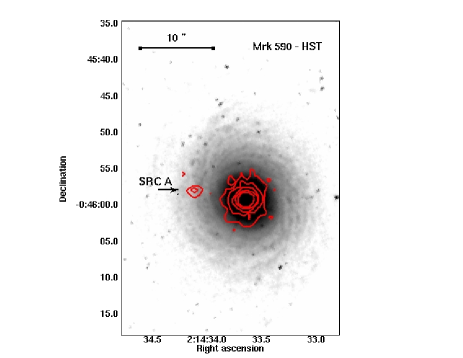
Source A is visible only in the Chandra image at 7 arcsec northwest of the nucleus, thanks to the high spatial resolution of the satellite. Figure 10 shows the contour levels of the emission in the soft X-ray band and in the hard X-ray band, where Source A seems to be stronger. The ACIS spectrum was extracted yielding 46 counts in the 0.3-10 keV. When it is fitted with a power law and Galactic absorption, the photon index is found to be =1.130.5. The observed 0.3-10 keV flux is 2.8810-14 ergs cm, corresponding to a luminosity of about 4.31040 ergs s-1 if the source is at the same redshift of Mrk590. We have searched in the OM images if any possible optical/UV counterpart is visible. There is no clear excess at the source position in none of them. From the position of the Chandra contours overlapped to the UVW1 image (Figure 11), we can deduce that Source A seems located in the host galaxy. We also have searched for archival images of Mrk 590 obtained by the Hubble Space Telescope: Figure 12 shows Mrk 590 as observed by the Wide Field Planetary Camera 2 (WFPC2) with the filter F606W applied. The observation was performed on June 24th 1995 for 500 s. Figure 12 shows the Chandra contours overlapped to the optical image and although no optical counterpart is clearly visible, the location of Source A indicates that it could be a Ultra Luminous X-ray source in the spiral arms of Mrk 590. If the identification was confirmed, Source A represents a fairly typical ULX, although it must be noted that only few ULX of those catalogued and studied so far, exceed luminosities of 3-41040 ergs s-1 (Liu & Mirabel, 2005, Miniutti et al. 2006).
Another possibility for the origin of Source A is that it could be a background AGN. Assuming that the present field is characterised by the same number of expected X-ray sources within a given area as observed by the deep XMM-Newton observation of the Lockman Hole, we can estimate the probability of Source A to be an AGN from the Lockman Hole Log N-Log S (Hasinger et al. 2001). According to the Log N-Log S, at fluxes equal or higher than 510-15 ergs cm in the 0.5-2 keV band, (corresponding to Source A flux), 200 X-ray sources per square degree are expected. Considering a circular area of radius equal to the distance of Source A from Mrk 590 (7.3 arcsec), the number of expected X-ray sources is 0.002 in an area of 1.25610-5deg2. The use of the hard X-ray flux yields a similar estimate, i.e. 0.001 for the same area. These numbers indicate that the probability for Source A to be a background AGN is small but not null and therefore the origin of this source remains open.
Source B and Source C are visible in the EPIC-pn image of the field of view but the exact positions are taken from Chandra where the sources are clearly separated. We have found two possible optical counterparts in the Digitized Sky Survey, where the two sources appear extremely faint.
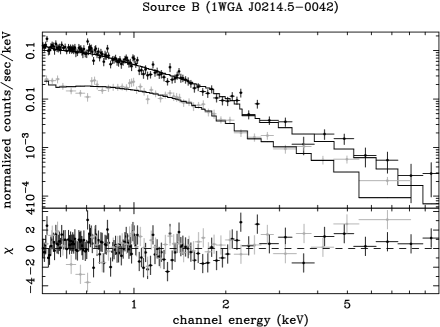
Source B was already known as 1WGA J0214.5-0042, detected by ROSAT in the soft X-rays (White, Giommi & Angelini, 2000). We have searched if the source is present in other catalogues or if other observations in different wavelengths are available, but only ROSAT has detected this source. Unfortunately, Source B falls just out of the field of view of the OM because of the orientation of the telescope, and out of the field of view of the MOS-1 because of the choice of the small window mode. Therefore, only the X-ray data from the pn and MOS-2 can reveal something on the nature of this source. The XMM-Newton spectrum is shown in Figure 13. We have fitted pn and MOS-2 together with a power law and Galactic absorption towards the direction of Source B. The resulting photon index in the range 0.5-10 keV is quite steep, =2.390.05 with /d.o.f.=415/356. The fluxes are 1.710.0510-13 ergs cm in the 0.3-2 keV and 9.5510-14 ergs cm. If the data are instead fitted with a broken power law with break energy E=2 keV, the slopes are =2.480.05 and =1.890.15.
Source C is not present in any catalogue. The spectra extracted from the pn and MOS-2 and fitted with a power law and Galactic absorption yield =2.020.23, in the 0.5-10 keV range. The observed soft X-ray flux is about 1.2310-14 ergs cm and the hard X-ray flux is 1.4710-14 ergs cm.
The lack of optical counterparts and other multiwavelength information on Source B and C make very difficult to understand the nature of these sources. It is clear from the spectral fitting and the different photon index that the two sources are distinct and not related to each other. Moreover as said above, they appear clearly separated in the Chandra image. Taking into account that in both sources the spectra are well fitted by steep power law, the most likely interpretation for both of them is in term of a background AGN.
6 Summary
The analysis of the simultaneous XMM-Newton/Chandra observation of the Seyfert 1 galaxy Mrk 590 has been presented. In the following the main results of this work are summarised:
-
•
The analysis of the X-ray data reveals a fairly typical Sy1 spectrum. The broad band continuum is well described by a power law with 1.7, a cold reflection component originating in distant matter and a blackbody with temperature kT0.1 keV.
-
•
The Iron K complex composed by 3 emission lines at 6.4, 6.7 and 7 keV has been clearly detected in the EPIC data. The width of the 6.4 line is resolved in both Chandra and XMM-Newton spectra with velocities in the range of 4-5000 km s-1. The line is interpreted as being originated via reflection onto the torus-shaped material surrounding the active nucleus, although an origin in the BLR cannot be excluded.
-
•
The two Fe lines at higher energies are consistent with being emitted by photoionisation of FeXXV and FeXXVI. The analysis of the high resolution data highlighted the presence of an OVIII Ly emission line consistent to be emitted in the same photoionised gas. The observation of highly ionised emission lines with no absorption from warm gas is interpreted as an orientation effect: the nucleus is surrounded by warm scattering clouds but it is seen along a particular line of sight with either fully ionised material or no intervening material at all.
-
•
The OM measurements of the UV fluxes are found to be above the extrapolation of the X-ray spectrum, suggesting the presence of a UV bump.
-
•
Three serendipitous sources are present in the field of view of Chandra (Source A, B, C) and XMM-newton/EPIC-pn (only source B and C). All of them are characterised by X-ray power laws and fluxes typical of AGN. With regard to Source A, the location and the estimated luminosity of the source (assuming it belongs to Mrk 590), may induce to interpret it as a ULX source, although no counterparts are observed in optical and ultraviolet data.
Acknowledgements.
This paper is based on observations obtained with XMM-Newton, an ESA science mission with instruments and contributions directly funded by ESA Member States and NASA. We would like to thank the Chandra X-ray Center and the anonymous referee for helpful comments on this publication.References
- Antonucci (1993) Antonucci R., 1993, ARA&A, 31, 473
- Behar et al. (2003) Behar, E., Rasmussen, A. P., Blustin, A. J., Sako, M., Kahn, S. M., Kaastra, J. S., Branduardi-Raymont, G., & Steenbrugge, K. C. 2003, ApJ, 598, 232
- (3) Bianchi S., Matt G., Balestra I., Perola G. C., 2003a, A&A, 407, L21
- Bianchi et al. (2003) Bianchi S., Balestra I., Matt G., Guainazzi M., Perola G. C., 2003b, A&A, 402, 141
- Bianchi et al. (2004) Bianchi S., Matt G., Balestra I., Guainazzi M., Perola G. C., 2004, A&A, 422, 65
- Bianchi et al. (2005) Bianchi S., Matt G., Nicastro F., Porquet D., Dubau J., 2005, MNRAS, 357, 599
- Blustin et al. (2003) Blustin, A. J., et al. 2003, A&A, 403, 481
- Boller, Brandt, & Fink (1996) Boller T., Brandt W. N., Fink H., 1996, A&A, 305, 53
- Cardelli, Clayton, & Mathis (1989) Cardelli J. A., Clayton G. C., Mathis J. S., 1989, ApJ, 345, 245
- Canizares et al. (2005) Canizares C. R., et al., 2005, PASP, 117, 1144
- Cash (1976) Cash W., 1976, A&A, 52, 307
- Crummy et al. (2006) Crummy J., Fabian A. C., Gallo L., Ross R. R., 2006, MNRAS, 365, 1067
- den Herder et al. (2001) den Herder J. W., et al., 2001, A&A, 365, L7
- Dickey & Lockman (1990) Dickey J. M., Lockman F. J., 1990, ARA&A, 28, 215
- (15) Fabian A. C., Iwasawa K., Reynolds C. S., Young A. J., 2000, PASP, 112, 1145
- Gabriel et al. (2004) Gabriel C., et al., 2004, ASPC, 314, 759
- George & Fabian (1991) George, I. M. & Fabian, A. C. 1991, MNRAS, 249, 352
- Gallo et al (2006) Gallo L. C., Lehmann I., Pietsch W., Boller T., Brinkmann W., Friedrich P., Grupe D., 2006, MNRAS, 365, 688
- George et al. (1998) George I. M., Turner T. J., Netzer H., Nandra K., Mushotzky R. F., Yaqoob T., 1998, ApJS, 114, 73
- Ghisellini, Haardt, & Matt (1994) Ghisellini G., Haardt F., Matt G., 1994, MNRAS, 267, 743
- Gierliński & Done (2004) Gierliński, M., & Done, C. 2004, MNRAS, 349, L7
- (22) M. Guainazzi and S. Bianchi, “On the origin of soft X-rays in obscured AGN: answers from high-resolution spectroscopy with XMM-Newton,” arXiv:astro-ph/0610715.
- Haardt & Maraschi (1993) Haardt F., Maraschi L., 1993, ApJ, 413, 507
- Hasinger et al. (2001) Hasinger, G., et al. 2001, A&A, 365, L45
- Kinkhabwala et al. (2002) Kinkhabwala, A., et al. 2002, ApJ, 575, 732
- Jiménez-Bailón et al. (2005) Jiménez-Bailón E., Piconcelli E., Guainazzi M., Schartel N., Rodríguez-Pascual P. M., Santos-Lleó M., 2005, A&A, 435, 449
- Kaastra et al. (2000) Kaastra J. S., Mewe R., Liedahl D. A., Komossa S., Brinkman A. C., 2000, A&A, 354, L83
- Kaspi et al. (2001) Kaspi S., et al., 2001, ApJ, 554, 216
- Kriss, Canizares, & Ricker (1980) Kriss G. A., Canizares C. R., Ricker G. R., 1980, ApJ, 242, 492
- Liu & Mirabel (2005) Liu Q. Z., Mirabel I. F., 2005, A&A, 429, 1125
- (31) Longinotti A. L., Cappi M., Nandra K., Dadina M., Pellegrini S., 2003, A&A, 410, 471
- Magdziarz & Zdziarski (1995) Magdziarz, P. & Zdziarski, A. A. 1995, MNRAS, 273, 837
- Malizia et al. (1999) Malizia A., Bassani L., Zhang S. N., Dean A. J., Paciesas W. S., Palumbo G. G. C., 1999, ApJ, 519, 637
- Mason et al. (2001) Mason, K. O., et al. 2001, A&A, 365, L36
- Matt et al. (2006) Matt, G., Bianchi, S., de Rosa, A., Grandi, P., & Perola, G. C. 2006, A&A, 445, 451
- Miniutti et al. (2006) Miniutti, G., Ponti, G., Dadina, M., Cappi, M., Malaguti, G., Fabian, A. C., & Gandhi, P. 2006, MNRAS, 373, L1
- Molendi, Bianchi, & Matt (2003) Molendi S., Bianchi S., Matt G., 2003, MNRAS, 343, L1
- (38) Nandra K., George I. M., Mushotzky R. F., Turner T. J., Yaqoob T., 1999, ApJ, 523, L17
- Nandra (2006) Nandra K., 2006, MNRAS, 368, L62
- Netzer et al. (2005) Netzer, H., Lemze, D., Kaspi, S., George, I. M., Turner, T. J., Lutz, D., Boller, T., & Chelouche, D. 2005, ApJ, 629, 739
- Piccinotti et al. (1982) Piccinotti G., Mushotzky R. F., Boldt E. A., Holt S. S., Marshall F. E., Serlemitsos P. J., Shafer R. A., 1982, ApJ, 253, 485
- Piconcelli et al. (2005) Piconcelli E., Jimenez-Bailón E., Guainazzi M., Schartel N., Rodríguez-Pascual P. M., Santos-Lleó M., 2005, A&A, 432, 15
- (43) Ponti G., Cappi M., Dadina M., Malaguti G., 2004, A&A, 417, 451
- Reynolds (1997) Reynolds C. S., 1997, MNRAS, 286, 513
- Ross & Fabian (2005) Ross R. R., Fabian A. C., 2005, MNRAS, 358, 211
- (46) R. A. N. Smith, M. J. Page and G. Branduardi-Raymont, “The XMM-Newton RGS spectrum of the high luminosity Seyfert 1 galaxy Markarian 509,” arXiv:astro-ph/0609746.
- Stirpe (1990) Stirpe G. M., 1990, A&AS, 85, 1049
- Strateva et al. (2005) Strateva I. V., Brandt W. N., Schneider D. P., Vanden Berk D. G., Vignali C., 2005, AJ, 130, 387
- Strüder et al. (2001) Strüder L., et al., 2001, A&A, 365, L18
- Turner & Pounds (1989) Turner T. J., Pounds K. A., 1989, MNRAS, 240, 833
- Turner et al. (2002) Turner T. J., et al., 2002, ApJ, 574, L123
- Yaqoob & Padmanabhan (2004) Yaqoob T., Padmanabhan U., 2004, ApJ, 604, 63
- White, Giommi, & Angelini (2000) White N. E., Giommi P., Angelini L., 2000, yCat, 9031, 0