Hidden activity in high-redshift spheroidal galaxies from mid-infrared and X-ray observations in the GOODS-North field
Abstract
We exploit very deep mid-IR (MIR) and X-ray observations by and in the GOODS North field to identify signs of hidden (either starburst or AGN) activity in spheroidal galaxies between and 1. Our reference is a complete sample of 168 morphologically classified spheroidal (elliptical/lenticular) galaxies with selected from GOODS ACS imaging. Nineteen of these have 24-m detections in the GOODS catalogue, half of which have an X-ray counterpart in the 2 Ms catalogue (6 detected in the 2-10 keV X-rays hard band), while about 25% have 1.4 GHz fluxes larger than 40 Jy. Traces of hidden activity in the spheroidal population are also searched for in the deep X-ray images and 14 additional galaxies are detected in X-rays only. The nature of the observed MIR emissions is investigated by modelling their Spectral Energy Distributions (SEDs) based on the available multi-wavelength photometry, including X-ray, UV, optical, near-IR, MIR and radio fluxes, and optical spectroscopy. The amount of dust derived from the IR emission observed by appears in excess of that expected by mass loss from evolved stars.
When the available independent diagnostics are compared, in general they provide consistent classifications about the nature of the activity in our spheroidal population. Given that, in principle, none of these diagnostics alone can be considered as conclusive, only trough a panchromatic comparison of them we can reach an accurate comprehension of the underlying physical processes. In particular, our multi-wavelength analysis of the X-ray and MIR properties leads us to conclude that at least 8 of the 19 24-m bright sources should hide an obscured AGN, while the X-ray undetected sources are more likely dominated by star formation. We conclude that 30 objects (20%) of the original flux-limited sample of 168 spheroidal galaxies in the GOODS-North are detected during phases of prominent activity, of both stellar and quasar origin. Due to the short expected lifetimes of the IR and X-ray emissions, this fraction might imply a significant level of activity in this class of galaxies during the relatively recent cosmic epochs – to – under investigation.
keywords:
galaxies: active – galaxies: elliptical and lenticular – galaxies: high-redshift – infrared: galaxies.1 Introduction
The origin of spheroidal (elliptical and lenticular) galaxies has been, and still partly remains, a controversial issue. Published results from high redshift galaxy surveys appear not unfrequently in disagreement with each other. One example is the apparent conflict between reports of the detection of massive elliptical galaxies at very high redshifts (e.g. Glazebrook et al. 2004; Cimatti et al. 2004; McCarthy et al. 2004; Daddi et al. 2005; Saracco et al. 2005) and the indications for a decline in their comoving number densities at (e.g. Franceschini et al. 1998; Fontana et al. 2004; Faber et al. 2005).
Some recent progress in this field has been achieved in particular by the combined use of the IR multi-wavelength coverage offered by the Spitzer Space Telescope, the unique imaging capabilities of HST/ACS, and the enormous photon-collecting power of spectrographs on large ground-based telescopes. This wealth of data significantly refined our knowledge of the build up of galaxy populations and revealed evidence of ”downsizing” in galaxy formation, i.e. star formation ending first in massive galaxies than in lower mass ones, as observed both at low and high redshift (Cowie et al. 1996; Tanaka et al. 2005; van der Wel et al. 2005; Treu et al. 2005; Juneau et al. 2005; Bundy et al. 2006; Borch et al. 2006; Jimenez et al. 2006).
In particular, Treu et al. (2005) studied the evolution of the fundamental plane as a diagnostic for star formation and mass assembly history of early-type galaxies. They suggested that most of the stellar mass in spheroidal galaxies formed at , with subsequent activity continuing to lower redshifts (). The fraction of stellar mass formed at recent times depends strongly on galactic mass, ranging from % for masses above to 20%- 40% below .
Various approaches have been followed in order to detect recent or ongoing activity in spheroidal galaxies to . One approach was to look for close companions or morphological disturbances, and how they evolve as a function of redshift (Le Fevre et al. 2000; Patton et al. 2002; Khochfar & Burkert 2003; Lin et al. 2004; Cassata et al. 2005), under the assumption that the physical mechanism triggering the activity and responsible for the progressive build-up of galaxies are interactions and merging. Another way of attacking the problem was to consider optical colour information and look for blue ellipticals to find the presence of young stellar populations, hence recent star-formation, e.g. triggered by merging (Hogg et al. 2003; Bell et al. 2005; Cassata et al. 2006). As an example, Treu et al. (2005) provided independent support for recent activity in spheroidals up to through spectroscopic ([O II] emission, H) and photometric (blue cores and broadband colors) diagnostics.
An important related question is how the observed galaxy build-up matches with evidences about the growth of nuclear super-massive black-holes (BHs) during the quasar and AGN phase. A close relationship of the two is suggested by the observed correlations of the BH mass with the host galaxy mass and central velocity dispersion in the local universe (Ferrarese & Merritt 2000) and by the concomitant presence of star-formation and AGN activity sometimes directly observed in forming galaxies (Alexander et al. 2005). Many have suggested that AGN may be the cause or at least related to the quenching of galaxies (see Silk & Rees 1998, Croton et al. 2005, Hopkins et al. 2006, among others).
We follow in this paper an alternative line of investigation on high- () spheroidal galaxies by looking for signs of optically hidden activity in their mid-infrared (MIR) and hard X-ray emissions (Rigby et al. 2004, Georgantopoulos et al. 2006). Ongoing star-formation and young massive stars in local galaxies appear mostly embedded in dusty, optically thick molecular clouds. Related to this, the Infrared Space Observatory (ISO) has shown the presence of Polycyclic Aromatic Hydrocarbon molecules (PAHs) in the spectra of some local early-type galaxies (i.e. Madden et al. 1999; Xilouris et al. 2004). These results have been recently confirmed by observations with the Spitzer Space Telescope (Pahre et al. 2004, Bressan et al. 2006). However, the origin of the dust responsible for the MIR emission in early-type galaxies could be attributed either to merging events (Xilouris et al. 2004), cooling flows (Fabian et al. 1991) or to mass loss from late-type stars (Knapp et al. 1992).
In addition, a significant (even major) fraction of AGN accretion is also expected to be optically obscured and to emerge in the MIR. Then an effective way of identifying hidden star-formation and/or AGN activity in high-redshift spheroidal galaxies is to exploit deep mid- and far-IR photometry with Spitzer MIPS on sky areas where morphological classification is possible from deep HST/ACS high-resolution imaging.
Hard X-ray observations, in turn, provide an even more straightforward way to identify obscured AGNs, since hard X-rays are typically produced in copious amounts by them, and are able to penetrate the dust absorbing the optical, UV and soft X-ray light emitted by the nucleus. In addition, when the sensitivity of the X-ray data is high enough, they bear potential independent information on deeply embedded young stellar populations (Ranalli et al. 2003; Franceschini et al. 2003). Therefore, deep hard X-ray data combined with MIR information can provide extraordinary tools for unveiling hidden AGNs and starbursts in morphologically classified spheroidal galaxies and to constrain the nature of these emissions.
Many recent papers have studied the presence of AGN in high- early-types (e.g. Georgakakis et al. 2006, Grogin et al. 2005, and Brand et al. 2005). Similar works at lower redshift are based on the Sloan Digital Sky Survey (SDSS, Stoughton et al. 2002) that study AGNs in high-mass early-type galaxies (Miller et al. 2003, Kauffmann et al. 2004). More recently, Capetti and Balmaverde (2005, 2006 among the others) explored the connection between the multiwavelength properties of AGNs in nearby early-type galaxies and the characteristics of their hosts. Also Treu et al. (2005) found that 5% of their E+S0 galaxies are identified as AGNs, based on an X-ray luminosity above erg/s. An additional 10% of the spheroidal sample is also detected with X-ray luminosities between and erg/s, which are interpreted as mostly due to a low-luminosity AGN or to ongoing star formation.
In this context, the GOODS-North (GOODS-N), with its deepest available MIR (from ) and deeper hard X-ray (from ) data, offers a unique opportunity of investigating activity phenomena in spheroidal galaxies.
We focus in this paper on the specific comparison between the Chandra X-ray view and the Spitzer 24 m view of AGN and star-formation activity (Rowan-Robinson et al. 2005, Franceschini et al. 2005), investigating in particular if the Chandra and Spitzer indicators agree and correlate with one another when they are combined.
Based on a flux-limited optical galaxy sample () by Bundy et al.(2005), including 168 morphologically classified elliptical/lenticular (E/S0) galaxies in the GOODS-N, we have identified those with a MIR counterpart in the MIPS 24 m GOODS catalogue (). We have also cross-correlated the optically-selected sample with the 2 Msec X–ray image of reported by Alexander et al. (2003). For these galaxies we have built a multi-wavelength photometric catalogue including IRAC data at 3.6, 4.5, 5.8 and 8 m (from the public GOODS release), Subaru and HST and data (Capak et al. 2004), and radio VLA 1.4GHz data (Richards et al. 2000). Spectroscopic redshifts are available for all the sources of our sample. The galaxies are found at 0.1 1.2, with a median redshift . About half of the spheroidal galaxies with MIR emission present an X-ray counterpart and one-fourth have radio detection.
We note here that half of our sample overlaps the spectroscopic sample discussed by Treu et al. (2005).
The present paper is structured as follows. Section 2 describes the multi-wavelength data-set and Section 3 our galaxy sample selection. In Section 4 we give details about our data analysis, by exploiting in particular the SEDs of our galaxies, the information from multi-colours and broad-band flux ratios. Section 5 discusses and critically analyses these results, while Section 6 summarizes our conclusions.
We adopt a cosmological model with =0.3, =0.7, and .
2 THE DATA
With the aim of studying the multiwavelength photometry of extragalactic sources measured by different instruments, we need to measure the bulk of the emission from each object in each photometric band. Only with such kind of approach an SED can be considered reliable. In our work, we performed aperture photometry in most bands, and decided to bring the measurements as close to the total magnitudes as possible (see also Yan et al. 2005).

2.1 Optical Imaging
The GOODS project (Dickinson et al. 2003) has surveyed with ACS/HST two separate fields, the Deep Field South (CDFS) and the Hubble Deep Field North (HDFN) with four broad-band filters: F435W (B), F606W(V), F775W(i), and F850LP(z). The analysis presented here is based on the version 1.0 of the reduced, stacked and mosaiced images for all the data acquired over the five epochs of observation (Giavalisco et al. 2004).
Source extraction and photometric measurements in the B, V, and bands have been performed by running a modified version of SExtractor (Bertin & Arnouts, 1996). We have considered the total magnitudes (as from the BESTMAG output parameter in SExtractor, see Giavalisco et al. 2004).
Moreover, optical and near-IR ground-based photometric imaging in several bands for the GOODS-North field was taken from Capak et al. (2004). The -band data were collected using the Kitt Peak National Observatory (KPNO) 4m telescope with the MOSAIC prime focus camera. The -, -, -, -, and -band data were collected using the Subaru 8.2 m telescope and Suprime-Cam instrument (Miyazaki et al. 2002). The HK’ data were collected using the QUIRC camera on the University of Hawaii 2.2 m telescope (Hodapp et al. 1996). Details on the data reduction and photometric analysis are reported in Capak et al. (2004). A 3” diameter aperture was used for the photometry. We applied the corresponding aperture corrections reported by Capak et al. in all bands.
2.2 Morphological Analysis
Our basic selection is a sample of morphologically classified elliptical galaxies in the GOODS-N based on the imaging data. We used the publicly available catalogue of Bundy et al. (2005)111available at http://www.astro.caltech.edu/GOODS_morphs, which was constructed with a magnitude limit of over an area of 160 . The morphological selection is based on the visual inspection of ACS version 1.0 data. Our sample selection is based on a catalogue of 168 bona-fide E/S0s (classes 0 and 1 in Bundy’s catalogue) out of a total sample of 1576 galaxies brighter than this magnitude limit.
2.3 Deep Imaging in the Near- and Mid-IR
As part of the GOODS project, the Space Telescope has surveyed the GOODS-N field in the IR between 3.6 and 8.0 m using IRAC and in the range 24-160 m with MIPS. In this paper we have made use of the public reduced data released by the GOODS team and available on the Web222http://data.spitzer.caltech.edu/popular/goods.
For the IRAC data, we have adopted the official GOODS reduced images (epoch 1 + 2) and performed our own photometry. The IRAC source identification has been performed with SExtractor independently in the four maps at 3.6, 4.5, 5.8 and 8.0 m.
In order to obtain the most accurate Spectral Energy Distributions (SEDs), we have computed the fluxes of each source by performing aperture photometry in the four IRAC bands at the positions originally detected in the ACS -band. Assuming that essentially all the sample sources are seen as point-like by the IRAC FWHM PSF imager, we computed with SExtractor (Bertin & Arnouts, 1996) the fluxes within a 3.8 arcsec diameter aperture. This choice is supported by an accurate analysis performed by the SWIRE team333http://data.spitzer.caltech.edu/popular/swire/20050603_enhanced_v1/. They constructed color-magnitude diagrams for various types of objects, in particular main-sequence stars. It was then found that the scatter in these diagrams is minimized through the use of an aperture of 3.8 diameter aperture, and corresponds to roughly twice the beam-width. To obtain total fluxes, we then applied the correction factors indicated by the SWIRE team444See Note 2. We have independently verified that the IRAC/SWIRE aperture corrections are consistent with those derived by fitting the radial brightness profiles of few stars in the GOODS fields (bright stars where selected on the basis of their visual morphology in the ACS bands). For the only one source spatially resolved (# 15), we used Kron like magnitudes (AUTOMAG output parameter in SExtractor). For three blended IRAC sources present in our sample, we applied a deconvolution procedure, as described in Section 3.1.
The public MIPS data-set includes calibrated maps and a catalogue of 24 m sources with flux densities Jy. The public photometry is based on a PSF fitting algorithm, where the SExtractor positions of the IRAC sources are used as input to the MIPS source extraction process. The MIPS 24 m PSF was generated from isolated sources in the image, and re-normalized based on the aperture corrections published in the MIPS Data Handbook (v2.1, section 3.7.5, table 3.12).
IRS Peak-Up imaging data at 16 m are also available from Teplitz et al. (2005) over an area of 35 square arcminutes in the GOODS-N to an average 3 sigma depth of 0.075 mJy, for a total 149 detected sources. Three of these are in common with our spheroidal galaxy sample. The 16 m photometric band provides unique information on the shape of the observed SEDs. In fact, the combination of the complete Spitzer filters set represents a powerful tool to sample the evolution of the PAH features. For example, the 7.7 m PAH feature can be traced from the local universe, where it lies in the IRAC channel 4 passband, to , where it falls in the 16 m IRS Peak-Up filter, up to redshifts near , where it enters the 24 m MIPS filter (Teplitz et al. 2005).
2.4 X-ray data
Very deep X–ray observations (2 Megaseconds in total) of the Deep Field North (CDFN) have been reported by Alexander et al. (2003). We used them to search for nuclear activity in spheroidal galaxies of the GOODS-North field in addition to those obtained from the IR emissions. The X–ray data have been retrieved from the public archive and processed with standard tools making use of the calibrations associated with the CIAO555http://cxc.harvard.edu/ciao/ software (version 3.2.1). Each of the 20 pointings of the dataset has been registered on a reference pointing (OBSID 3293) and aligned using the align_evt666http://cxc.harvard.edu/cal/ASPECT/align_evt/ tool. The charge transfer inefficiency and gain corrections were also applied to each single pointing. X–ray images were accumulated in the soft (0.5–2.0 keV), hard (2–8 keV) and full (0.5–8 keV) bands.
X–ray counts in the three bands were extracted within a circular region whose radius is a function of the off–axis angle (typically of the order of 2–3 arcsec). The background was estimated locally for each source as the average of counts in several source–free surrounding regions. The number of counts and the X-ray fluxes are fully consistent with the values published in Alexander et al. (2003), and are reported in Table 3.
2.5 Optical spectroscopy
In the last few years various observational programs have undertaken a systematic spectroscopic follow-up in the GOODS-N. In particular, the Keck team (Wirth et al. 2004) reported the results of an extensive imaging and spectroscopic survey in the GOODS-North field with DEIMOS on the Keck-II telescope. Observations of 2018 targets from a magnitude-limited sample of 2911 objects to = 24.4 yielded secure redshifts for a sample of 1440 galaxies and AGNs, plus 96 stars. All the Keck spectra are publicly available777http://www2.keck.hawaii.edu/science/tksurvey. All our objects have a redshift from the Wirth et al. (2004) catalogue. However, we did not found the corresponding spectrum in the Keck archive for 10 sources in our sample (IDs 3, 4, 9, 10, 15, 16 and IDs 3x, 4x, 8x and 10x as in Table 3). We then recovered four of the missing spectra (IDs 4, 9, 10 and 16) from the sample of Treu et al. (2005). All sources have a z-quality value of 4 (99% confidence level) or 3 (90% confidence level), as in the code assigned by Keck team.
3 SAMPLE SELECTION
3.1 Spheroids with mid-IR excess emission
As a first step, we cross-correlated the optical catalogue including the 168 morphologically selected spheroids (see Section 2.2), with the bright 24 m catalogue provided by the GOODS team (Jy, Section 2.3). For 21 of the 168 spheroids we found a MIR counterpart within a distance of 2” from the optical position. We checked the morphology of each of the 21 candidates taken from the Bundy et al. (2005) catalogue on the -band ACS image. We then excluded two objects (#14 and #18) from the sample because they look like late-type galaxies rather than E/S0 to our visual inspection (however, we have verified that the inclusion of these two sources does not change the main conclusions of this work).
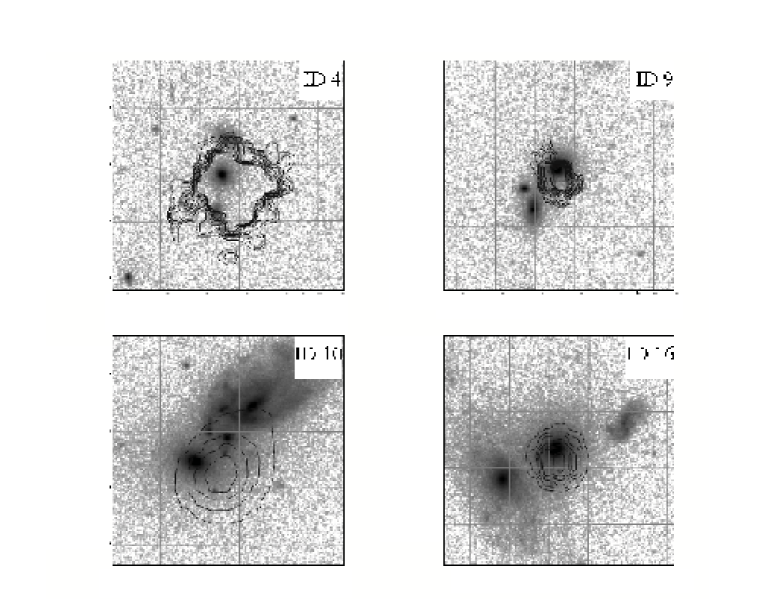
Source confusion is a potential problem for the optical identification of the 19 MIR sources in the final sample: the very different angular resolution of the and HST instruments enhances the probability of finding more than one ACS source falling within a MIPS beam. However, for the majority of our sources the optical to NIR and MIR identifications turned out to be straightforward. Only six of the optically-selected galaxies present extended IRAC or MIPS emissions and confusion problems. For three of them (#9, #10 and #16) we could use the spatial information available in the HK’-band image to deconvolve the 3.6-8.0 m fluxes (for details on this procedure see Franceschini et al. 2006). Using the HK’ positions for reference, we applied a PSF-fitting algorithm based on IDL procedure written ad-hoc to deblend also the 24 m emission.
The confusion issue for the three remaining objects (ID #0, #4 and #11) cannot be resolved by just looking at the HK’ image. We will consider these 3 sources separately, and their MIR fluxes as upper limits of the spheroidal galaxy emission, while the final catalogue of robust unambiguous associations includes 16 E/S0s with 24 m emission above Jy.
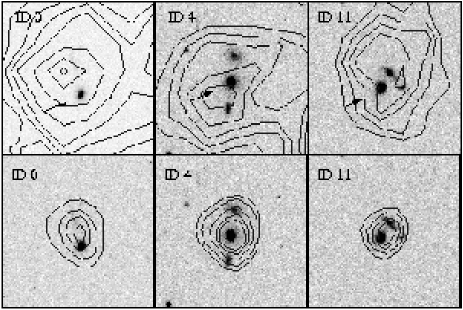
Figure 1 (upper panel) shows optical postage stamps of the 16 reliable spheroids in our final sample. For each source a cutout of the four ACS images (B, V, i’ and z’ bands) is presented. The identification numbers are those appearing in Table 3 (see also §3.3). Postage stamps of the three blended sources are reported in Figure 2, where the optical ACS i’ band images are overlaid on the MIPS 24 m contours. For the 16 isolated spheroids, the association of the 24 m and the optical/near-IR source is unambiguous.
For what concerns the sources affected by confusion problems, the X-ray counterparts, where available, (see Figure 3 below) support the hypothesis that the spheroidal object is strictly correlated with the stronger IR emitter, under the assumption that the two emissions are related.
3.2 Spheroids with X-ray emission
More than half (12/19) of our Spitzer–MIPS sources have a unique X–ray counterpart within a search radius of 2 arcsec. Four of the 12 X–ray sources are associated with the objects showing confusion problems at 24 m (see 3.1). By exploiting the arcsec X–ray image quality, the soft X–ray contours of the 4 sources were overlaid on the HST/ACS images (Figure 3). The X–ray/HST association is obvious for 3 of them where the X–ray emission is centered on the spheroidal component. The closest counterpart of source 10 is also a spheroidal galaxy, although the correct association is not so clear.
For six out of the seven MIR spheroidal galaxies undetected in both soft and hard X–ray bands, upper limits were computed by X–ray counts in circular regions (2 arcsec of radius) of the CDFN map centered and reported in Table 3. The optical position of source 19 was too close to a bright X–ray source to obtain a reliable estimate of the X–ray upper limit.
In addition, we found 14 associations of Chandra X-ray sources among the 147 -band selected spheroidal galaxies in the GOODS-North area without detectable MIR emission. The optical z-band images for all of them are reported in Figure 1 (lower panel). All appear to display standard elliptical morphologies. Photometric and other data for this sub-sample are reported in the third panel of Table 3. The majority of these sources (8 out of 14) are detected in hard band (2-8 keV).
To summarize, these 14 additional X-ray luminous objects bring our total sample of spheroidal galaxies in the 160 sq. arcmin GOODS-North field with signs of activity (either from MIR or X-ray data) to a total of 33 out of 168 objects in the original optical sample (corresponding to a fraction of 20%).
3.3 Summary of the multiwavelength photometry for spheroids in the GOODS-N
We have built a multi-wavelength photometric catalogue for our sample of spheroidal galaxies with MIR or X-ray emissions in the following way. Starting from the optical -band positions, we used a search radius of 1” in each bands to look for the cross-identifications in the corresponding catalogues. As mentioned in Section 3.1, direct visual inspection of the ACS images guarantees the reliability of the final counterparts.
The photometry for each source is presented in Table 3. We adopt a common value of 10% (15%) of the measured fluxes as photometric errors for the IRAC (MIPS) bands, in order to reflect the systematic uncertainties of the instruments The main contributions to these uncertainties are due to the colour-dependence in the flat field and to the absolute calibration (see for example Lacy et al., 2005, and the IRAC and MIPS Data Handbook).
For what concerns the optical photometry, in the SED fitting analysis we adopted for each source the , , , , and band from the Capak et al. (2004) paper (Section 2.1). We used the ACS photometry only when this information is missing (see Table 3).
All the 19 sources in the final catalogue of spheroids with Jy and the 14 additional X-ray detections only are found within the spectroscopic Keck catalogue (Section 2.5), and spectroscopic redshifts are also reported in Table 3. Table 3 is splitted in three sections, one referring to the catalogue of 16 MIPS 24m sources with unambiguous optical identifications, the second to the 3 blended MIR sources, and the last one to the 14 spheroidal galaxies with X-ray detection only. For the potentially confused sources, (IRAC+MIPS) fluxes have to be considered as upper limits only.
4 DATA ANALYSIS
In this Section we exploit the previously discussed multi-wavelength data to test the origin of the observed emissions and verify if these may be ascribed to the standard passively evolving stellar populations, or instead require star-formation or AGN activities to take place in them.
To this end, we use the optical-IR Spectral Energy Distributions (SEDs) to check for the presence of hot dust emissions by a nuclear power-source (AGN) or emission by warm dust in star-forming regions. We will also look for the presence of emission lines the optical spectra and check for the ionization level and line width to discriminate AGN activity.
Then optical to IR colours, X-ray to optical and X-ray to IR flux ratios are used as diagnostics of the emission processes. In a few cases the very deep X-ray data will provide unique diagnostic information.
4.1 Analysis of the Spectral Energy Distributions for the IR-emitting Spheroids
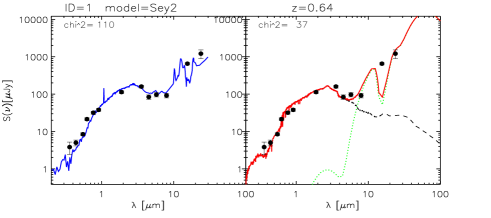
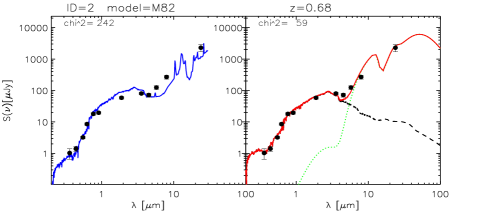
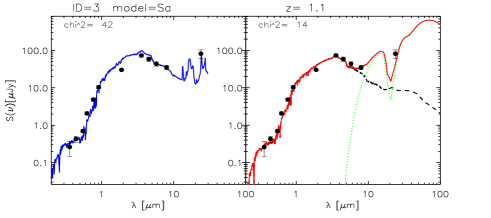
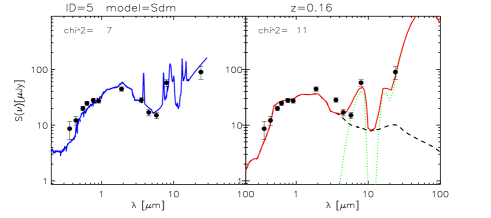
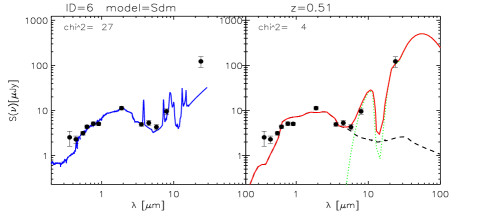
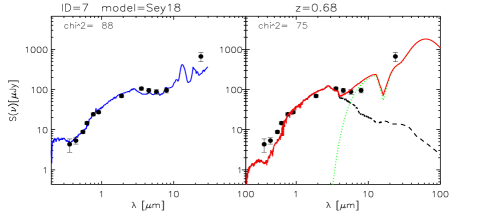
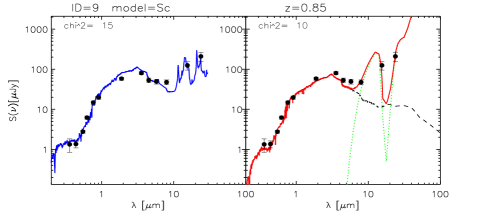
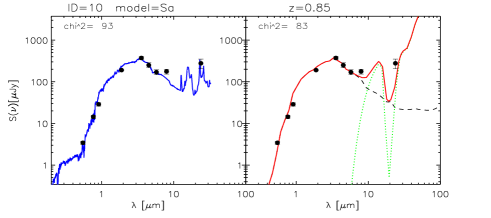
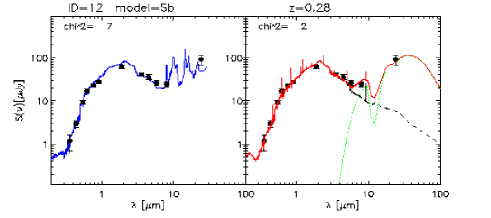
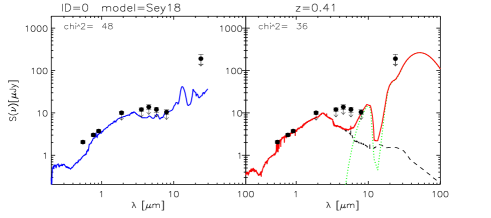
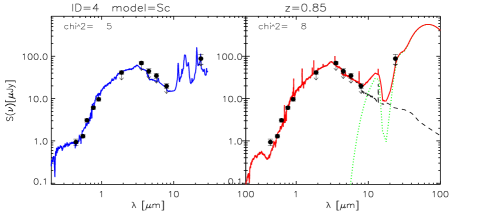
In order to understand the nature of dust emission by the IR-emitting objects, we have assembled in Figures 4 and 5 the SEDs from UV to MIR for all of them. We have first attempted to interpret these observational SEDs of our spheroids galaxies using an automated fitting routine contained in the ”Le Phare” code (available at http://www.lam.oamp.fr/arnouts/LEPHARE.html).
Le PHARE (PHotometric Analysis for Redshift Estimations, Ilbert et al. 2006) is a publicly available set of FORTRAN programs aiming at computing photometric redshifts through the best-fitting SED analysis. Le PHARE’s structure is based on two parts:
A preparation phase, composed of different programs in order to select theoretical SEDs, filters and build theoretical magnitudes. The different programs have been developed in order to easily get basic information relative to the filters (, AB-corrections …) and the SEDs (k-correction versus , color-color diagrams for stars, quasars and galaxies …).
A running phase, based on the photometric redshift program itself. The program is based on a simple fitting method between the theoretical magnitudes and an observed photometric catalogue.
For our galaxies we already know the spectroscopic redshift, so we have fixed and have used Le PHARE only to obtain the best-fitting SED through a comparison with 21 templates of galaxies (including Ellipticals of different ages, lenticulars, Spirals and Starbursts) and AGNs (including low- and high-ionization QSOs, reddened QSO, Seyfert 1, 1.8 and 2 and two kinds of ULIRGs) provided by M. Polletta et al. (in preparation).
Since the SED-fitting is based on the method, the most relevant photometric points are obviously those with smaller photometric errors (i.e. typically the optical/NIR ones).
From this first exploratory SED fitting we have inferred a rough spectral classification, and have looked for evidences of a MIR excess in the observed 24 m fluxes compared with the best-fitting model spectra.
 |
 |
 |
 |
 |
 |
 |
 |
 |
 |
![[Uncaptioned image]](/html/astro-ph/0701178/assets/x14.png) |
![[Uncaptioned image]](/html/astro-ph/0701178/assets/x15.png) |
![[Uncaptioned image]](/html/astro-ph/0701178/assets/x16.png) |
![[Uncaptioned image]](/html/astro-ph/0701178/assets/x17.png) |
![[Uncaptioned image]](/html/astro-ph/0701178/assets/x18.png) |
![[Uncaptioned image]](/html/astro-ph/0701178/assets/x19.png) |
Figure 4 (continued)
 |
 |
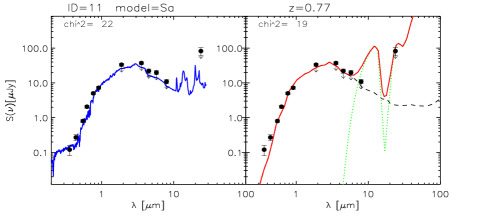 |
The left panels in Figures 4 and 5 provide a comparison of our model fits based on local templates with the observational SEDs for the spheroidal sample galaxies. For each source we report in the plot a reference indicating the nature of the best-fit model derived by the Le Phare code and the reduced corresponding to that solution. The large values of the statistics are mainly caused by the inability of the adopted SED templates to reproduce the observed 24 m emission (but also the 5-8 m fluxes of various sources). We note that the primary solution of this photometric analysis is quite robust, within the uncertainties. In fact, only for a couple of sources the secondary solutions derived by Le Phare are acceptable (in terms of minimization of the ) and imply a different spectral type (from an SED dominated by star formation in favour of and SED dominated by an AGN, or viceversally). However, the main implication of this analysis is that none of our sample spheroidal objects is reproduced by a typical old and passive stellar population. On the contrary, only late-type star-forming spirals or Seyfert galaxies seem to better match the observed SEDs. This already implies that our selection naturally favours the detection of a peculiar class of ellipticals (see discussion below).
We see that in many cases (6 out of 19) the observed 24 m fluxes show a significant excess compared with the expectations based on the local spectral templates matched to the optical-NIR data. We discuss here possible interpretations of such MIR emission. Three different hypotheses are considered: 1) mass loss from late-type stars (Knapp et al. 1992), 2) IR emission by warm dust and PAH molecules related with star-forming regions (Madden et al. 1999; Xilouris et al. 2004), 3) dust emission by circum-nuclear torii heated by an AGN (Knapp et al. 1999).
The first interpretation follows from the study by Knapp et al. (1992) of a sample of nearby elliptical galaxies detected in the MIR (12 m) by the IRAS surveys. The authors, after considering several possible origins for the 12 m emission, conclude that for almost all the normal non-AGN ellipticals the MIR emission is likely due to photospheric and circumstellar emission by evolved red giants stars in the galaxies. The MIR (12 m) and NIR (2.2 m) fluxes of the nearby ellipticals are compared by Knapp et al. (1992) to those of evolved red giants, showing the existence of a large population of mass loosing stars. MIR and NIR fluxes are then used by them to derive rates of stellar mass loss.
To test the hypothesis that the MIR emission from early-type galaxies in our sample has the same origin of the nearby ellipticals, we have compared the NIR and MIR properties of the two samples. Since our galaxies are at a median redshift , from our observed 3.6 and 24 m fluxes we have computed rest-frame luminosities at 2.2 and 12 m with suitable K-corrections (that turned out to be rather insensitive to the adopted template spectrum), and then compared them in Figure 6 with intrinsic 12 and 2.2 m luminosities of local objects.
The values of the MIR to NIR luminosity ratios for our early-type galaxies (open stars) turn out to be about a factor of ten higher on average than for the Knapp et al. nearby ellipticals (filled circles). This would imply a fraction of 12 m luminosity produced by mass loss (and the relative mass loss rate) in our galaxies far too high if compared with the values found for local galaxies with MIR excess. We conclude that, if some contribution to the observed MIR emission by mass loss from evolved giant stars is present in our spheroidal galaxies, it is certainly not the dominant energy source at these wavelengths.
The presence of diffuse dust emission, responsible for the observed MIR excess in the spectra of early-type galaxies, has been considered by several authors (i.e. Madden et al. 1999; Xilouris et al. 2004). To test this hypothesis for our galaxies, we have considered the results of the automatic SED fitting described in the previous section and shown in the left panels of Figs. 4 and 5. In 8 galaxies out of 19, the optical-to-MIR SEDs can easily be fitted with normal galaxy templates and residual star-formation. In at least 6 further cases there is instead evidence that the rest-frame MIR emission is significantly in excess of any reasonable level that might be explained by diffuse dust in star-forming regions.
Our third considered hypothesis is therefore that the MIR excess observed in the GOODS-N early-type galaxies is contributed by the presence of AGN circum-nuclear dust re-radiation. This interpretation is suggested by the shapes of the observed IR SEDs, which exclude the alternative possibility of direct non-thermal quasar unobscured emission.
We have then tried to fit the observational data with a combination of two different spectral components: an evolved stellar population to reproduce the optical and NIR spectrum, plus an obscured AGN emission component to explain the MIR data. The synthetic SEDs of the old component, including a mix of passively evolving stellar populations and younger stars, have been modelled with a population-synthesis code reported by Berta et al. (2004), based on the Padova stellar isochrones. The synthetic spectra are taken from a set of templates used in Fritz et al. (2006, submitted). We found that sources ID5 and ID6 are reproduced with a typical evolved old stellar population of 1 Gyrs, while ID 10 and ID 5 with an older population of 4 Gyrs. Other six sources (IDs 0, 1, 3, 8, 9 and 17) are better represented by a galaxy during a post-starburst phase with a second main episode of star formation –forming of the total stellar mass– in the range years. The remaining objects (IDs 2, 4, 7, 12, 13, 15, 16, 19 and 20) are instead fitted with a main–impulsive burst and a continuous star formation which is truncated at years. The best-fit solutions for the stellar component are also used to provide a measure of the barionic mass of each source (a Salpeter IMF in the range 0.15-120 has been considered). The stellar masses are reported in the last column of Table 1, with a median value of .
The AGN IR component is modelled as the emission by a dusty torus heated by a central AGN, as detailed below. The right-hand panels in Figs. 4 and 5 illustrate the two component (old population dusty torus) solutions.

Our adopted torus model has been discussed in Fritz et al. (2005), to which we refer for a more detailed explanation.
The model reproduces the AGN spectrum as a combination of a nuclear non-thermal spectrum plus a dusty torus emission. A flared disc geometry, i.e. two concentric spheres with the polar cones removed, is adopted for the latter. The torus size is defined by the angular opening angle and by the radius of the outer sphere, while the inner radius is set by the sublimation temperature of graphite and silicate grains under the influence of the strong nuclear radiation field.
The computation of the thermal and scattering emissions throughout the torus is performed by numerically solving the radiative transfer equation with an iterative procedure.
As discussed in Fritz et al., the model provides excellent fits to the observed SEDs of a wide variety of active nuclei and quasars.
| ID | X-ID | z | optical spectral | Overall SED | Mass |
|---|---|---|---|---|---|
| classification | classification | () | |||
| 0 | 0.410 | ELG | AGN | 10.88 | |
| 1 | X-067 | 0.638 | Early+[OII] | SB | 12.15 |
| 2 | X-082 | 0.679 | AGN2 | AGN | 11.21 |
| 3 | X-110 | 1.141 | AGN | 11.34 | |
| 4 | X-113 | 0.845 | LINER | AGN | 11.32 |
| 5 | 0.156 | ELG | SB | 10.05 | |
| 6 | 0.512 | LINER | AGN? | 9.50 | |
| 7 | X-115 | 0.680 | AGN2 | AGN | 10.65 |
| 8 | X-149 | 1.223 | ELG | SB/AGN? | 10.78 |
| 9 | X-160 | 0.848 | Starforming | AGN | 11.50 |
| 10 | X-169 | 0.845 | Early-type | AGN? | 11.10 |
| 11 | 0.766 | Early+[OII] | SB | 11.02 | |
| 12 | 0.277 | Early-type | SB | 9.76 | |
| 13 | X-240 | 0.961 | AGN2 | AGN | 12.50 |
| 15 | X-383 | 0.105 | SB | 10.25 | |
| 16 | X-388 | 0.231 | Early-type? | SB | 10.40 |
| 17 | 0.899 | Starforming | SB | 10.20 | |
| 19 | 0.278 | Starforming | SB | 9.44 | |
| 20 | 0.911 | Early+faint[OII] | AGN | 10.74 | |
| 1x | X-414 | 0.798 | Early | SB | 10.90 |
| 2x | X-230 | 1.013 | Early-type, post-SB | SB? | 11.51 |
| 3x | X-294 | 0.474 | AGN | 10.14 | |
| 4x | X-249 | 0.475 | SB | 10.56 | |
| 5x | X-286 | 0.954 | Early | AGN | 11.40 |
| 6x | X-257 | 0.089 | Early-type | Inactive | 9.79 |
| 7x | X-274 | 0.321 | Early-type | Faint AGN? | 10.74 |
| 8x | X-354 | 0.569 | SB? | 10.44 | |
| 9x | X-241 | 0.850 | Early-type | AGN | 10.66 |
| 10x | X-210 | 0.848 | SB? | 11.26 | |
| 11x | X-212 | 0.943 | Early-type | AGN | 10.90 |
| 12x | X-194 | 0.556 | Early+faint[OII] | AGN | 10.34 |
| 13x | X-131 | 0.632 | Starforming | SB | 10.20 |
| 14x | X-114 | 0.534 | Early-type | SB | 10.66 |
![[Uncaptioned image]](/html/astro-ph/0701178/assets/x25.png)
Figure 7 (continued)
In almost all cases, the combination of an evolved stellar population fitting the optical and NIR spectrum, and an obscured AGN emission component to explain the MIR spectrum, always provides much better fits to the data (as can be argued from the comparison of the statistics in the left and right panel of Figures 4 and 5). As anticipated, in 6 cases this solution including an AGN is required by the IR data. (Obviously, we did not attempt to constrain the torus physical parameters with the few available data-points).
In order to have a complete census of the physical properties of the spheroidal population, we checked the observed optical-to-IR SEDs of the -band selected galaxies lacking a detectable mid-IR or X-ray counterpart (135 out of the initial 168). For these sources we built a multiwavelength photometric data-set similar to that described for the main sample of this work, covering the spectral range 0.3-8.0 m. The vast majority of these objects show SEDs consistent with that of a passively evolving stellar population, typical of quiescent elliptical galaxies. We found that only few sources (6%) present some indication of “activity” in the observed SEDs, simply because the photometric data points at wavelengths larger than 5 m show an underlying rising spectra. However, a more detailed work on this photometric data-set would be required to constraint the properties of the full morphological spheroidal sample.
4.2 Optical Spectroscopy
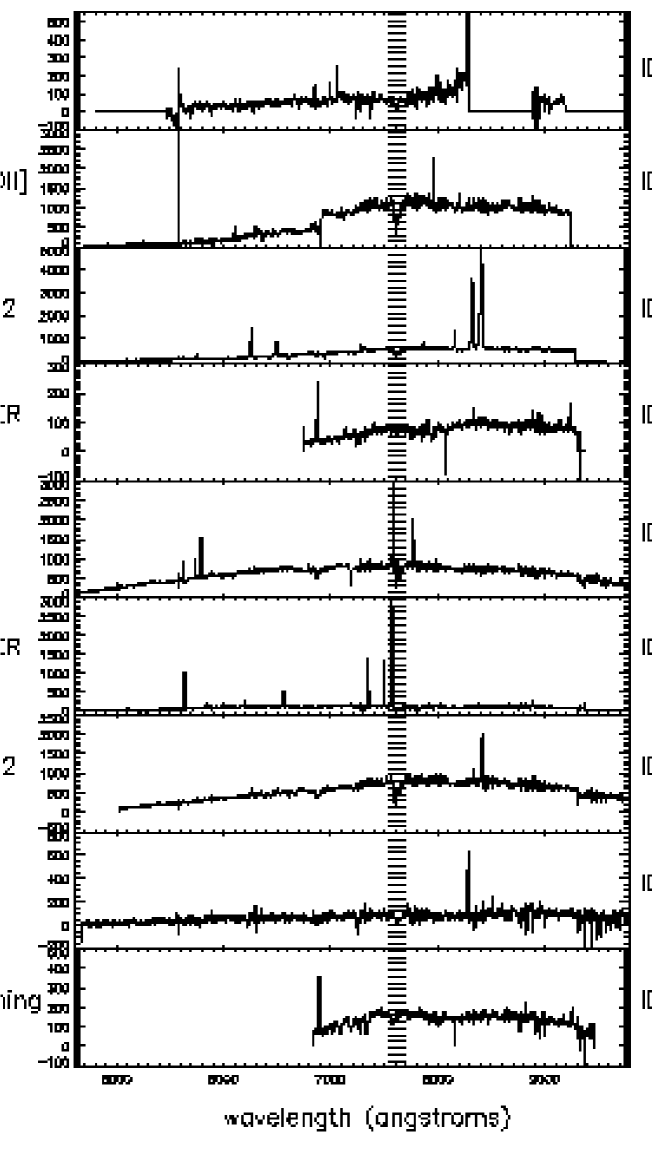
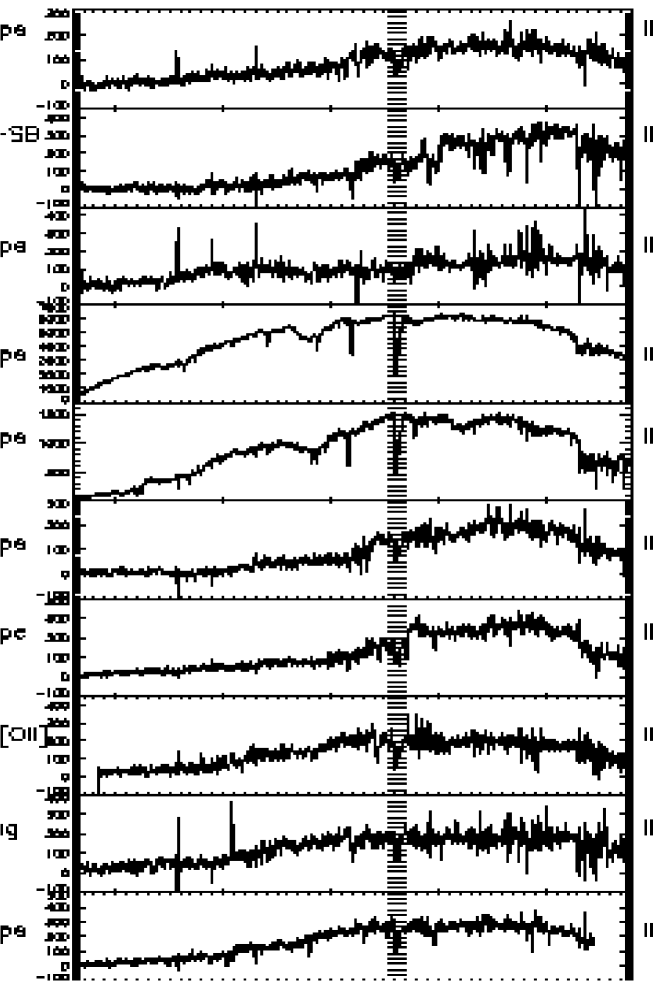
The optical spectra available for our high-redshift spheroidal galaxies are reported in Figures 7 and 8. The emission lines were analysed only in terms of the equivalent widths and flux ratios of contiguous lines, because the optical spectra retrieved from the WEB were not flux calibrated. Objects with a red continuum and faint (or absent) emission lines () are classified as passive early-type galaxies. When two or more emission lines were measured, we applied the usual diagnostic diagrams (Veilleux & Osterbrock, 1987) in order to classify the galaxies according to the star-forming emission line, Seyfert-2 or LINER categories. In few cases we could not disentangle the Seyfert-2s/LINERs classes due to the limited observed spectral range. Sources with more than one emission line were classified as Starforming, while when only a single emission line is visible, we classify the object as an Emission Line Galaxy (ELG).


Optical spectra for our sub-sample of galaxies detected only in the X-ray bands are reported in Figure8, and have been analysed based on similar procedures.
Since the original parent sample is morphologically selected spheroidal galaxies, we might be surprised by the high incidence of strong emission lines in the optical spectra (67% of the objects show at least one line with ), considering the usual fairly good agreement between the morphological and spectroscopic classifications. However, this fraction of optical emission line spectra is not untypical if referred to the original parent sample: a 10% of emission-line objects among high-z morphological ellipticals was also found in the K20/GOODS sample by Cassata et al. (2005). Moreover, it is well known that the fraction of spheroids with emission lines increases with redshift, with a typical value of 20% in the redshift range (Brinchmann et al. 1998; Treu et al. 2002; Treu et al. 2005). In particular, 25% of the spheroidal galaxies in the Treu et al. sample, when limited to the same morphological classes considered in this work (class=0,1), present OII emission lines (10% with ). This might suggest that the fraction of active spheroids based only on optical indicators is consistent with that determined with the combination of X-ray and MIR selections.
4.3 X-Ray Properties
We consider here the X-ray emission properties of spheroidal galaxies. A first indication comes from Figure 9, plotting the soft and hard X–ray fluxes versus the R–band magnitudes. The first point to be remarked is that the optical and X-ray fluxes appear largely unrelated.
The values of the X–ray–to–optical flux ratio (, with C=5.5) can then be used to obtain a preliminary classification of the X–ray emission components (e.g. Maccaccaro et al. 1988): various classes of X–ray emitters are characterized by different values of X–ray–to–optical flux ratio. Optically and X–ray selected AGN have, on average, relatively high X/O values (–11), while infrared emitting starforming galaxies show lower X/O ratios (; Alexander et al. 2001; Franceschini et al. 2003; Ranalli et al. 2003), and even lower values ( –2) are typical for X–ray quiescent normal galaxies, whose X–ray flux is due to the integrated emission of compact sources and/or hot interstellar plasma (Hornschemeier et al. 2001).
This classification based on the X–ray–to–optical flux ratio should be considered with caution and is somewhat dependent on the adopted energy range. For this reason we consider separately the 0.5–2 keV and 2–8 keV X–ray fluxes in the figure. The six sources detected in the hard band (filled squares in bottom Figure 9) are well within the AGN locus. Their soft X–ray fluxes are lower than the 2–8 keV ones and the observed 0.5–10 keV luminosities are within the Seyfert range (1042-44 erg/s).
Three of them (IDs #2, #9, #20) fall outside the AGN region () in the soft band diagram, and, according to the classification based on the X-ray-to-optical flux ratio, they would be classified as star-forming galaxies. However, the AGN locus boundaries in diagrams should not be considered as strict limits. From an inspection of the two panels of Figure 9, it is clear that the three sources have hard spectrum’ This hypothesis is corroborated by the results of the spectral analysis.
Five out of the six hard X–ray detected sources (2, 4, 7, 9, 13) have enough counts ( 100) to allow us to perform a moderate–quality spectral analysis. Source and background spectra, response matrices and effective areas have been extracted from the merged events file using the standard CIAO tools developed to properly weight responses and effective area files for multiple extraction regions (mkwarf and mkwrmf; see Civano et al. 2005 for a detailed description). Source spectra were re-binned in order to have enough counts per bin (15–20) to apply statistic, and were fitted with XSPEC 11.3 (Arnaud 1996). Power–law model spectra with intrinsic absorption at the source redshift have been adopted. The results of spectral fitting are reported in Table 2. Errors are at the 90 per cent confidence level for one interesting parameter (). The best fit values and the corresponding unabsorbed 0.5–8 keV luminosities (1043–1044) are typical of moderately obscured Compton–thin Seyfert galaxies (Risaliti et al. 2002).
Despite the relatively low counting statistics, the X–ray spectrum of ID #9 (Figure 10) does clearly require a rather large column of cold gas (). Source #2 has a very flat spectrum and an emission line at the redshift expected from the iron with a large (1 keV) EW is evident from the residuals of a power law fit (Figure 10). A similar model provides a good description of the ID #20’s spectrum, though with lower significance due to the poor counting statistics. In both cases, Compton thick absorption is the most likely explanation of the X–ray properties. Assuming that the observed luminosity is entirely due to reflection by thick matter with an albedo of 2% (Comastri 2004), the intrinsic luminosity would be of the order of about erg/s for source #2 and about erg/s for source #20.
| AID | id | z | NH1022 | chi2/dof | LX(0.5-10 keV) | |
|---|---|---|---|---|---|---|
| 82888Source number 82 has been fitted with the Cash statistic. | 2 | 0.679 | 0.400.33 | a | 0.11043 | |
| 113 | 4 | 0.84 | 1.56 | 0.6 | 39/31 | 1.01043 |
| 1.8 | 0.70.3 | 41/32 | 1.01043 | |||
| 115 | 7 | 0.68 | 1.570.07 | 0.49 | 63/62 | 2.11043 |
| 1.8 | 0.840.13 | 73/63 | 2.11043 | |||
| 160 | 9 | 0.848 | 1.10 | 9.8 | 6/11 | 8.71042 |
| 1.8 | 15.1 | 8/12 | 9.71042 | |||
| 240 | 13 | 0.961 | 1.590.09 | 4.8 | 105/96 | 1.31044 |
| 1.8 | 5.590.36 | 112/97 | 1.61044 |
Finally source #3 is also classified as an AGN on the basis of the observed X/O in the soft band (it is undetected in the hard band) and the relatively high ( erg/s) X–ray luminosity. Therefore, at least 7 of the 12 X–ray detected sources turn out to be luminous AGN.

4.4 The sample of X-ray detected active spheroidal galaxies with no MIR emission
We have attempted to complement the information provided by the limited sensitivity of the 24 m map by including in our analysis also the sample of 14 spheroidal galaxies detected in X-rays but not in the MIR. In these cases, ongoing activity is traced by the excess X-ray emission. Detailed information on these objects is reported in the third panel of Table 3.
The crosses in Figure 9 indicate the soft and hard X–ray fluxes against R magnitudes for such X-ray detected objects (numbers refer to the ID’s reported in the third panel of Table 3). The sources occupy a region of the plot intermediate between that of AGNs and that of starbursts. For 5 objects, those with ID #3x, 5x, 9x, 11x, 12x, an AGN predominance in the X-ray flux is suggested.
The X-ray luminosities in the 0.5-10 keV bin are reported against the -band absolute magnitude () as open diamonds in Figure 11. The comparison of the luminosities for the IR-detected (filled circles) and the undetected objects (open diamonds) reveal some tendency of the former to display larger luminosities in both bands. Our high- spheroidal galaxies tend to show larger values of the X-ray luminosity than the local counterparts in Figure11 (the local sample of spheroidal galaxies is taken from Ellis et al., 2006, small crosses in the Figure). In fact, the median of the X-ray luminosity for our high- sources is on the order of erg/s, while the median of the X-ray luminosity for the local sample is erg/s. Even if the selection of our flux limited sample () should ensure the completeness at optical wavelengths, to account for the possibility that our sample might be biased towards intrinsically brighter systems (simply because fainter objects at high- could fall out of the sample), we have also limited the comparison to the brighter systems. If we consider sources brighter than ¡-21 (as marked by the vertical dashed line in Figure 11), the median of the X-ray luminosity for our high- sources is still on the order of erg/s, while the median of the X-ray luminosity for the local sample is brighter than the previous case, erg/s. However, also at brighter optical luminosity the high- spheroidal population seem to populate brighter X-ray luminosities. However, the agreement with local data start to look better at even brighter optical luminosities (¡-22). In this case, again erg/s for the high- sample, but in the local Universe.
To derive the absolute B magnitudes we have computed the observed B magnitudes in the rest-frame, for each object, by convolving the corresponding best-fit redshifted-SEDs with the B-band filter. We have then converted the observed rest-frame magnitudes into their absolute values through the corresponding luminosity distances. Error bars in the Figure accounts for the uncertainties on the photometry and on the -correction applied to derive the rest-frame absolute magnitudes.
The X-ray luminosities have been proposed to allow further rough discrimination between AGN- and starburst-dominated phenomena: the value of erg/s has been found to be a limit only rarely approached and never exceeded by star-forming galaxies (Franceschini et al. 2003; Persic et al. 2004).
An important point about the origin of the X-ray energy source is to understand how much of it might be related with the presence of long-lived emissions by hot plasma coronae or by old evolved stellar populations, instead of tracing ongoing activity phenomena.
Discovered by the Observatory (Forman et al. 1979), the hot coronae around local early-type galaxies were interpreted as plasma distributions with masses up to several in quasi-static equilibrium in the galaxy dark matter halo. The heating and cooling mechanisms and timescales are not completely clear. The former, in particular, might be related with residual star formation and supernovae explosions (e.g. Forman et al. 1994).


Because of these uncertainties, the interpretation of the X-ray emissions in our high-redshift spheroidal galaxies might turn out to be ambiguous. However, the temperatures observed in local objects for such gas coronae are low, (Forman et al. 1994), consistent with the modest gravitational fields confining them. For the 8 galaxies detected in hard (2-8 keV) X-rays, our observed X-ray fluxes require much hotter plasmas (, computed by assuming that only a single thermic component contributes to their X-ray emission), also taking into account the appreciable -correction. How much of the hard X-ray fluxes by early-type galaxies might be due to old stars in low-mass X-ray binaries (LMXB) is a problem already addressed in detail in a number of papers. Forman & Jones (1989), Fabbiano et al. (1989) argue that only X-ray luminosities lower than erg/s can be contributed by LMXB’s, while those higher than erg/s are dominated by gaseous emission. For our typical sample sources, the X-ray luminosities exceeding a few times erg/s indicate that the LMXB contribution should be negligible, with the exception of source #6x, likely contributed by either long-lived plasma emission or LMXB’s.
For the other 5 objects in our sample undetected in the hard X-ray band the interpretation is less clear, and will be further discussed later.
4.5 Colour-Colour Diagnostics and Broad-Band X-ray-to-IR Flux Ratios
We have looked for additional colour diagnostics to further discriminate the nature of the emissions in our sample of spheroids. A combination of optical to near-IR colours has been recently suggested by Franceschini et al. (2005) as a diagnostic tool to disentangle among different AGN categories and normal galaxies. The corresponding plot for our source sample is reported in Figure 12, showing the ratio of the -band over the 4.5 m fluxes against the to optical -band flux ratio. From bottom-left to top-right, the three domains delimited by the solid lines correspond to the three different populations: type-1 AGNs, type-2 AGNs and normal/starburst galaxies, in the order. The three regions in the figure have been empirically calibrated by Franceschini et al. (2005) by using a sample of sources with known spectral types. Type-1 AGNs and optical quasars exhibit standard blue optical colours (attributed to an accretion disk) and steeply rising near-IR spectra (due to the presence of dust re-radiation; e.g. Fritz et al. 2006), and are expected to populate the bottom-left corner of the plot. Normal or starbursting galaxies have, according to the redshift, either blue optical and blue near-IR colours (at low-), or red optical and red near-IR (at high-z), and tend to fall in the complementary region of the plot outside the solid lines. Finally, type-2 and obscured AGNs populate intermediate colour regions999In their original version Franceschini et al. used standard Johnson -band, instead of the used here: solid lines in Figure 12 have then been corrected to account for this difference..
In the upper panel the different symbols indicate the spectroscopic classification based on the optical spectrum. In the lower panel we differentiate spheroidal galaxies with 24 m flux detection only, from those detected in both MIR and X-rays, and from the X-ray emitting spheroids with no detectable MIR emission.
As expected, our high- spheroidal galaxies with either IR excess or X-ray emissions almost completely avoid the colour region corresponding to type-1 quasars (bottom-left corner).
Objects with both MIR and X-ray bright detections (filled squares in the bottom panel) dominate the type-2 AGN regions. Top panel also reveals that the same region is occupied by sources with characteristic AGN lines (filled circles). Sources lacking an X-ray counterpart (open squares) or those with an X-ray detection only (crosses) are mostly distributed in the region expected for normal/starforming galaxies. Sources detected at 24 m and in X-rays fall mostly inside the boundaries of type-1 and type-2 AGNs.
We observe a generally fair agreement of this diagnostics with that of Figure 9. Source #8, which falls in the AGN 1 region in the plot of Figure 12, is only marginally consistent with an AGN classification based on its hard-X flux and -band magnitude. However, this object is spectroscopically classified as ELG, implying a difficult interpretation of its MIR excess.
The near-IR colour information is complemented in Figure 13 with that on the broad-band X-ray-to-IR flux ratios, following a diagnostic scheme also discussed in Franceschini et al. (2005). The two panels report data with different symbols corresponding to different classification criteria for the sources, as detailed in the inserts. The bottom panel includes also sources with X-ray detection only (no MIR). Bona-fide AGNs, with clear excess fluxes in X-rays and in the MIR (4.5 m), occupy the region indicated in the top-right quadrant, while objects with less extreme X-ray and IR emissivities, hence more likely dominated by stellar activity, are spread in the other quadrants of the plot.
We see an overall good level of agreement among these various classification tools, with the exception of those based on the optical emission/absorption lines providing a classification often at variance with the others.
5 Discussion
5.1 Local versus High-Redshift Spheroidal Galaxies
With few exceptions, early-morphological type galaxies in the local universe appear as typically inactive systems, almost completely devoid of an interstellar medium, with no relevant star-formation or AGN activity in place. This view has been essentially confirmed by a variety of observations, including those carried out with space IR and X-ray observatories. The IRAS survey first revealed that a fraction of local spheroidal galaxies contain some amounts of ISM gas and dust (Jura et al. 1987; Knapp et al. 1989). The Infrared Space Observatory (ISO), with better sensitivity and higher resolution, has shown the presence of trace amounts of dust and Polycyclic Aromatic Hydrocarbon molecules (PAHs) in the MIR spectra of a few local early-type galaxies (i.e. Madden et al. 1999; Athey et al. 2002; Xilouris et al. 2004), results also recently confirmed by observations with the Spitzer Space Telescope (Pahre et al. 2004). Spitzer IRS spectra reported by Bressan et al. (2006) show that, in the bulk of local early-type galaxies, the MIR emission is due to circumstellar dust shells produced by AGB stars.
In such local populations the dust contribution to the MIR light is quite modest, however, providing a tiny fraction of the bolometric galaxy emission. The corresponding amount of dust is negligible.
On the contrary, we have found that a significant fraction (15%) of high-redshift spheroidal galaxies are detected with substantial mid- and far-IR luminosities, which are a factor 10 higher than found in the local counterparts (see Figure 6). The large MIR excess emissions are apparent in the SED’s of Figs. 4 and 5, particularly evident if compared with the integrated spectra of local objects reported e.g. by Athey et al. (2002) and Bressan et al. (2006). These emissions cannot be interpreted in terms of simple stellar mass loss. The latter interpretation of our observed fluxes would require both mass loss rates quite larger than expected during any evolutionary phases of spheroidal galaxies, and metallicities of the main stellar populations factors 2-3 higher than solar (Bressan et al. 1998, 2001). Further evidence that circum-stellar dust by evolved stars cannot be responsible for the excess IR emissions is provided by the emission lines detected in all the optical spectra of figure 7 and by the large X-ray luminosities of the majority of the sample objects.
A related question is about the origin of the observed X-ray emission for the sub-sample objects with no MIR detection. Less information is available for these spheroidal galaxies, and correspondingly more difficult is their interpretation. These sources tend to be less active than the MIR emitting ones, as for example indicated by their typical X-ray luminosities ( erg/s), and by the fact that 5 out of 10 of them do not show appreciable emission lines in Figure 8. Here again, however, the properties for the majority of the sources appear to require the presence of an activity source, as summarized in Table 1.
5.2 Nature of the IR and X-ray Emissions in High-z Spheroidal Galaxies
5.2.1 The IR-loud Population
With reference to the 19 spheroids with detectable MIR emission, we have found 8 objects for which all our diagnostic diagrams provide consistent evidence for a dominant AGN presence. These are sources #0, 2, 3, 4, 7, 9, 13 and 20. Only four of them (#2, 4, 7, 13) display type-2 AGN features in the optical spectrum.
Source #8 appears as a transition object in all diagrams and the SED seems to require a dusty-torus contribution to the MIR. Similarly, source #6 shows a LINER spectrum and its SED suggests an AGN contribution in the MIR. Source #10 also appears as a transition object, with colours in Figure 12 close to those of type-2 AGNs and a large X-ray luminosity in Figure 11.
For eight further sources (#1, 5, 11, 12, 15, 16, 17, 19), none of our diagnostic diagrams indicates the presence of an AGN. For most of these, instead, the rest-frame 12 m and X-ray luminosities in Figs. 6 and 11 require the presence of star formation activity in the galaxy. Based on our spectral best-fits to the SED data, we have computed the bolometric luminosities and from these estimated the star-formation rates (SFR’s) using recipes discussed in Rowan-Robinson et al. (1997) and Elbaz et al. (2002). We infer values of SFR from to . For the two low-redshift galaxies #5 and #15, the SFR is instead around 0.2 at most.
5.2.2 The Population Emitting in X-rays only
A basic uncertainty is whether an activity (AGN or starburst) is present at all in these galaxies, or if their X-ray flux might be entirely explained by long-lived emissions by hot plasma coronae or LMXB populations. Eight out of the 14 X-ray–only galaxies are detected in the hard X-ray (2-8 keV) band with luminosities larger than erg/s. As discussed in Sect. 4.4, the combination of the large X-ray luminosity and hard X-ray band implies either an AGN or an ongoing starburst to reside in these sources. Of these, at least 5 (ID #3x, 5x, 9x, 11x, 12x) show evidence for an AGN in the large value of the X-ray luminosity (Figure 13), the large X/O ratios (Figure 9), and in the optical spectra (Figure 8). Sources #4x and #14x are likely to host a luminous starburst, while source #7x is a low-optical luminosity, moderately active galaxy in X-rays, and could host a low-luminosity AGN.
Two of the remaining 6 objects detected only in the soft X-rays (ID #1x and #13x), show prominent [OII] and other emission lines and are star forming galaxies. Source #2x is a very luminous soft X-ray and very bright galaxy in the optical (Figure 11), with a passive (absorption-line, post-starburst) optical spectrum, and likely to host an obscured starburst, or post-starburst young stellar population.
Source #6x is, on the contrary, a very low-luminosity local object in both soft X-rays and the optical. The X-ray emission is likely to originate from a hot plasma corona, also confirmed by the complete absence of optical emission lines.
Finally, for the soft X-ray emitting objects #8x and #10x we lack an optical spectrum. Both are moderately luminous in the optical and X-rays (, erg/s) and all their properties are consistent with those of starbursts.
5.3 Galaxy Morphologies
The unique multi-band ACS imaging add valuable physical information on the sample galaxies. Indeed, if the activity is triggered by merging or interactions, we expect we would be able to detect it.
The images in Figs. 1 and 2 first confirm that the far-IR emitting objects appear to have been detected in a higher activity stage than the X-ray emitting only. Of the 19 IR-loud galaxies, 12 show morphological peculiarities or some evidence of interactions, while only 4 of the 14 sources detected in X-rays show morphological irregularities.
In some cases (ID #4, #8, #9, #10, #11, #9x) the spheroidal galaxies look part of a group.
However, the majority of the X-ray emitting and a good fraction of the IR-loud objects (i.e. 15 out of 33 in the total sample) appear well isolated and showing the regular elliptical contours of spheroidal galaxies.
5.4 Statistical Considerations
From the combined diagnostics considered in this work (morphology, spectroscopy, X-ray emissions, colours, broad-band luminosity ratios), a rather heterogeneous scenario emerges concerning the nature of the population of ”active” spheroidal galaxies at redshifts from 0.3 to 1.2.
In summary, among the 33 spheroids with excess MIR or X-ray emissions, 13 show clear evidences for the presence of an obscured AGN as mainly responsible. For 16 objects (8 among the IR-loud and 8 more in the X-ray loud classes) the most likely interpretation is in terms of an hidden starburst, with typical SFR values between 1 and few tens . The remaining 4 galaxies display less characteristic, intermediate physical properties. Among them, the rate of star-formation appears to be modest in the 2 lowest-redshift galaxies (#5 and 15) or even absent in #6x.
In conclusion, almost 20% of the optically-selected population of faint high- spheroidal galaxies show evidence of activity at the instant of the observation. Roughly half of them (10% of the total optically-selected spheroidal galaxy population), appear dominated by AGN, the other half by starburst activity (another 10% of the total). In either case, the duration of the phenomenon is expected to be short, of the order of (e.g. Forster-Schreiber et al. 2003; Cavaliere & Padovani 1989), and likely to follow merging or interaction with a gas-rich system, able to funnel fresh gas into the galaxy nucleus. The process would then be expected to contribute new stars and to increase the nuclear super-massive black hole in the AGN sub-class.
Compared with the 5–7 Gyrs corresponding to the Hubble times at the source redshifts, the expected short duration of the processes and the significant fractions of the objects detected in the active phase are consistent with the fact that the whole spheroidal population undergoes few to several such episodes at .
Then assuming for example as a reference for the SFR the value of 10 and a star-formation timescale of , this would imply several such episodes for each galaxy, each one contributing of the order of few percent of the final stellar content of the galaxy on average. For the most massive galaxies this is not expected to modify significantly the stellar mass below , while for objects with the increase with cosmic time would be expected to be more substantial.
Altogether, these results are at least not inconsistent with recent analyses of the evolution of the galaxy stellar mass as a function of redshift based on complete near-IR selected samples with spectroscopic follow-up (Dickinson et al. 2003; Bundy et al. 2005; Fontana et al. 2004; Franceschini et al. 2006). Moreover, starting from a similar (and partially overlapping) morphological sample as used in this paper, Treu et al. (2005) confirmed the presence of star formation in spheroids at high redshift. They studied the spectroscopic properties of spheroids and the evolution of the fundamental plane, and confirm a scenario in which the efficiency of SF is enhanced in the most massive galaxies at the higher redshifts, and proceeds with longer timescales in the smaller ones (the effect).
Our results, in which AGN and starburst activities are tightly intertwined and actually almost inextricable in several of our galaxies, emphasize the continuity of the two processes and further support the case for a co-evolution of quasars and bulges (Franceschini et al. 1999; Granato et al. 2004).
6 Conclusions
To complement searches for recent or ongoing star-formation and nuclear accretion in high-redshift spheroidal galaxies, we have exploited deep MIR and X-ray observations by and in the GOODS-N area. This allowed us to identify signs of hidden activity that might escape optical investigations based on colours or strong morphological signatures of merging or interactions.
Our reference sample are 168 morphologically classified spheroidal (elliptical/lenticular) galaxies with selected from GOODS ACS imaging. We have found that a significant fraction of the E/S0’s show unexpected emissions in the MIR: nineteen of them have 24-m detections in the GOODS catalogue, while 6 have detectable radio flux at 1.4 GHz with 40 Jy.
We have also looked for traces of hidden activity in our optically-selected spheroidal population in the 2 Ms catalogue and detected significant flux from 25 sources (13 of which having 2-8 keV hard X-ray emission). Of these, 11 belong to the MIPS 24-m catalogue and 14 more are detected in X-rays only.
The nature of the near- and MIR emission observed by is analyzed through the SEDs based on the available multi-wavelength photometry, including X-ray, UV, optical, near-, MIR, and radio fluxes. The inferred amount of diffuse dust appears substantially in excess of that expected by mass loss from late-type stars. We have used in addition a variety of diagnostics, including optical spectroscopy, colour-colour diagrams, and broad-band flux ratios to interpret the nature of the energy source.
When the available independent diagnostics are compared, in general they provide consistent classifications about the nature of the activity in the spheroidal population. However, the SED fitting study alone tends to privilege an AGN predominance in almost all sources. X-ray diagnostics (luminosities and spectral analysis) and colour-colour diagrams instead provide much correlated classifications. Given that, in principle, none of these diagnostics alone can be considered as conclusive, only trough a panchromatic comparison of them we can reach an accurate comprehension of the underlying physical processes.
Our multi-wavelength analysis of the X-ray and MIR properties leads us to conclude that at least 8 of the 19 IR-detected sources should hide an obscured AGN, while the X-ray undetected sources are more likely dominated by ongoing star formation.
More uncertain is the interpretation of spheroidal galaxies detected in the X-ray bands only and undetected in the MIR, a basic question being to understand whether an activity source is present at all, or if the X-ray fluxes might be entirely explained by long-lived emissions by hot plasma coronae or LMXB populations. Our analysis shows evidence for the presence of an AGN or an ongoing starburst in the majority of them.
We conclude that 15% to 20% of the original sample of 168 spheroidal galaxies in GOODS-N are detected during phases of prominent activity, probably following an event of merging/interaction. Our morphological analysis has revealed that only roughly a half of the galaxies show evidence of some peculiarities, the other half displaying standard spheroidal morphologies. This might be taken as evidence that our IR/X-ray selection tends to pick up the latest stages of a merging/interaction process.
Thirteen galaxies (8% of the complete sample) show evidence for the presence of an obscured AGN, and for other 16 (10%) the most likely interpretation is in terms of a hidden starburst. Due to the expected short lifetimes of these IR and X-ray emissions, this observed fraction implies widespread activity in this class of galaxies during the cosmic epochs – to – subject to our investigation.
Acknowledgments
This work is based on observations made with the Space Telescope, which is operated by the Jet Propulsion Laboratory, California Institute of Technology under NASA contract 1407. Support for this work, part of the Space Telescope Legacy Science Program, was provided by NASA through an award issued by the Jet Propulsion Laboratory, California Institute of Technology under NASA contract 1407.
ACS was developed under NASA contract NAS 5-32865, and this research has been supported by NASA grant NAG5-7697. We are grateful for an equipment grant from Sun Microsystems, Inc. The Space Telescope Science Institute is operated by AURA Inc., under NASA contract NAS5-26555.
We thank an anonymous referee for a careful reading of the paper and numerous useful comments. We also thank Marcella Brusa for useful discussions and Mary Polletta for providing us with her SED templates..
We acknowledge financial contribution from contract ASI-INAF I/023/05/0.
References
- Alexander et al. (2001) Alexander, D. M., Brandt, W. N., Hornschemeier, A. E., Garmire, G. P., Schneider, D. P., Bauer, F. E., & Griffiths, R. E. 2001, AJ, 122, 2156
- Alexander et al. (2003) Alexander, D. M., et al. 2003, AJ, 126, 539
- Alexander et al. (2005) Alexander, D. M., Smail, I., Bauer, F. E., Chapman, S. C., Blain, A. W., Brandt, W. N., & Ivison, R. J. 2005, Nature, 434, 738
- Arnaud (1996) Arnaud, K. A. 1996, ASP Conf. Ser. 101: Astronomical Data Analysis Software and Systems V, 101, 17
- Athey et al. (2002) Athey, A., Bregman, J., Bregman, J., Temi, P., & Sauvage, M. 2002, ApJ, 571, 272
- Barger et al. (2003) Barger, A. J., et al. 2003, AJ, 126, 632
- Bell et al. (2005) Bell, E. F., et al. 2005, ApJ, 625, 23
- Berta et al. (2004) Berta, S., Fritz, J., Franceschini, A., Bressan, A., & Lonsdale, C. 2004, A&A, 418, 913
- Bertin & Arnouts (1996) Bertin, E., & Arnouts, S. 1996, A&AS, 117, 393
- Borch et al. (2006) Borch, A., et al. 2006, A&A, 453, 869
- Brand et al. (2005) Brand, K., et al. 2005, ApJ, 626, 723
- Bressan et al. (1998) Bressan, A., Granato, G. L., & Silva, L. 1998, A&A, 332, 135
- Bressan et al. (2001) Bressan, A., Aussel, H., Granato, G. L., Rodighiero, G., Panuzzo, P., & Silva, L. 2001, Astrophysics and Space Science Supplement, 277, 251
- Bressan et al. (2006) Bressan, A., et al. 2006, ApJL, 639, L55
- Brinchmann et al. (1998) Brinchmann, J., et al. 1998, ApJ, 499, 112
- Bundy et al. (2005) Bundy, K., Ellis, R. S.,& Conselice, C. J. 2005, ApJ, 625, 621
- Bundy et al. (2006) Bundy, K., et al. 2006, ApJ, 651, 120
- Capak et al. (2004) Capak, P., et al. 2004, AJ, 127, 180
- Capetti & Balmaverde (2005) Capetti, A., & Balmaverde, B. 2005, A&A, 440, 73
- Capetti & Balmaverde (2006) Capetti, A., & Balmaverde, B. 2006, A&A, 453, 27
- Cassata et al. (2005) Cassata, P., et al. 2005, MNRAS, 357, 903
- (22) Cassata, P., Guzzo, L., Franceschini A., et al. 2006, submitted
- Cavaliere & Padovani (1989) Cavaliere, A., & Padovani, P. 1989, ApJL, 340, L5
- Cimatti et al. (2004) Cimatti, A., et al. 2004, Nature, 430, 184
- Civano et al. (2005) Civano, F., Comastri, A., & Brusa, M. 2005, MNRAS, 358, 693
- Comastri (2004) Comastri, A. 2004, ASSL Vol. 308: Supermassive Black Holes in the Distant Universe, 245
- Cowie et al. (1996) Cowie, L. L., Songaila, A., Hu, E. M., & Cohen, J. G. 1996, AJ, 112, 839
- Croton et al. (2005) Croton, D. J., et al. 2005, MNRAS, 356, 1155
- Daddi et al. (2005) Daddi, E., et al. 2005, ApJ, 626, 680
- Dickinson et al. (2003) Dickinson, M., Papovich, C., Ferguson, H. C., & Budavári, T. 2003, ApJ, 587, 25
- Elbaz et al. (2002) Elbaz, D., Cesarsky, C. J., Chanial, P., Aussel, H., Franceschini, A., Fadda, D., & Chary, R. R. 2002, A&A, 384, 848
- Ellis & O’Sullivan (2006) Ellis, S. C., & O’Sullivan, E. 2006, MNRAS, 367, 627
- Fabbiano et al. (1989) Fabbiano, G., Gioia,I. M., & Trinchieri, G. 1989, ApJ, 347, 127
- Faber et al. (2005) Faber, S. M., Huang, J.-S., Noeske, K. G., Bundy, K., DEEP2 Team, IRAC GTO Team, & Palomar K-band Team 2005, American Astronomical Society Meeting Abstracts, 207,
- Fabian et al. (1991) Fabian, A. C., Nulsen, P. E. J., & Canizares, C. R. 1991, A&ARv, 2, 191
- Ferrarese & Merritt (2000) Ferrarese, L., & Merritt, D. 2000, ApJL, 539, L9
- Fontana et al. (2004) Fontana, A., et al. 2004, A&A, 424, 23
- Forman et al. (1979) Forman, W., Schwarz, J., Jones, C., Liller, W., & Fabian, A. C. 1979, ApJL, 234, L27
- Forman & Jones (1989) Forman, W., & Jones, C. 1989, Clusters of Galaxies Meeting, 257
- Forman et al. (1994) Forman, W., Jones, C., & Tucker, W. 1994, ApJ, 429, 77
- Förster Schreiber et al. (2003) Förster Schreiber, N. M., Genzel, R., Lutz, D., & Sternberg, A. 2003, ApJ, 599, 193
- Franceschini et al. (1998) Franceschini, A., Andreani, P., & Danese, L. 1998, MNRAS, 296, 709
- Franceschini et al. (2003) Franceschini, A., et al. 2003, MNRAS, 343, 1181
- Franceschini et al. (2005) Franceschini, A., et al. 2005, AJ, 129, 2074
- (45) Franceschini A., Rodighiero G., Berta S., Cassata P., 2005, to appear in the Proceedings of the Meeting ”AGN AND GALAXY EVOLUTION” (astro-ph/0602463)
- Franceschini et al. (2006) Franceschini, A., Rodighiero, G., Cassata, P. et al. 2006, A&A, 453, 397
- Fritz et al. (2006) Fritz, J., Franceschini, A., & Hatziminaoglou, E. 2006, MNRAS, 366, 767
- Georgakakis et al. (2006) Georgakakis, A. E., Georgantopoulos, I., & Akylas, A. 2006, MNRAS, 366, 171
- Georgantopoulos et al. (2006) Georgantopoulos, I., Nandra, K., Brotherton, M., Georgakakis, A., Papadakis, I. E., & O’Neill, P. 2006, MNRAS, 367, 1727
- Giavalisco et al. (2004) Giavalisco, M., et al. 2004, ApJL, 600, L93
- Glazebrook et al. (2004) Glazebrook, K., et al. 2004, Nature, 430, 181
- Granato et al. (2004) Granato, G. L., De Zotti, G., Silva, L., Bressan, A., & Danese, L. 2004, ApJ, 600, 580
- Grogin et al. (2005) Grogin, N. A., et al. 2005, ApJL, 627, L97
- Hodapp et al. (1996) Hodapp, K.-W., et al. 1996, New Astronomy, 1, 177
- Hogg et al. (2003) Hogg, D. W., et al. 2003, ApJL, 585, L5
- Hopkins et al. (2006) Hopkins, P. F., Hernquist, L., Cox, T. J., Di Matteo, T., Robertson, B., & Springel, V. 2006, ApJS, 163, 1
- Hornschemeier et al. (2001) Hornschemeier, A. E., et al. 2001, ApJ, 554, 742
- Ilbert et al. (2006) Ilbert, O., et al. 2006, A&A, 457, 841
- Jimenez et al. (2006) Jimenez, R., Bernardi, M., Haiman, Z., Panter, B., & Heavens, A. F. 2006, ArXiv Astrophysics e-prints, arXiv:astro-ph/0610724
- Juneau et al. (2005) Juneau, S., et al. 2005, ApJL, 619, L135
- Jura et al. (1987) Jura, M., Kim, D. W., Knapp, G. R., & Guhathakurta, P. 1987, ApJL, 312, L11
- Kauffmann et al. (2004) Kauffmann, G., White, S. D. M., Heckman, T. M., Ménard, B., Brinchmann, J., Charlot, S., Tremonti, C., & Brinkmann, J. 2004, MNRAS, 353, 713
- Knapp et al. (1989) Knapp, G. R., Guhathakurta, P., Kim, D.-W., & Jura, M. A. 1989, ApJS, 70, 329
- Knapp et al. (1992) Knapp, G. R., Gunn, J. E., & Wynn-Williams, C. G. 1992, ApJ, 399, 76
- Knapp (1999) Knapp, G. R. 1999, ASP Conf. Ser. 163: Star Formation in Early Type Galaxies, 163, 119
- Khochfar & Burkert (2003) Khochfar, S., & Burkert, A. 2003, ApJL, 597, L117
- Lacy et al. (2005) Lacy, M., et al. 2005, ApJS, 161, 41
- Le Fèvre et al. (2000) Le Fèvre, O., et al. 2000, MNRAS, 311, 565
- Lin et al. (2004) Lin, L., et al. 2004, ApJL, 617, L9
- Maccacaro et al. (1988) Maccacaro, T., Gioia, I. M., Wolter, A., Zamorani, G., & Stocke, J. T. 1988, ApJ, 326, 680
- Madden et al. (1999) Madden, S. C., Vigroux, L., & Sauvage, M. 1999, ESA SP-427: The Universe as Seen by ISO, 933
- McCarthy et al. (2004) McCarthy, P. J., et al. 2004, ApJL, 614, L9
- Miller et al. (2003) Miller, C. J., Nichol, R. C., Gómez, P. L., Hopkins, A. M., & Bernardi, M. 2003, ApJ, 597, 142
- Miyazaki et al. (2002) Miyazaki, S., et al. 2002, PASJ, 54, 833
- Pahre et al. (2004) Pahre, M. A., Ashby, M. L. N., Fazio, G. G., & Willner, S. P. 2004, ApJS, 154, 229
- Patton et al. (2002) Patton, D. R., et al. 2002, ApJ, 565, 208
- Persic et al. (2004) Persic, M., Rephaeli, Y., Braito, V., Cappi, M., Della Ceca, R., Franceschini, A., & Gruber, D. E. 2004, A&A, 419, 849
- Polletta et al. (2006) Polletta, M. d. C., et al. 2006, ApJ, 642, 673
- Ranalli et al. (2003) Ranalli, P., Comastri, A., & Setti, G. 2003, A&A, 399, 39
- Richards (2000) Richards, E. A. 2000, ApJ, 533, 611
- Rigby et al. (2004) Rigby, J. R., et al. 2004, ApJS, 154, 160
- Risaliti et al. (2002) Risaliti, G., Elvis, M., & Nicastro, F. 2002, ApJ, 571, 234
- Rowan-Robinson et al. (1997) Rowan-Robinson, M., et al. 1997, MNRAS, 289, 490
- Rowan-Robinson et al. (2005) Rowan-Robinson, M., et al. 2005, AJ, 129, 1183
- Saracco et al. (2005) Saracco, P., et al. 2005, MNRAS, 357, L40
- Silk & Rees (1998) Silk, J., & Rees, M. J. 1998, A&A, 331, L1
- Stoughton et al. (2002) Stoughton, C., et al. 2002, AJ, 123, 485
- Tanaka et al. (2005) Tanaka, M., Kodama, T., Arimoto, N., Okamura, S., Umetsu, K., Shimasaku, K., Tanaka, I., & Yamada, T. 2005, MNRAS, 362, 268
- Teplitz et al. (2005) Teplitz, H. I., Charmandaris, V., Chary, R., Colbert, J. W., Armus, L., & Weedman, D. 2005, ApJ, 634, 128
- Treu et al. (2002) Treu, T., Stiavelli, M., Casertano, S., Møller, P., & Bertin, G. 2002, ApJL, 564, L13
- Treu et al. (2005) Treu, T., et al. 2005, ApJ, 633, 174
- van der Wel et al. (2005) van der Wel, A., Franx, M., van Dokkum, P. G., Rix, H.-W., Illingworth, G. D., & Rosati, P. 2005, ApJ, 631, 145
- Veilleux & Osterbrock (1987) Veilleux, S., & Osterbrock, D. E. 1987, ApJS, 63, 295
- Wirth et al. (2004) Wirth, G. D., et al. 2004, AJ, 127, 3121
- Xilouris et al. (2004) Xilouris, E. M., Madden, S. C., Galliano, F., Vigroux, L., & Sauvage, M. 2004, A&A, 416, 41
| ID | AID | RA | DEC | z | f1.4GHz | f24 | f16 | f8.0 | f5.8 | f4.5 | f3.6 | f | fz | fi | fR | fV | fB | fU | f0.5-2keV | f2-8keV |
| (hours) | (deg) | Jy | Jy | Jy | Jy | Jy | Jy | Jy | Jy | Jy | Jy | Jy | Jy | Jy | Jy | erg s-1 cm-2 | ||||
| 24-m non-blended sources | ||||||||||||||||||||
| 1 | 67 | 189.01359558 | 62.18645859 | 0.638 | 124 | 1210.0 | 655 | 92.41 | 97.56 | 83.64 | 159.99 | 94.60 | 38.09 | 31.77 | 21.41 | 8.46 | 5.02 | 3.83 | 1.42e-16 | 3.21e-16 |
| 2 | 82 | 189.03387451 | 62.17671967 | 0.679 | 217 | 2300.0 | 266.70 | 124.82 | 71.61 | 79.97 | 48.77 | 19.64 | 18.09 | 8.59 | 3.22 | 1.41 | 1.03 | 1.37e-16 | 1.80e-15 | |
| 3 | 110 | 189.07011414 | 62.10406113 | 1.141 | 82.0 | 34.86 | 43.53 | 58.50 | 73.26 | 10.35 | 4.84 | 2.07 | 0.70 | 0.43 | 0.26 | 3.38e-16 | 1.14e-15 | |||
| 5 | 189.07263184 | 62.23794937 | 0.156 | 89.8 | 57.61 | 15.06 | 16.92 | 28.41 | 37.08 | 27.39 | 27.79 | 24.62 | 19.93 | 12.08 | 8.62 | |||||
| 6 | 189.07391357 | 62.13871002 | 0.512 | 123.0 | 9.57 | 4.29 | 5.32 | 4.92 | 9.36 | 5.07 | 5.12 | 4.38 | 3.13 | 2.30 | 2.54 | |||||
| 7 | 115 | 189.07490540 | 62.27656174 | 0.680 | 47 | 664.0 | 95.12 | 87.88 | 94.97 | 105.45 | 57.58 | 27.26 | 24.20 | 14.53 | 8.81 | 5.36 | 4.31 | 4.67e-15 | 1.05e-14 | |
| 8 | 149 | 189.11378479 | 62.21617126 | 1.223 | 138.0 | 15.60 | 14.65 | 21.14 | 24.69 | 10.59 | 6.08 | 4.36 | 3.13 | 2.10 | 1.12∗ | 5.05e-17 | 1.36e-16 | |||
| 9 | 160 | 189.12226868 | 62.27042007 | 0.848 | 208.0 | 125 | 54.13 | 57.20 | 60.72 | 90.56 | 48.37 | 19.58 | 14.76 | 6.18 | 2.76 | 1.36 | 1.33 | 1.15e-16 | 2.59e-15 | |
| 10 | 169 | 189.13232422 | 62.15205002 | 0.845 | 277.0 | 183.81 | 178.80 | 260.76 | 389.44 | 28.84∗ | 14.52∗ | 3.44∗ | 9.76e-17 | 2.66e-16 | ||||||
| 12 | 189.19013977 | 62.32765961 | 0.277 | 91.1 | 24.14 | 26.11 | 35.21 | 40.21 | 51.71 | 27.26 | 22.96 | 17.06 | 9.33 | 2.97 | 1.17 | |||||
| 13 | 240 | 189.19314575 | 62.23471069 | 0.961 | 179 | 211.0 | 130 | 92.92 | 79.74 | 77.76 | 93.96 | 47.33 | 16.91 | 11.05 | 5.59 | 3.35 | 1.50 | 1.07 | 3.26e-15 | 2.17e-14 |
| 15 | 383 | 189.31648254 | 62.19979858 | 0.105 | 221.0 | 99.58 | 126.59 | 190.62 | 310.11 | 378.43 | 218.31 | 176.33 | 127.03 | 80.42 | 30.29 | 12.38 | 5.33e-17 | 1.94e-16 | ||
| 16 | 388 | 189.31832886 | 62.25347900 | 0.230 | 187 | 219.0 | 72.49 | 68.01 | 95.11 | 133.84 | 111.30 | 35.57 | 26.61 | 15.26 | 6.22 | 2.59 | 1.66 | 8.96e-17 | 1.83e-16 | |
| 17 | 189.31959534 | 62.21960068 | 0.899 | 86.5 | 3.61 | 7.61 | 9.28 | 13.57 | 11.80 | 5.17 | 4.25 | 2.25 | 1.61 | 1.13 | 1.27 | |||||
| 19 | 189.42692566 | 62.30044937 | 0.278 | 97.5 | 22.08 | 9.34 | 11.40 | 11.65 | 14.43 | 8.90 | 7.56 | 5.98 | 3.98 | 1.82 | 1.27 | |||||
| 20 | 468 | 189.45289612 | 62.22037125 | 0.911 | 398.0 | 130.19 | 78.22 | 47.66 | 36.20 | 23.04 | 7.38 | 4.73 | 1.70 | 0.68 | 0.19 | 0.19 | 6.91e-17 | 6.7e-16 | ||
| 24-m blended sources | ||||||||||||||||||||
| 0 | 188.96078491 | 62.16981125 | 0.410 | 190.0 | 13.10 | 15.05 | 17.34 | 15.48 | 8.40 | 0.95∗ | 0.52∗ | 0.34∗ | ||||||||
| 4 | 113 | 189.07121277 | 62.16996002 | 0.845 | 62 | 88.2 | 19.79 | 34.77 | 44.58 | 69.45 | 34.28 | 9.65 | 6.09 | 3.07 | 1.30 | 0.94 | 1.59e-15 | 3.11e-15 | ||
| 11 | 189.15679932 | 62.14453888 | 0.766 | 82.3 | 10.95 | 20.03 | 22.09 | 37.38 | 27.83 | 7.24 | 4.99 | 2.07 | 0.80 | 0.27 | 0.13 | |||||
| X-ray detected sources lacking a 24-m counterpart | ||||||||||||||||||||
| 1x | 414 | 189.35189819 | 62.21170044 | 0.798 | 13.41 | 22.69 | 30.13 | 48.44 | 33.121 | 7.974 | 5.544 | 2.278 | 0.902 | 0.251 | 0.197 | 9.49e-17 | ¡2.53e-16 | |||
| 2x | 230 | 189.18499756 | 62.19263077 | 1.013 | 48.31 | 91.71 | 21.08 | 216.79 | 82.543 | 19.162 | 9.354 | 3.479 | 0.849 | 0.228 | 0.100 | 7.74e-17 | ¡1.80e-16 | |||
| 3x | 294 | 189.23709106 | 62.21722031 | 0.474 | 18.80 | 29.62 | 49.20 | 66.07 | 20.337 | 4.402 | 2.333 | 1.366 | 0.776 | 0.593 | 0.573 | 3.14e-16 | 4.31e-16 | |||
| 4x | 249 | 189.20028687 | 62.21926880 | 0.475 | 19.40 | 36.57 | 42.72 | 62.89 | 70.450 | 28.790 | 22.499 | 14.583 | 5.156 | 1.653 | 0.514 | 2.37e-16 | 4.48e-16 | |||
| 5x | 286 | 189.23100281 | 62.21989059 | 0.954 | 18.69 | 30.77 | 42.38 | 61.55 | 34.193 | 8.896 | 4.843 | 1.859 | 0.673 | 0.198 | 0.067 | 4.08e-16 | 7.75e-16 | |||
| 6x | 257 | 189.20588684 | 62.22978973 | 0.089 | 46.18 | 73.60 | 115.32 | 185.35 | 331.150 | 214.763 | 181.691 | 138.798 | 86.179 | 35.696 | 14.557 | 4.22e-17 | ¡1.58e-16 | |||
| 7x | 274 | 189.22029114 | 62.24567032 | 0.321 | 47.50 | 70.37 | 124.61 | 160.96 | 203.698 | 87.793 | 75.637 | 51.387 | 22.824 | 6.772 | 2.140 | 2.44e-16 | 2.19e-16 | |||
| 8x | 354 | 189.28599548 | 62.25051117 | 0.569 | 7.64 | 16.88 | 19.10 | 27.36 | 27.447 | 10.111 | 7.814 | 4.563 | 1.595 | 0.484 | 0.197 | 8.50e-17 | ¡2.09e-16 | |||
| 9x | 241 | 189.19331360 | 62.25815964 | 0.850 | 40.55 | 53.45 | 55.46 | 84.72 | 24.077 | 6.803 | 4.533 | 1.691 | 0.630 | 0.145 | 0.132 | 1.91e-16 | 3.38e-16 | |||
| 10x | 210 | 189.16569519 | 62.26335907 | 0.848 | 32.37 | 55.22 | 68.80 | 121.24 | 51.343 | 15.605 | 10.047 | 3.315 | 1.084 | 0.231 | 0.057 | 9.12e-17 | ¡1.68e-16 | |||
| 12x | 212 | 189.16729736 | 62.28221893 | 0.943 | 11.98 | 16.59 | 26.21 | 33.46 | 23.806 | 9.674 | 6.587 | 2.197 | 0.914 | 0.329 | 0.249 | 1.30e-16 | 2.73e-16 | |||
| 12x | 194 | 189.15321350 | 62.19900894 | 0.556 | 10.47 | 9.03 | 13.30 | 26.81 | 22.150 | 9.472 | 7.481 | 5.118 | 2.725 | 1.781 | 0.940 | 1.62e-15 | 2.01e-15 | |||
| 13x | 131 | 189.09410095 | 62.21123123 | 0.632 | 0.0 | 34.04 | 21.68 | 55.46 | 0.000 | 0.000 | 0.000 | 0.000 | 0.000 | 0.000 | 0.000 | 2.47e-17 | ¡1.96e-16 | |||
| 14x | 114 | 189.07359314 | 62.22906113 | 0.534 | 15.22 | 27.222 | 35.97 | 56.22 | 57.806 | 22.204 | 17.204 | 9.611 | 3.043 | 0.952 | 0.260 | 3.77e-17 | 6.59e-16 | |||
∗ ACS data from Bundy et al. (2005)