Na-O Anticorrelation and HB. VI. The chemical composition of the peculiar bulge globular cluster NGC 6388 ††thanks: Based on observations collected at ESO telescopes under programme 073.D-0211. Tables 3 is only available in electronic form at the CDS via anonymous ftp to cdsarc.u-strasbg.fr (130.79.128.5) or via http://cdsweb.u-strasbg.fr/cgi-bin/qcat?J/A+A/
We present the LTE abundance analysis of high resolution spectra for red giant stars in the peculiar bulge globular cluster NGC 6388. Spectra of seven members were taken using the UVES spectrograph at the ESO VLT2 and the multiobject FLAMES facility. We exclude any intrinsic metallicity spread in this cluster: on average, [Fe/H] dex on the scale of the present series of papers, where the first error bar refers to individual star-to-star errors and the second is systematic, relative to the cluster. Elements involved in H-burning at high temperatures show large spreads, exceeding the estimated errors in the analysis. In particular, the pairs Na and O, Al and Mg are anticorrelated and Na and Al are correlated among the giants in NGC 6388, the typical pattern observed in all galactic globular clusters studied so far. Stars in NGC 6388 shows an excess of process elements, similar to the one found in the twin bulge cluster NGC 6441. Mn is found underabundant in NGC 6388, in agreement with the average abundance ratio shown by clusters of any metallicity. Abundances of neutron-capture elements are homogeneously distributed within NGC 6388; the [Eu/Fe] ratio stands above the value found in field stars of similar metallicity.
Key Words.:
Stars: abundances – Stars: atmospheres – Stars: Population II – Galaxy: globular clusters – Galaxy: globular clusters: individual: NGC 63881 Introduction
NGC 6388 (C1732-447) is one of the 10 more massive objects in the whole globular cluster (GC) system of our Galaxy. Located in the bulge like its cluster twin NGC 6441, NGC 6388 is a luminous object ( according to the updated on-line version of the Harris 1996 catalog) at about 3 kpc from the Galactic center, at 10 kpc from the Sun and at slightly more than 1 kpc from the Galactic plane. Unfortunately, nothing is known about its orbit, due to the lack of any proper motion informations, or about its age.
Until about 10 years ago, this cluster was considered nothing more than another moderately metal-rich ([Fe/H] dex, Armandroff and Zinn 1988, from integrated light spectroscopy) bulge cluster. However, the discovery by Rich et al. (1997) of an extended blue horizontal-branch (HB) in NGC 6388 (as well as in NGC 6441) renewed interest and raised many questions about this pair of clusters. In case of (likely) old, metal-rich GCs we would expect from stellar evolution theory that HB stars were concentrated only to the red of the instability strip. NGC 6388 (and NGC 6441) are living proofs of something unusual, at variance with ”well behaved” clusters such as 47 Tuc and the near-solar metallicity Galactic open clusters, with their red HBs (clumps).
Besides the red HB clump, these two GCs show a conspicuous, well developed blue HB as well as a substantial population of RR Lyrae variables (Pritzl et al. 2002, Corwin et al. 2006); hence they qualify as the most metal rich globular cluster able to host Pop II variable stars (RR Lyraes as well as Pop II Cepheids). It is clear that the HB morphology and its variation with metallicity in this pair of clusters has no counterpart among the other Galactic GCs.
NGC 6388 (together with NGC 6441) is the most metal-rich example of the second-parameter effect at work in modeling the HB morphology (the first parameter being the metal abundance). Moreover, it seems that whatever the effect(s) is (are), the consequences are visible within the same cluster. This phenomenon is not unknown, the most notable example being NGC 2808, with its famous bimodal distribution of stars into a red HB clump and a blue HB extending down to faint magnitudes (e.g. Momany et al. 2003). However, important differences do exist: (i) NGC 2808 has a lower metallicity ([Fe/H], Carretta 2006), however, only a scarce population of variable stars has been found (Corwin et al. 2004); instead, both NGC 6388 and NGC 6441 host a relevant number of stars within the instability strip (Pritzl et al. 2001, 2002); (ii) the blue HB in NGC 2808 is normal, beginning at the same level of magnitude of the redder part; on the other hand, both bulge clusters have a blue HB sloped upward going blue ward in the color-magnitude diagram (Raimondo et al. 2002). In other words, the top of the blue HB tail is about 0.5 mag brighter in than the red HB clump; this tilt is not due to the differential reddening affecting NGC 6388 (see discussion in Raimondo et al. 2002) and it is present in all the photometric pass bands (Busso et al. 2004). Moreover, this is consistent with RR Lyraes in these extreme second-parameter clusters having abnormally long periods for their high metallicities, in fact even longer than in more metal-poor, typical Oosterhoff II GCs.
One of the most favored explanations for these peculiarities involves He enrichment in dense environments. Very blue, extended HBs may be a consequence of distinct stellar populations characterized by distinct He abundances, as suggested by D’Antona and Caloi (2004, and references therein). Also scenarios involving either a cluster high primordial He abundance or an He enhancement due to deep mixing have been proposed (see Sweigart and Catelan 1998). However, the latter solutions appear to be ruled out, and recent spectroscopic analyses of hot HB stars in NGC 6388 support the He pollution scenario (Moehler and Sweigart 2006a,b).
Therefore, NGC 6388 was well entitled to be considered (together with NGC 6441) in our present project aimed to study in details the possible link between chemical anomalies and global parameters (in particular the HB morphology). In this effort, we used the FLAMES multiobject facility (Pasquini et al. 2002) to obtain extensive spectroscopic surveys of about 100 stars on the red giant branch (RGB) in about 20 GCs. The observed spectra are used to derive abundances of Na and O, the best known elements involved in the high temperature H-burning reactions. In turn, the well known anticorrelation between Na and O abundances in RGB stars (see Gratton et al. 2004 for an extensive review on this subject) should be in some way linked to the existence of a He-rich population. In fact, the observed Na enhancements and O depletions (the typical signature of matter processed in intermediate-mass AGB stars and ejected in the early cluster environment) are expected to be accompanied by alterations in the He content. Thus, the evolving stars formed out of polluted gas should end up onto the bluest part of the HB, during the phase of their He-core burning since they evolve faster on the main sequence. All other factors (including the mass loss rate along the RGB) being equal, they will start their HB phase at hotter temperature, being less massive than other normal stars at the end of the main sequence (see D’Antona and Caloi 2004 and references therein).
In the framework of the present project we have already examined the massive and peculiar cluster NGC 2808 (Carretta et al. 2006a; Paper I), the more ”normal”, intermediate-metallicity, blue HB cluster NGC 6752 (Carretta et al. 2006b, hereafter Paper II), the other anomalous bulge cluster NGC 6441 (Gratton et al. 2006, 2007 Paper III and Paper V) and NGC 6218 (Carretta et al. 2006c, Paper IV).
The Na-O anticorrelation in NGC 6388, based on the detailed analysis of the GIRAFFE data will be presented in a forthcoming paper, while we concentrate here on the analysis of the higher resolution UVES spectra. Deciphering the detailed chemical composition of NGC 6388 is of paramount importance, because of the peculiar features of this cluster (and of its associate NGC 6441):
-
(a)
these clusters are among the best examples available to us of old, metal-rich populations, hence a key ingredient in the interpretation and synthesis of distant elliptical galaxies;
-
(b)
the presence of an important population of hot HB stars, presently under detailed investigations (Moehler et al. 1999, Moehler and Sweigart 2006b), is considered the major contributor to the UV-upturn phenomenon (see Yi et al. 1998 and references therein);
-
(c)
deriving the precise metal abundance of these clusters is a key task in establishing the universality of the vs [Fe/H] relation (or, more dramatically, its violation) for RR Lyraes, one of the best Population II standard candles (Sandage 2006);
-
(d)
photometric evidences already show that a large metallicity spread is not consistent with the CMD features in both these clusters (Raimondo et al. 2002); previous spectroscopic analyses in NGC 6441 (high resolution spectra of giants, Paper III; low resolution spectroscopy of RR Lyraes, Clementini et al. 2006) and in NGC 6388 (high-resolution spectra of hot HB stars, Moehler and Sweigart 2006a) also show no evidence for any deviation in metallicity from the cluster. Nevertheless, it is necessary to assess with homogeneous analysis if a real metallicity spread can be firmly excluded also in NGC 6388;
-
(e)
finally, both NGC 6388 and NGC 6441 have the highest predicted escape velocity at cluster center among 153 resolved star clusters in the Milky Way, the Magellanic Clouds and the Fornax dSph galaxy (McLaughlin and Van der Marel 2006), more than 3 away of the average velocity of the other Galactic GCs, including the most massive ones. This implies that they are very tightly bound (as they must, having survived almost an Hubble time likely very close to the bulge of the Galaxy). In turn, we could have the chance of observing a clear signature of the predicted (e.g. Cayrel 1986) and long searched for, self-enrichment: perhaps these GCs were able to efficiently retain at least part of the metal-enriched ejecta of core-collapse Supernovae. However, we must note that a deep search for neutral hydrogen emission at 21 cm (Lynch et al. 1989), only resulted in an upper limit of .
Thus, as done with the companion cluster NGC 6441 (Paper III), we used the high resolution spectra provided by the fiber-fed UVES spectrograph, exploiting the large spectral coverage to derive the detailed chemical composition of NGC 6388.
The present paper is organized as follows: an outline of the observations and target selection is given in Sect. 2; the analysis, including the derivation of the atmospheric parameters and metallicities, is described in Sect. 3, whereas in Sect. 4 we discuss the error budget of our abundance analysis. Abundances of various elements are presented in Sect. 5; finally, Sect. 6 provides a summary of the study.
2 Target selection, observations and membership
Our data were collected in Service mode with the ESO high resolution multifiber spectrograph FLAMES (Pasquini et al. 2002) mounted on VLT. The UVES Red Arm provided a wavelength coverage from 4800 to 6800 Å with a resolution R. The observations required to reach the necessary S/N were done over a period of several nights.
We used two fiber configurations in order to maximize the number of possible targets observed with the dedicated fibers feeding the UVES spectrograph. In the first configuration (8 exposures), seven stars were observed, with one fiber pointing to the sky; in the second set (10 exposures), we observed six stars, with two fibers dedicated to the sky. In Table 1 we list all the relevant informations.
The target selection followed the same criteria of the previous GCs; we chose stars near the RGB ridge line and isolated111All stars were chosen to be free from any companion brighter than mag within a 2.5 arcsec radius, or brighter than mag within 10 arcsec, where is the target magnitude.. No previous studies about membership (either based on spectroscopy or on proper motions) were available. Moreover, the constraints imposed by mechanical limitations in the Oz-Poz fiber positioner for FLAMES and the size on the sky of this rather concentrated cluster forced us to observe stars at some distance from the center, increasing the risk to include field interlopers.
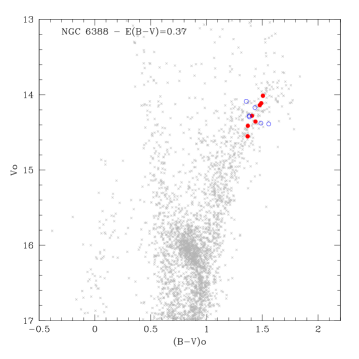
Another problem in the selection is due to the differential reddening affecting NGC 6388, which spreads the width of the RGB. The combination of technical limitations in the fiber positioning, spread of sequences and limited number of bright stars made difficult to restrict the observed sample only to objects very close to the RGB ridge line. Stars observed with UVES are indicated by large circles in Figure 1, whereas in Table 2 all targets are listed. Star designations, optical magnitudes and coordinates (J2000 equinox) are from Momany et al. (2003); heliocentric radial velocities are those derived from our spectra (see below).
| Fiber | Date | UTbeginning | exptime | airmass |
|---|---|---|---|---|
| config. | ||||
| 1 | 2004-05-04 | 04:19:33 | 4000 | 1.36 |
| 1 | 2004-05-04 | 05:29:35 | 4200 | 1.17 |
| 1 | 2004-05-04 | 06:50:30 | 4000 | 1.07 |
| 1 | 2004-05-11 | 08:51:04 | 4000 | 1.15 |
| 1 | 2004-05-11 | 08:02:24 | 2700 | 1.09 |
| 1 | 2004-05-12 | 05:12:58 | 4500 | 1.14 |
| 1 | 2004-06-28 | 04:38:20 | 4000 | 1.08 |
| 1 | 2004-07-11 | 00:43:11 | 4000 | 1.21 |
| 2 | 2004-07-21 | 00:21:10 | 4200 | 1.07 |
| 2 | 2004-07-21 | 02:33:15 | 4000 | 1.09 |
| 2 | 2004-07-21 | 03:42:17 | 4000 | 1.11 |
| 2 | 2004-07-25 | 00:28:49 | 4000 | 1.13 |
| 2 | 2004-07-25 | 01:40:20 | 4200 | 1.17 |
| 2 | 2004-07-25 | 03:23:53 | 4000 | 1.11 |
| 2 | 2004-07-25 | 04:32:19 | 4000 | 1.36 |
| 2 | 2004-07-26 | 00:14:10 | 4000 | 1.15 |
| 2 | 2004-07-26 | 01:23:07 | 4000 | 1.08 |
| 2 | 2004-07-26 | 02:41:49 | 2700 | 1.08 |
Photometry and astrometry
We used high quality photometry obtained with the Wide Field Imager at the 2.2 m ESO/MPI telescope in La Silla (ESO Programme 69.D-0582). The optical camera WFI is a mosaic of eight CCD chips, each with a field of view of , for a total field of view of . The cluster center was roughly centered on chip #7, and the images were taken through the , and broad band filters with typical exposure times of 120 sec, 90 sec and 50 sec, respectively. The average seeing was good and stable (full width half maximum FWHM).
The photometric reduction and calibration methods are well-tested and have been presented in Momany et al. (2002). In particular, NGC 6388 belongs to the 69.D-0582 observing run from which wide field photometry for other globular clusters have been published (Momany et al. 2003). In the following we provide a description of the photometric and astrometric calibration. Stellar photometry was performed using the standard DAOPHOT II and ALLFRAME programs (Stetson 1994). In crowded fields such as that surrounding NGC 6388, these programs provide high quality stellar photometry by point spread function (PSF) fitting. The single PSFs were constructed for each image after a careful selection of isolated and well-distributed stars across each chip.
The instrumental PSF magnitudes of NGC 6388 were normalized to 1 s exposure and zero airmass; they were further corrected for the aperture correction, necessary to convert the instrumental PSF magnitudes of NGC 6388 to the scale of the standard star measurements (based on aperture photometry, see below). The instrumental NGC 6388 magnitudes are therefore:
| (1) |
where , is the airmass of the reference image for each filter, and the adopted mean extinction coefficients for La Silla are: , and .
The aperture corrections were estimated on isolated bright stars, evenly distributed across the chip. For these we obtained aperture photometry after subtracting any nearby companions within 5 FWHMs. The aperture magnitudes measured in circular apertures of radius 6 arcsecond (close to the photoelectric aperture employed by Landolt 1992) were then compared to the PSF magnitudes, and the difference is assumed to be the aperture correction to apply to the PSF magnitudes.
Separately, aperture magnitudes of standard stars from 3 Landolt (1992) fields were measured in circular apertures of 6 arcsecond in radius. These aperture magnitudes were normalized to their corresponding airmasses and exposure times, and compared with those tabulated in Landolt (1992). A least square fitting procedure provided the calibration relations.
The scatter of the residuals of the fit (, and ) are assumed to represent our calibration uncertainties in , and respectively.
The total zero-point uncertainties, including the aperture corrections and calibration errors, are , , and mag in , and respectively. The PSF photometry of NGC 6388 (normalized and corrected for aperture correction) was then calibrated using the relations:
| (2) |
| (3) |
| (4) |
| (5) |
The USNO CCD Astrograph all-sky (UCAC2) Catalog (Zacharias et al. 2004) was used to search for astrometric standards in the entire WFI image field of view. Several hundred astrometric UCAC2 reference stars were found in each chip, allowing an accurate absolute positioning of the sources. An astrometric solution has been obtained for each of the eight WFI chips independently, by using suitable catalog matching and cross-correlation IRAF222 IRAF is distributed by the National Optical Astronomical Observatory, which are operated by the Association of Universities for Research in Astronomy, under contract with the National Science Foundation tools. At the end of the entire procedure, the rms residuals are 2 both in right ascension and declination.
| Star | conf. | RA | Dec | RV,hel. | Notes | |||||
|---|---|---|---|---|---|---|---|---|---|---|
| 77599 | 1 | 17 35 53.602 | -44 48 15.84 | 15.653 | 17.424 | 13.805 | 12.496 | 11.415 | +76.09 | M |
| 78569 | 1 | 17 35 24.770 | -44 47 18.58 | 15.328 | 17.085 | 13.438 | 12.188 | 11.153 | 91.30 | NM |
| 82375 | 1 | 17 35 21.046 | -44 43 41.58 | 15.522 | 17.305 | 13.595 | 12.324 | 11.291 | 12.07 | NM |
| 83168 | 2 | 17 35 53.715 | -44 42 56.02 | 15.793 | 17.562 | 13.948 | 12.581 | 11.541 | +79.26 | M |
| 85915 | 2 | 17 35 49.560 | -44 39 59.65 | 15.618 | 17.506 | 13.355 | 11.875 | 10.650 | 44.61 | NM |
| 86759 | 2 | 17 35 28.083 | -44 39 04.95 | 15.629 | 17.587 | 12.972 | 11.356 | 10.090 | 143.82 | NM |
| 101131 | 1 | 17 36 02.227 | -44 44 32.75 | 15.379 | 17.257 | 13.322 | 11.877 | 10.608 | +74.30 | M |
| 108176 | 2 | 17 36 12.797 | -44 41 50.60 | 15.254 | 17.160 | 12.975 | 11.472 | 10.223 | +79.28 | M |
| 108895 | 1 | 17 36 15.184 | -44 41 27.20 | 15.596 | 17.435 | 13.527 | 12.062 | 10.918 | +80.19 | M |
| 110677 | 1 | 17 36 28.549 | -44 40 09.49 | 15.520 | 17.328 | 13.518 | 12.185 | 10.962 | +82.68 | M |
| 110754 | 2 | 17 36 30.374 | -44 40 04.60 | 15.533 | 17.318 | 13.479 | 12.113 | 10.971 | 156.28 | NM |
| 111408 | 1 | 17 36 06.921 | -44 39 29.10 | 15.353 | 17.244 | 13.204 | 11.751 | 10.519 | +82.10 | M |
| 111970 | 2 | 17 36 04.630 | -44 38 54.64 | 15.411 | 17.245 | 13.254 | 11.825 | 10.480 | 54.21 | NM |
Preparation of spectra and membership
The spectra were reduced to 1-d, wavelength calibrated files by the ESO Service mode personnel using the UVES-FLAMES pipeline (uves/2.1.1 version).
We measured radial velocities (RVs) for each individual spectrum using about 80 atomic lines with the IRAF package Rvidlines. The resulting heliocentric RVs are shown in Table 2; the associated errors are typically a few hundreds of m/s.
The spectra were then shifted to zero radial velocity and co-added for each star. Final S/N values of the combined exposures range from 40 to 80 per pixel and were estimated in the spectral region near 5000 Å.
At variance with the case of NGC 6441 (Paper III), the determination of membership for stars in NGC 6388 was relatively straightforward. This cluster has an average radial velocity of +81.2 km s-1 (Harris 1996), and it lies in a region of the Galactic bulge where the bulk of contaminating field stars have (according to our extensive spectroscopic observations) a negative radial velocity.

In Figure 2 we show the heliocentric RV distribution of all the stars observed with UVES (shaded area) in the present study and with GIRAFFE, to investigate on the Na-O anticorrelation in NGC 6388 (Carretta et al. 2006d, in preparation). Stars in NGC 6388 stand out as a very neatly defined peak, whereas field stars are recognizable as a broad distribution peaked at about -50 km s-1; therefore, we could easily discriminate the true cluster members. The membership of our program stars with UVES spectra is indicated in Table 2: we observed five cluster stars in the first fiber configuration and only two in the second configuration. The non member stars were disregarded from further analysis. The average heliocentric RV derived from the final sample of seven stars in NGC 6388 is +79.1 (rms=3.0) km s-1, in good agreement with the tabulated value of Harris (1996).
3 Atmospheric parameters, analysis and metallicity
3.1 Atmospheric parameters
Temperatures and gravities were derived following the tested procedure adopted in previous papers of this series. We started obtaining ’s and bolometric corrections B.C. for our seven stars in NGC 6388 from colors; these were the combination of our magnitudes and the magnitudes from the 2MASS Point Source Catalogue (Skrutskie et al. 2006), transformed to the TCS photometric system, as used in Alonso et al. (1999). We employed the relations by Alonso et al. (1999, with the erratum of 2001). We adopted for NGC 6388 a distance modulus of =16.14, a reddening of = 0.37, an input metallicity of [Fe/H] (Harris 1996), and the relations , , and (Cardelli et al. 1989).
However, our finally adopted ’s were derived using a calibration between from dereddened colors and magnitudes based on 33 cluster star members (Carretta et al. 2006d). As discussed in Paper II and Paper V, this procedure was adopted in order to decrease the scatter in abundances due to uncertainties in temperatures, since magnitudes are much more reliably measured than colors. The choice of magnitudes is particularly well suited for GCs where a significant differential reddening is present (cfr. Paper III and IV).
Surface gravities log ’s were obtained from the apparent magnitudes, the above effective temperatures and distance modulus, and the B.C’s from Alonso et al. (1999), assuming masses of 0.90 M⊙ and as the bolometric magnitude for the Sun. Along with the derived atmospheric parameters (model metal abundance and microturbulent velocities) and iron abundances, they are shown in Table 4.
3.2 Equivalent widths and iron abundances
Line lists, atomic parameters and reference solar abundances are from Gratton et al. (2003). We used the same procedure of previous papers, described in details in Bragaglia et al. (2001), to measure equivalent widths (s) with the ROSA code (Gratton 1988; see Table 3, only available in electronic form).
| El. | E.P. | 77599 | 83168 | 101131 | 108176 | 108895 | 110677 | 111408 | ||
| EW | EW | EW | EW | EW | EW | EW | ||||
| (Å) | (eV) | (mÅ) | (mÅ) | (mÅ) | (mÅ) | (mÅ) | (mÅ) | (mÅ) | ||
| O i | 6300.31 | 0.00 | -9.75 | 31.6 | 36.9 | 30.8 | 50.4 | 35.9 | 58.2 | 56.0 |
| O i | 6363.79 | 0.02 | -10.25 | 16.3 | 20.4 | 12.2 | 29.0 | 14.5 | 27.6 | 34.1 |
| Na i | 5682.65 | 2.10 | -0.67 | 192.4 | 185.1 | 211.0 | 189.7 | 191.3 | 0.0 | 190.6 |
| Na i | 5688.22 | 2.10 | -0.37 | 188.0 | 179.4 | 204.7 | 0.0 | 184.4 | 175.9 | 192.2 |
| Na i | 6154.23 | 2.10 | -1.57 | 145.0 | 125.0 | 146.0 | 128.7 | 113.0 | 108.0 | 139.1 |
| Na i | 6160.75 | 2.10 | -1.26 | 163.0 | 136.0 | 154.2 | 138.0 | 133.2 | 125.0 | 145.8 |
| Mg i | 5528.42 | 4.34 | -0.52 | 249.8 | 238.6 | 249.0 | 250.1 | 256.3 | 243.5 | 247.7 |
| Mg i | 5711.09 | 4.34 | -1.73 | 139.4 | 146.4 | 0.0 | 139.2 | 0.0 | 0.0 | 0.0 |
Final metallicities are obtained with standard line analysis from measured s and interpolating within the Kurucz (1993) grid of model atmospheres (with the option for overshooting on) the model with the proper atmospheric parameters whose abundance matches that derived from Fe i lines.
Microturbulence velocities were derived by eliminating trends between abundances from neutral Fe lines and expected line strength (see Magain 1984); with this approach we avoid introducing spurious (positive) trends due to systematic errors associated to the measure of observed s.
Average abundances of iron for NGC 6388 are [Fe/H]i= (rms=0.04 dex) and [Fe/H]ii= (rms=0.09 dex) from 7 stars. This difference (on average 0.07 dex with an rms=0.10 dex) is scarcely significant, and the good agreement between abundances from neutral and singly ionized Fe lines indicates a self-consistent analysis.
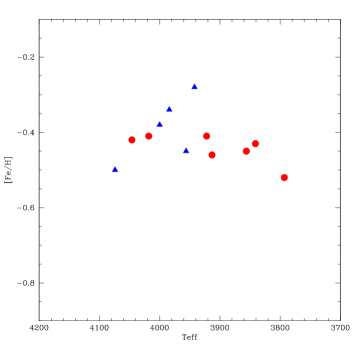
There is no significant trend of iron abundance as a function of the temperatures, as shown in Figure 3, where we display the [Fe/H] ratios for stars observed with UVES in NGC 6388 and, as a comparison, in NGC 6441 (Paper III).
The (small) scatter of the metallicity distribution is discussed below.
| Star | Teff | [A/H] | nr | [Fe/H]i | nr | [Fe/Hii | ||||
|---|---|---|---|---|---|---|---|---|---|---|
| (K) | (dex) | (dex) | (km s-1) | (dex) | (dex) | |||||
| 77599 | 4018 | 1.37 | 0.40 | 1.66 | 79 | 0.41 | 0.16 | 6 | 0.36 | 0.15 |
| 83168 | 4046 | 1.42 | 0.41 | 1.75 | 97 | 0.42 | 0.16 | 9 | 0.43 | 0.15 |
| 101131 | 3856 | 1.02 | 0.46 | 1.68 | 89 | 0.45 | 0.17 | 8 | 0.53 | 0.26 |
| 108176 | 3793 | 0.85 | 0.52 | 1.50 | 79 | 0.51 | 0.18 | 7 | 0.28 | 0.13 |
| 108895 | 3913 | 1.15 | 0.45 | 1.65 | 100 | 0.46 | 0.17 | 10 | 0.33 | 0.18 |
| 110677 | 3922 | 1.17 | 0.42 | 1.57 | 90 | 0.41 | 0.18 | 9 | 0.29 | 0.15 |
| 111408 | 3841 | 0.98 | 0.43 | 1.57 | 91 | 0.42 | 0.19 | 7 | 0.36 | 0.07 |
| Element | Average | Teff | [A/H] | EWs | Total | Total | ||
|---|---|---|---|---|---|---|---|---|
| n. lines | (K) | (dex) | (dex) | kms-1 | (dex) | Internal | Systematic | |
| Variation | 50 | 0.20 | 0.10 | 0.10 | ||||
| Internal | 6 | 0.04 | 0.00 | 0.07 | 0.170 | |||
| Systematic | 57 | 0.06 | 0.01 | 0.03 | 0.170 | |||
| Fe/Hi | 89 | 0.009 | +0.039 | +0.027 | 0.049 | +0.018 | 0.040 | 0.028 |
| Fe/Hii | 8 | 0.101 | +0.122 | +0.044 | 0.036 | +0.060 | 0.071 | 0.135 |
| O/Fei | 2 | +0.025 | +0.042 | +0.013 | +0.046 | +0.120 | 0.125 | 0.125 |
| Na/Fei | 4 | +0.054 | 0.065 | 0.019 | +0.011 | +0.085 | 0.087 | 0.107 |
| Mg/Fei | 3 | 0.002 | 0.031 | 0.005 | +0.032 | +0.098 | 0.101 | 0.099 |
| Al/Fei | 2 | +0.043 | 0.036 | 0.024 | +0.008 | +0.120 | 0.121 | 0.130 |
| Si/Fei | 5 | 0.046 | +0.023 | 0.003 | +0.031 | +0.076 | 0.079 | 0.093 |
| Ca/Fei | 14 | +0.063 | 0.070 | 0.015 | 0.012 | +0.045 | 0.049 | 0.088 |
| Sc/Feii | 6 | 0.008 | +0.045 | +0.008 | 0.007 | +0.069 | 0.070 | 0.071 |
| Ti/Fei | 16 | +0.089 | 0.042 | 0.010 | 0.036 | +0.043 | 0.051 | 0.111 |
| Ti/Feii | 5 | 0.021 | +0.044 | +0.008 | 0.001 | +0.076 | 0.077 | 0.081 |
| V/Fei | 9 | +0.092 | 0.044 | 0.004 | 0.021 | +0.057 | 0.062 | 0.120 |
| Cr/Fei | 14 | +0.057 | 0.041 | 0.015 | 0.001 | +0.045 | 0.047 | 0.080 |
| Mn/Fei | 2 | +0.037 | 0.039 | +0.001 | +0.022 | +0.120 | 0.122 | 0.128 |
| Co/Fei | 4 | 0.005 | +0.013 | 0.005 | +0.002 | +0.085 | 0.085 | 0.085 |
| Ni/Fei | 27 | 0.010 | +0.017 | +0.000 | +0.004 | +0.033 | 0.022 | 0.035 |
| Y/Fei | 2 | +0.104 | 0.025 | 0.019 | +0.016 | +0.120 | 0.121 | 0.169 |
| Zr/Fei | 6 | +0.088 | 0.011 | 0.013 | 0.001 | +0.069 | 0.070 | 0.122 |
| Zr/Feii | 1 | +0.079 | 0.034 | 0.006 | +0.027 | +0.170 | 0.171 | 0.193 |
| Ba/Feii | 2 | +0.017 | +0.022 | +0.015 | 0.045 | +0.120 | 0.124 | 0.123 |
| La/Feii | 3 | +0.116 | 0.038 | 0.007 | 0.008 | +0.098 | 0.100 | 0.165 |
| Ce/Feii | 1 | +0.107 | 0.044 | 0.007 | +0.017 | +0.170 | 0.171 | 0.210 |
| Eu/Feii | 2 | +0.095 | 0.040 | 0.007 | +0.010 | +0.120 | 0.121 | 0.162 |
4 Errors in the atmospheric parameters and cosmic scatter in Iron
Following the tested procedure of previous papers, discussed in detail in Paper V on the twin-cluster NGC 6441, similarly affected by problems of differential reddening, we estimated individual (i.e. star-to-star) errors in the derived abundances by considering the three main error sources, i.e. errors in temperatures, in microturbulent velocities and in the measurements of s (the effects of errors in surface gravities and in the adopted model metallicity are negligible on the total error budget).
We started by evaluating the sensitivity of the derived abundances on the adopted atmospheric parameters. This was obtained by re-iterating the analysis while varying each time only one of the parameters for the star 108895, assumed as representative of our program stars; the results are listed in Table 5. In this Table, the first row shows the amount of the variations in the parameters, the second and third rows list the estimated star-to-star (internal) and systematic errors (that apply to the whole cluster) in each parameters. The resulting sensitivities of abundances to variations in each parameter are shown below, Columns from 3 to 6; in Column 2 we report the average (over all the stars analyzed) number of lines used for each element.
The next step is to derive realistic estimates of internal and systematic errors in the atmospheric parameters and in measured s.
Internal errors
In the following we will concentrate on the major error sources quoted above.
Errors in temperatures.
We adopted an internal error of 0.03 mag in magnitudes (from the mean photometric uncertainties displayed on the 2MASS web site) and errors due to the variable interstellar reddening across the cluster. According to Pritzl et al. (2002) the rms associated to is about 0.03 mag, leading to a contribution of 0.012 mag on , since A. In summary, the errors in should not exceed 0.032 mag. When combined with the slope of the adopted relation between Teff and magnitude of about 192 K/mag, the internal error in Teff is estimated to be about 6 K.
Errors in microturbulent velocities.
We repeated the analysis for star 101131 by changing until the 1 value333This value was derived as the quadratic mean of the 1 errors in the slope of the relation between abundance and expected line strength for all stars. from the original slope of the relation between line strengths and abundances was reached; the corresponding internal error in microturbulent velocities is 0.07 km s-1.
Errors in measurement of equivalent widths.
In order to estimate this contribution, we assumed that the average rms scatter (0.170 dex) in Fe i abundance for our stars is the typical error in abundance derived from an individual line. When divided by the square root of the typical average number of measured lines (89), this provides a typical internal error of 0.018 dex as the contribution to the error due to uncertainties in measurement for individual lines.
Once the internal errors are combined with sensitivities of Table 5, the derived individual star errors for Fe amount to 0.001 dex and 0.034 dex due to the quoted uncertainties in Teff and .
Adding in quadrature the contribution due to errors in s we may evaluate the expected scatter in [Fe/H] due to the most relevant uncertainties in the analysis. We derive (exp.)= dex (statistical error). The inclusion of contributions due to uncertainties in surface gravity or model metallicity (that results in the values reported in Table 5, Column 8) does not alter our conclusions.
Total internal and systematic errors are reported in Table 5 in Cols. 8 and 9 respectively, for iron and the other elements analyzed. They are obtained by summing quadratically the contributions of the individual sources of errors, scaled according to the proper estimates of the real amount of errors in NGC 6388444For the systematic errors, the contribution due to s and (quantities derived from our own analysis) were weighted by dividing by the square root of number of stars observed in NGC 6388. We neglected the effects of covariances between the error sources; these effects are expected to be very small for our program stars.
On the other hand, the observed star-to-star scatter in NGC 6388 is virtually the same of the estimated internal error; we have (obs.)= (statistical error), obtained as the rms scatter of abundances from Fe i lines. The conclusion from our dataset of high resolution spectra is that the observed star-to-star rms scatter in Fe abundances in NGC 6388 is no more than 9%, it is fully compatible with the major error sources entering in the abundance analysis, suggesting to exclude any intrinsic metallicity spread in this cluster. We will return on this issue with the analysis of the GIRAFFE/FLAMES data (Carretta et al. 2006, in preparation).
Systematic errors
They are not relevant within a single cluster, but could be used when comparing different GCs, as in the present project.
Briefly, errors in the adopted reddening translate into systematic errors in derived temperatures, since we adopted a relation between temperatures and magnitude , based on turn on from dereddened , through the calibrations by Alonso et al. When combined with the slope K/mag of the vs relation, the adopted error of about 0.03 mag in results into a systematic uncertainty of K for the cluster, increasing to K if we add in quadrature another contribution of 0.02 mag error in the zero point of the color.
Errors in surface gravity might be obtained by propagating uncertainties in distance modulus (about 0.1 mag), stellar mass (a conservative 10%) and the above error of 57 K in effective temperature. The quadratic sum results into a 0.062 dex of error in . The systematic error relative to the microturbulent velocity , a quantity derived from our own analysis, was divided by the square root of the number of the observed stars, and is estimated in 0.026 km/s.
By using again sensitivities in Table 5, these contributions of systematic errors in , and can be translated in errors in the metallicity. Adding in quadrature the statistical error of individual abundance determinations, 0.014 dex, we end up with a total systematic error of 0.025 dex.
Hence, we conclude that on the scale we are defining throughout this series of papers, the metal abundance of NGC 6388 is [Fe/H] dex, where the first error bar refers to the individual star-to-star errors and the second one is relative to the cluster (or systematic) error.
A note about scale errors
Scale errors are difficult to be estimated properly, and they are certainly much larger than the individual (internal) star and cluster (systematic) errors mentioned above. There are various reasons for significant scale errors, including systematic measurement errors (e.g. inappropriate location of the reference continuum level, or line fitting), in the abundance analysis (damping parameters), uncertainties in the adopted temperature scale (the Alonso et al. scale), in the modeling of the stellar atmospheres (we are using 1-d Kurucz models, which neglect e.g. horizontal inhomogeneities in stellar atmospheres and cooling of the outer layers due to adiabatic expansion), and possible non-LTE effects in the formation of Fe lines. All these errors are likely to be quite similar in all stars considered in this series of paper, possibly with some trends with luminosity, temperature or metal abundance. We think that a full estimate of these uncertainties is not needed here, insofar we refer our metal abundances to our own scale. However, when transforming our [Fe/H] values in absolute abundances, as those e.g. required for modeling of stellar evolution, the possibility of significant errors should be kept in mind.
We will examine this issue in more detail when data from the whole sample of clusters will have been analyzed.
5 Other elements
Abundances for other elements measured in NGC 6388 are listed in Table 6 to Table 11. For each element in individual stars we give the number of lines used, the average abundance and the rms scatter of individual values. In Table 12 we give the average abundances for the cluster, as well as the rms scatter of individual values around the mean value (columns 2 and 3). In columns 4 and 5 of this Table we report the analogous values derived in Paper III for the twin cluster NGC 6441 from high resolution UVES-FLAMES spectra. In the other columns of this Table we list as a comparison the abundance ratios for two other bulge clusters studied by our group (NGC 6528, Carretta et al. 2001; NGC 6553, Cohen et al. 1999), as well as for the metal-rich cluster Ter 7 considered part of the Sgr dwarf galaxy (Sbordone et al. 2005, Tautvaisiene et al. 2004). Whenever possible (e.g. for NGC 6528, NGC 6553 and the analysis by Sbordone et al.) element ratios have been recomputed by using the set of solar reference abundances used in the present work (see Gratton et al. 2003).
5.1 The proton-capture elements
In Table 6 we summarize the abundances for the elements involved in proton-capture reactions at high temperature (see Gratton et al. 2004 for a review) in NGC 6388.
Abundances of O, Na, Mg and Al rest on measured s. The derived Na abundances were corrected for effects of departures from the LTE assumption using the prescriptions by Gratton et al. (1999).
| Star | n | [O/Fe] | rms | n | [Na/Fe] | rms | n | [Mg/Fe] | rms | n | [Al/Fe] | rms |
|---|---|---|---|---|---|---|---|---|---|---|---|---|
| (dex) | (dex) | (dex) | (dex) | |||||||||
| 77599 | 2 | 0.33 | 0.14 | 4 | +0.71 | 0.25 | 2 | +0.16 | 0.02 | 2 | +0.98 | 0.12 |
| 83168 | 2 | 0.20 | 0.16 | 4 | +0.49 | 0.18 | 3 | +0.16 | 0.08 | 2 | +0.74 | 0.02 |
| 101131 | 2 | 0.58 | 0.05 | 4 | +0.76 | 0.17 | 3 | +0.18 | 0.01 | 2 | +0.87 | 0.24 |
| 108176 | 2 | 0.26 | 0.14 | 3 | +0.72 | 0.12 | 3 | +0.34 | 0.04 | 2 | +0.55 | 0.15 |
| 108895 | 2 | 0.42 | 0.05 | 4 | +0.50 | 0.16 | 3 | +0.19 | 0.05 | 2 | +0.68 | 0.14 |
| 110677 | 2 | 0.12 | 0.06 | 3 | +0.34 | 0.09 | 2 | +0.18 | 0.03 | 2 | +0.23 | 0.01 |
| 111408 | 2 | 0.17 | 0.16 | 4 | +0.66 | 0.16 | 2 | +0.24 | 0.06 | 2 | +0.77 | 0.12 |
Oxygen abundances are obtained from the forbidden [O i] lines at 6300.3 and 6363.8 Å; the former was cleaned from telluric contamination by H2O and O2 lines using a synthetic template (see Paper I for more details). Neither CO formation nor the high excitation Ni i line at 6300.34 Å are a source of concern: as discussed in Paper III, the corrections due to neglecting CO formation in these stars and to the (small) contribution of the blending Ni i line are of the order of about 0.05 dex and they roughly compensate with each other, being of opposite signs.
From Table 12 we note that the rms scatter of the average abundance is generally in good agreement with those estimated by the error analysis in Sect. 4, apart from cases where the observed scatter is large due to the small number of available lines. However, the observed scatter for proton-capture elements is clearly exceeding the predicted observational errors, apart from the case of Mg, indicating that an intrinsic scatter is present in these abundance ratios.
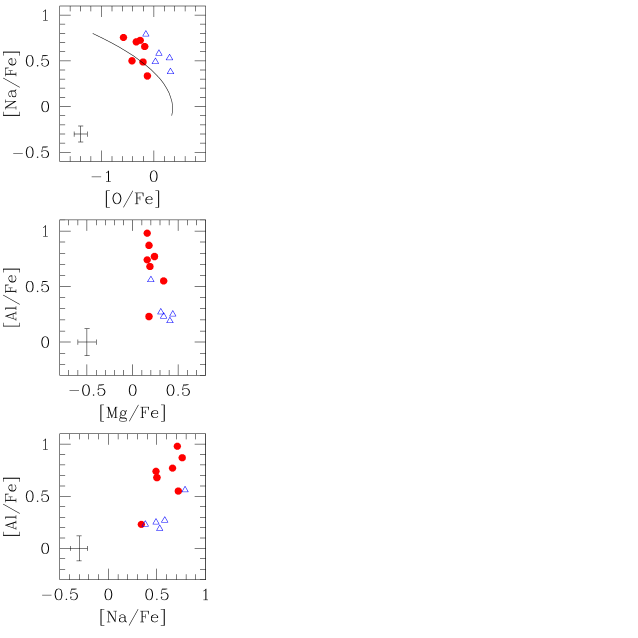
The [Na/Fe] ratio as a function of [O/Fe] ratio is displayed in the upper panel of Figure 4 for the seven stars observed with UVES in NGC 6388 (filled circles) and, as a comparison, for the five stars in NGC 6441 from similar data (Paper III, empty triangles). The overall random error in O and Na as due to the contribution of errors in the adopted atmospheric parameters and measurements of s in the present paper is also shown.
The curve in Figure 4 (from Fig. 5 of Carretta et al. 2006a) represents the typical pattern of the Na-O anticorrelation in globular clusters, as defined on NGC 2808 and found generally appropriate for GCs from a collection of about 400 stars in almost 20 GCs. Although the sample based on high-resolution UVES spectra is limited, we may conclude that stars in NGC 6388 participate to the classical Na-O anticorrelation, as already found also for giants in the twin cluster NGC 6441. The Na-O anticorrelation will be studied in details separately, from a more extended sample based on Giraffe spectra in NGC 6388.
In the middle and lower panels of Figure 4 we show the Al-Mg anticorrelation and the Na-Al correlation in NGC 6388, as compared to the ones in NGC 6441 (symbols are the same as in previous panels). Both these features are predicted to set up as a consequence of H-burning at high temperatures involving the NeNa and MgAl cycles. The small spread observed in [Mg/Fe] is not surprising: as discussed in Carretta et al. (2004), there is evidence suggesting that the MgAl cycle could be less efficient in metal-rich clusters like 47 Tuc and M 71. Our findings for NGC 6388 and NGC 6441 seem to support this view.
On the other hand, the spread observed in Al is quite robustly established, and it is a clearcut evidence of the presence (although limited) of products of proton-captures in the MgAl cycle. The fraction of Al-rich and Al-poor stars seems to be reversed in NGC 6388 and NGC 6441: the former has mostly stars in the first group, whereas the majority of stars in NGC 6441 show only a moderate Al-enhancement. Admittedly, the statistics is small, but this sort of dichotomy in the Na-Al correlation was already noticed by Carretta (2006; his Fig. 4), using more extended samples of RGB stars in several GCs.
5.2 elements
Abundances of elements from processes in stars of NGC 6388 are listed in Table 7.
| Star | n | [Si/Fe]i | rms | n | [Ca/Fe]i | rms | n | [Ti/Fe]i | rms | n | [Ti/Fe]ii | rms |
|---|---|---|---|---|---|---|---|---|---|---|---|---|
| (dex) | (dex) | (dex) | (dex) | |||||||||
| 77599 | 4 | +0.34 | 0.12 | 14 | +0.14 | 0.26 | 15 | +0.38 | 0.16 | 6 | +0.46 | 0.31 |
| 83168 | 7 | +0.37 | 0.21 | 14 | 0.05 | 0.19 | 15 | +0.24 | 0.17 | 4 | +0.19 | 0.27 |
| 101131 | 6 | +0.42 | 0.14 | 13 | +0.10 | 0.16 | 18 | +0.41 | 0.15 | 5 | +0.18 | 0.25 |
| 108176 | 4 | +0.21 | 0.15 | 13 | +0.10 | 0.20 | 15 | +0.54 | 0.14 | 5 | +0.22 | 0.16 |
| 108895 | 6 | +0.25 | 0.15 | 18 | +0.04 | 0.19 | 17 | +0.34 | 0.18 | 6 | +0.26 | 0.28 |
| 110677 | 4 | +0.46 | 0.09 | 13 | +0.04 | 0.20 | 16 | +0.27 | 0.17 | 5 | +0.36 | 0.25 |
| 111408 | 6 | +0.21 | 0.18 | 15 | +0.08 | 0.18 | 19 | +0.39 | 0.17 | 5 | +0.43 | 0.19 |
Apart from Ca, the elements ratios of the elements (Mg, Si, Ti i and ii) show a clear overabundance with respect to the solar values. For Ca we obtain low abundances, as in Paper III for NGC 6441; however, as discussed in that paper, this value might not be representative of the real Ca abundance; it might be an artifact of the analysis, due to the rather cool temperature of stars analyzed (see Paper III).
The difference for abundances of Ti derived from neutral and singly ionized lines (the latter not available in NGC 6441 where we restricted the analysis to lines measured in the redder part of the UVES spectra) allows us to further check the reliability of the adopted parameters. On average, we found that [Ti/Fe]ii[Ti/Fe]i with dex. This slight difference is not significant, supporting the goodness of the analysis.
An extensive set of abundances of elements obtained with an homogeneous and self consistent procedure permits to check the scenario where dense objects may retain the ejecta of core collapse supernovae and maintain an independent chemical evolution resulting in self-enrichment. At present we have available a comparison set made of i) field stars analyzed by Gratton et al. (2003b) with the same line parameters and solar reference abundances used in the present series; ii) the field, presumably bulge, stars analyzed in Paper III; iii) a thick disk globular cluster (47 Tuc, [Fe/H] dex), studied with the same approach by Carretta et al. (2004); iv) two moderately metal-rich bulge clusters (NGC 6388 and NGC 6441, [Fe/H] and dex, respectively from the present work and Paper III); v) and finally two bulge clusters at metallicity near or above solar (NGC 6528, [Fe/H]= dex, from Carretta et al. 2001, and NGC 6553, [Fe/H] dex, from Cohen et al. 1999, as revised in Carretta et al. 2001). For the two latter clusters, the element ratios of the original papers were corrected here for the different solar reference abundances adopted.
The metallicity range spanned by these clusters is the best suited for this test, since studies of field stars show that a significant contribution by type Ia SNe is noticeable already at [Fe/H] dex, lowering the [/Fe] ratio. We could then expect that for metallicities larger than this limit, GCs present an higher -element content if some degree of self-enrichment does exist (see also discussion and references in Carretta et al. 2004).
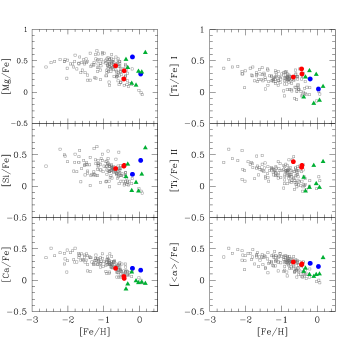
A hint that this is what’s really happening seems to come from Figure 5, where we superimposed the average abundance ratios of all analyzed -elements in these GCs to field stars. The average ratio [(Mg+Si+Ca+Ti)/Fe] is also shown in the bottom-right panel. More observations are needed to firmly decide whether a real difference does exist; however, the impression is that for several elements (Si, Ti i and ii and for the average ) the position of the GCs is near the upper envelope of the field distribution. Moreover, the differences between clusters and field stars seem to increase as the metallicity increases (see the behavior of NGC 6553 and NGC 6528). This is what we expect if the efficiency of clusters in retaining ejecta of core-collapse SNe is approximatively constant, whereas the increased contribution of type Ia SNe is decreasing more and more the [/Fe] ratio in the less dense field environment.
5.3 Fe-group elements
Abundances of elements of the Fe-group are reported in Tables 8 and 9. We measured lines of Sc ii, V i, Cr i, Mn i, Co i and Ni i. Corrections due to the hyperfine structure were applied in the relevant cases (Sc, V, Mn, Co; see Gratton et al. 2003a for details).
| Star | n | [Sc/Fe]ii | rms | n | [V/Fe]i | rms | n | [Cr/Fe]i | rms | n | [Mn/Fe]i | rms |
|---|---|---|---|---|---|---|---|---|---|---|---|---|
| (dex) | (dex) | (dex) | (dex) | |||||||||
| 77599 | 3 | +0.06 | 0.22 | 8 | +0.24 | 0.21 | 12 | +0.04 | 0.30 | 4 | 0.23 | 0.17 |
| 83168 | 6 | +0.13 | 0.21 | 9 | +0.32 | 0.17 | 18 | 0.05 | 0.21 | 4 | 0.23 | 0.19 |
| 101131 | 6 | +0.04 | 0.17 | 9 | +0.53 | 0.17 | 10 | 0.14 | 0.27 | 3 | 0.24 | 0.25 |
| 108176 | 7 | +0.05 | 0.25 | 8 | +0.50 | 0.17 | 11 | +0.14 | 0.24 | 3 | 0.26 | 0.01 |
| 108895 | 7 | +0.03 | 0.19 | 9 | +0.38 | 0.25 | 18 | +0.02 | 0.26 | 3 | 0.30 | 0.14 |
| 110677 | 7 | +0.11 | 0.21 | 8 | +0.35 | 0.25 | 19 | 0.19 | 0.22 | 4 | 0.25 | 0.19 |
| 111408 | 4 | 0.07 | 0.15 | 10 | +0.42 | 0.19 | 14 | 0.05 | 0.22 | 3 | 0.23 | 0.20 |
| Star | n | [Co/Fe]i | rms | n | [Ni/Fe]i | rms |
|---|---|---|---|---|---|---|
| (dex) | (dex) | |||||
| 77599 | 4 | +0.15 | 0.24 | 24 | +0.03 | 0.22 |
| 83168 | 4 | +0.03 | 0.17 | 30 | +0.03 | 0.22 |
| 101131 | 4 | +0.07 | 0.16 | 27 | +0.01 | 0.16 |
| 108176 | 5 | +0.02 | 0.25 | 22 | +0.03 | 0.23 |
| 108895 | 4 | 0.07 | 0.14 | 30 | 0.02 | 0.15 |
| 110677 | 4 | 0.01 | 0.96 | 29 | +0.08 | 0.21 |
| 111408 | 4 | +0.10 | 0.14 | 28 | +0.08 | 0.21 |
In general, Fe-group elements are clustered around the solar abundance ratio [El/Fe] dex. The overall pattern of these elements seems to be shared by all bulge clusters analyzed by us (see Table 12) and also by the globular cluster Terzan 7, likely to belong to the Sgr dwarf galaxy and used in Paper III as a comparison. Abundance ratios for the iron group elements in this cluster are taken from Tautvaisiene et al. (2004) and they agree with the solar ratios.
Special attention is deserved by Mn, the only Fe-peak element (with copper) clearly showing an abundance deficiency. The nucleosynthetic situation for this odd Fe-group element is still unclear; the most commonly accepted hypothesis to explain the observed pattern of [Mn/Fe] vs [Fe/H] (see Carretta et al. 2004 and Sobeck et al. 2006 for a summary of recent data and detailed discussions) can be briefly summarized as follows: (i) the fraction of Mn contributed to the interstellar medium by SNe Ia is larger than the fraction produced by SNe II (Gratton 1989) or (ii) the Mn yields from SNe II are metallicity-dependent (Arnett 1971). Without entering this long standing debate, we may try to locate the positions of the two peculiar bulge cluster NGC 6388 and NGC 6441 by using a limited but very homogeneous set of data.
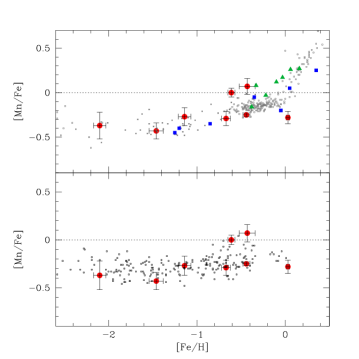
In Figure 6 (upper panel) we plot abundance ratios [Mn/Fe] for field stars from Gratton et al. (2003b); to extend the comparison into the metal-poor and metal rich domains, we employed studies of McWilliam et al. (1995), Ryan et al. (1996), Feltzing and Gustafsson (1998) and Reddy et al. (2003). As a reference sample of bulge field stars we added the stars analyzed by McWilliam et al. (2003) and by Gratton et al. in Paper III. We made no attempt to normalize all the results to a common scale; however, there are no pronounced offsets between literature sources and the sample by Gratton et al. (2003b), analyzed with procedures very similar to the one adopted in the present series. This makes us confident about the self-consistency of the dataset of field comparison stars.
We restrict the sample of GCs to those spanning the whole range of metallicity typical of Galactic globular clusters, but all studied by our group with an extremely homogeneous analysis (procedures, packages, atomic parameters). In Figure 6 (upper panel) we plot the average values (in order of increasing [Fe/H]) for the globular cluster: NGC 6397 and NGC 6752 (Carretta & Gratton 2006, in prep.); NGC 2808 (Carretta 2006); 47 Tuc (Carretta et al. 2004); NGC 6388 (present work); NGC 6441 (Paper III) and NGC 6528 (Carretta et al. 2001). Again, we corrected the values for NGC 6528 to take into account the different solar abundances used in that work. Finally, as a representative of a likely accreted component, we added the values for Terzan 7 ([Fe/H], [Mn/Fe]=0.0) from Tautvaisiene et al. (2004).
From this comparison we can see that metal-poor clusters ([Fe/H]) are in very good agreement with the more or less constant plateau at [Mn/Fe] dex as defined by field stars, including the metal-poor bulge component studied by McWilliam et al. (2003). However, for larger metallicities, there is a hint that Mn abundances in cluster and field stars may not vary in lockstep. In particular, NGC 6388 and NGC 6528 show an underabundance of Mn increasingly deviating with respect to field stars. On the other hand, in NGC 6441 the [Mn/Fe] ratio is about 0.2 dex above the mean [Mn/Fe] value of field stars of similar metallicity. We note that NGC 6388 and NGC 6528 seem to continue the plateau at constant [Mn/Fe] up to solar metal abundance. The pattern shown by NGC 6441 is more similar to that found in the Sagittarius cluster Ter 7; it is however not clear if this could indicate also a similar (independent) chemical evolution, since the average value found by Tautvaisiene et al. (2004) in Ter 7 for the -elements is [/Fe] dex, about 0.2 dex below the mean value found in NGC 6441 (and NGC 6388). Moreover, some offsets might exist, because we do not know what solar reference abundances were used for Ter 7.
To limit the importance of possible offsets among different data sets, in Figure 6 (lower panel) we plot the same sample of GCs, but compared to the most recent, complete and homogeneous re-analysis of Mn abundances in field stars (mostly in the metallicity range [Fe/H]) by Sobeck et al. (2006). We applied to their data a small offset (+0.07 dex) to take into account differences in solar reference abundances. In this analysis the pattern of underabundant [Mn/Fe] ratios extends up to solar metallicity, and all GCs have on average very similar Mn abundances, except for Ter 7 and NGC 6441. If we exclude these two objects, globular clusters have a mean value of [Mn/Fe] dex (rms=0.07 dex, 6 clusters) which is virtually the same within the uncertainties of the average value of field stars ([Mn/Fe] dex, rms=0.08 dex, when using our adopted solar abundances). This results strongly supports the finding of Sobeck et al. (2006) about the invariance of the relative contribution to the two populations from core collapse supernovae.
On the other hand, both NGC 6441 and Ter 7 stand well off from this average Mn value, by more than 5 the first and more than 4 the second. As discussed in Paper III, the almost solar ratio Mn/Fe found in NGC 6441 might indicate a different chemical history, maybe in independent system lately accreted in the Galaxy. However, things are not so simple, because also Ter 7, a cluster supposedly attributed to the Sgr dwarf galaxy, shows a solar [Mn/Fe] ratio. This last result does contrast with the Mn content found by McWilliam et al. (2003) to be underabundant in metal-rich stars of the same Sgr dwarf spheroidal galaxy.
Further insight in this metallicity regime is required to clarify the run and the nucleosynthetic history of Mn, together with informations to accurately disentangle the mix of stellar populations (thin disk, bulge and likely accreted stars) in this range of [Fe/H].
5.4 Neutron-capture elements
Finally, the abundances of elements produced by neutron-capture reactions are listed in Table 10 and Table 11. In stars of NGC 6388 we measured: the light process elements Y i, Zr i and ii of the first neutron peak, the heavier process species Ba ii, La ii and Ce ii, belonging to the second neutron peak, and the element Eu ii, the classical surrogate for process nucleosynthesis.
The importance of -elements stay in understanding the relative weight of the nucleosynthesis contributions from core-collapse SNe and lower mass SNe Ia in binary systems with longer lifetimes. This is mirrored by the relevance of the abundance ratios of n-capture elements to disentangle the contributions and possible metallicity dependences in yields from massive stars with respect to intermediate mass stars. In fact, process elements are predominantly produced in the last phases of the life of high mass stars (together with the componente of elements), whereas the quiescent He burning in low and intermediate-mass stars is chiefly responsible for producing elements from the process component.
In particular, the analysis of n-capture elements can offers key observational constraints about model of formation and early evolution of GCs. James et al. (2004) performed the most extensive study of n-capture elements in unevolved cluster stars, coupling their results to data collected from literature, to discuss the possible scenario for self-enrichment models in GCs. However, their data reached only [Fe/H] (47 Tuc) and more metal-rich clusters are needed to explore the classical self-enrichment scenario (e.g. Cayrel 1986), following the suggestion by Truran (1988). As already discussed in the Sect. 5.2, at nearly solar metallicities should be enhanced the contrast between two possible, competing patterns of abundance: (i) the one imprinted by self-enrichment phenomena in old objects like the GCs, reflecting mainly the nucleosynthetic contribution from high mass stars only, and (ii) the cumulative effects of chemical enrichment from several stellar generations, increasingly dominated by yields from long lived, less massive progenitors, whose net effect is to lower the pristine abundance ratios typical of low metal deficient stars.
The analysis of NGC 6388 is particularly important, as it is one of the most metal-rich globular clusters known in our Galaxy. Thus it can be a very powerful complement to the work of James et al. (2004) to test the self-enrichment scenario, as suggested by Truran (1988).
In typical self-enrichment scenarii (Cayrel 1986; Truran 1991), but also in more recent developments (e.g. Thoul et al. 2002, and other improvements in the Evaporation/Accretion/Self-Enrichment EASE scenario), globular cluster stars are formed in a way that is similar to very old and metal-poor halo field stars, and should consequently show a clear –process dominated origin for their heavy elements (e.g. [Ba/Eu] ratios close to a pure –process only value, see discussion in James et al. 2004). This should be true also for the most metal-rich globular clusters. Among the best suited elements to test these scenarios are those formed by neutron-capture reactions.
In Figure 7 we show as a function of metallicity the run of Ba and Eu abundances as typical elements produced by and process. We restricted again the sample of GCs (large filled circles) mainly to those analyzed by us (plus Ter 7 from Tautvaisiene et al. 2004 as an example of accreted object). As reference field stars we plot data from the extensive compilation by Venn et al. (2004; small empty squares), from the self-consistent analysis of field stars by James et al. (2004; not included in the compilation by Venn et al.; filled squares) and from Paper III (putative bulge field stars, filled triangles). For clusters analyzed in James et al. (2004) we adopted the weighted mean of values obtained from subgiants and turn-off stars for all elements.
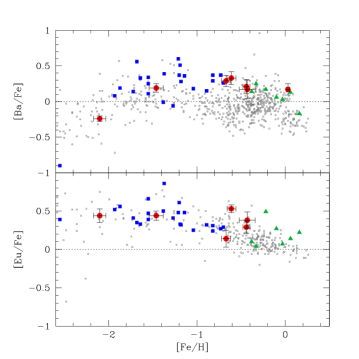
Eu is a probe of almost pure process nucleosynthesis at any metal-abundance and the lower panel of Figure 7 strongly supports the common origin of elements from and rapid neutron capture in the same stellar environment (the death of high mass stars). As for [/Fe] ratios, the resulting pattern of [Eu/Fe] is a flat plateau dominated by process contribution at low metallicity ([Fe/H]) with a well defined knee when the contribution of Fe from type Ia SNe becomes increasingly overwhelming.
Two features must be noted in this diagram. The first is that for GCs the [Eu/Fe] values show a quite small dispersion, the average ratio being [Eu/Fe]=+0.37 with dex. The value for 47 Tuc seems a bit lower: excluding this cluster we would obtain [Eu/Fe]=+0.42 with dex. There seems to be no selection bias involved in this result: from a larger sample of 20 clusters in literature Gratton et al. (2004) obtained a mean value of +0.40 dex (). This results extends the findings by James et al. (2004) up to the high metallicity of NGC 6388 and NGC 6441: the [Eu/Fe] ratios are very similar for GCs of any metal abundance. The bottom line is that these Eu abundances were already established in the interstellar medium (ISM) at the epoch when most globular clusters formed. The second point to notice is that GCs follow rather well the pattern of field stars, but only up to the metallicity of 47 Tuc. Apparently, for higher [Fe/H] values the [Eu/Fe] ratios still run flat for GCs, whereas the ratio in field stars is progressively decreased by the cumulative effect of injection in the ISM of yields from type Ia SNe. This is not due to a bias in stellar population (disk versus bulge): in this plot both NGC 6388 and NGC 6441 have a ratio about 0.2 dex higher than the average value of the putative bulge field stars analyzed in Paper III. As discussed in that work, this could indicate a larger contribution by core collapse SNe. Another explanation may be a higher efficiency to retain ejecta of massive stars in strongly bound GCs: this is supported by the fact that the more loose galactic open clusters seem to follow rather well the pattern of [Eu/Fe] versus [Fe/H] defined by field stars (see Fig. 6 in Gratton et al. 2004).
The larger dispersion of the [Ba/Fe] ratio as a function of the metallicity (upper panel of Figure 7) reflects the more complex nucleosynthetic history of Ba. As remarked in James et al. (2004), in general the [Ba/Fe] ratio in GCs seems to follow the progressive enrichment signature found in halo and disk field stars. This led to the conclusion that GCs have been uniformely enriched in neutron capture elements not only by the process, but also by process nucleosynthesis.
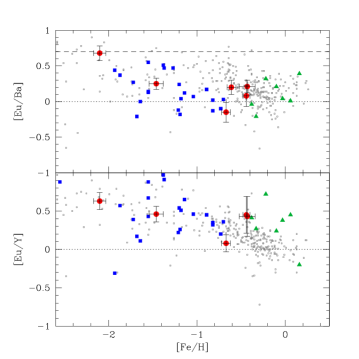
In Figure 8 the relative weight of elements from and processes is examined for our subsample of GCs and the reference field stars (the same as in Figure 7). This is done by using the abundance ratios of Eu (a pure process element) relatively to Y and Ba surrogates for process elements in the first and second neutron peak. At low metallicities the dominance from process nucleosynthesis is evident in metal-poor stars as well as in clusters. Low metallicity GCs like NGC 6397 (James et al. 2004), but also M 15 and M 92 (Sneden et al. 19997, 2000) have abundances of neutron-capture elements well matched by a scaled solar system pure process abundance distribution ([Eu/Ba], Arlandini et al. 1999). As the metallicity increases, field and GCs show ratios [/] in rough agreement, although the scatter in [Eu/Ba] is much larger than for [Eu/Fe] or even the similar ratio [Eu/Y].
Both panels in Figure 8 show the typical run of decreasing ratios due to progressive enrichment of elements (such as Ba and Y) forged within intermediate mass stars with longer evolutionary timescales for the release of yields: a roughly flat plateau followed by a decrease approaching solar metallicity (see also analogous Figures in Pritzl et al. 2005). This is more evident in the lower panel, where the scatter is reduced; the larger dispersion in the [Eu/Ba] ratios may be due to different assumptions in the treatment of the hyperfine and isotopic splitting and/or to the corrections for departures from LTE adopted in different studies.
The [Eu/Ba] ratios in the metal-rich bulge clusters NGC 6388 and NGC 6441 are the same within the associated uncertainties in the analysis (see Table 12) and follow the trend defined by field stars with the same metallicity. On the other hand, [Eu/Y] ratios in these GCs seem to be a factor 2 larger than the average value for disk field stars, although still compatible within the (rather large) associated error bars. These ratios are very similar to those of field and GCs at low metallicities, which would suggest a process dominated nucleosynthesis, with lack of strong contributions from elements produced in AGB stars. In comparison, also the field bulge stars (Paper III) show a higher [Eu/Y] ratio, similar to the one derived in NGC 6388 and NGC 6441. It is interesting to note that light elements like Y do not follow always the pattern of the heavier neutron capture elements (e.g. Burris et al. 2000); indeed they may also be produced by an additional source ( process component) in the He-core burning phase of massive stars (see Travaglio et al. 2004). Again, this would be evidence of a larger contribution from massive stars nucleosynthesis in bulge stellar populations.
The abundance distribution of neutron capture abundance ratios in these two metal-rich clusters seems to be far away from the pure process ratio and this evidence casts severe limitations to a scenario of primordial pure self-enrichment only. The scenario for the formation and early evolution of globular clusters is more complicate.
| Star | n | [Y/Fe]i | rms | n | [Zr/Fe]i | rms | n | [Zr/Fe]ii | rms | n | [Ba/Fe]i | rms |
|---|---|---|---|---|---|---|---|---|---|---|---|---|
| (dex) | (dex) | (dex) | (dex) | |||||||||
| 77599 | 2 | 0.15 | 0.20 | 6 | 0.12 | 0.22 | 1 | 0.18 | 3 | +0.13 | 0.07 | |
| 83168 | 2 | 0.27 | 0.12 | 6 | 0.21 | 0.22 | 1 | 0.03 | 3 | +0.19 | 0.17 | |
| 101131 | 2 | 0.07 | 0.03 | 6 | 0.15 | 0.28 | 1 | 0.05 | 3 | +0.42 | 0.15 | |
| 108176 | 2 | +0.10 | 0.13 | 6 | 0.02 | 0.33 | 1 | 0.23 | 3 | +0.15 | 0.14 | |
| 108895 | 2 | 0.40 | 0.10 | 6 | 0.35 | 0.17 | 1 | 0.50 | 3 | +0.10 | 0.10 | |
| 110677 | 2 | 0.34 | 0.10 | 6 | 0.27 | 0.27 | 1 | 0.07 | 3 | +0.18 | 0.11 | |
| 111408 | 2 | +0.01 | 0.20 | 6 | 0.04 | 0.26 | 1 | 0.33 | 3 | +0.29 | 0.13 |
| Star | n | [La/Fe]ii | rms | n | [Ce/Fe]ii | rms | n | [Eu/Fe]i | rms |
|---|---|---|---|---|---|---|---|---|---|
| (dex) | (dex) | (dex) | |||||||
| 77599 | 3 | +0.44 | 0.23 | 1 | 0.18 | 2 | +0.35 | 0.29 | |
| 83168 | 3 | +0.43 | 0.14 | 2 | 0.08 | 0.31 | 2 | +0.34 | 0.12 |
| 101131 | 3 | +0.44 | 0.05 | 2 | 0.09 | 0.26 | 2 | +0.21 | 0.15 |
| 108176 | 2 | +0.41 | 0.23 | 2 | 0.37 | 0.35 | 2 | +0.15 | 0.06 |
| 108895 | 2 | +0.17 | 0.14 | 1 | 0.38 | 2 | +0.34 | 0.15 | |
| 110677 | 3 | +0.33 | 0.12 | 1 | 0.49 | 2 | +0.28 | 0.15 | |
| 111408 | 3 | +0.28 | 0.24 | 1 | 0.28 | 2 | +0.36 | 0.19 |
5.5 Comparison with literature
To our knowledge, the only analysis of detailed elemental abundances in NGC 6388 has been presented by Wallerstein et al. (2005). They used the 4m Blanco telescope at CTIO and observed 8 stars at R=35000 and high S/N (70 to 100). Their targets are much nearer the RGB tip than our sample (V=14.84 to 15.10 as compared to V=15.25 to 15.79). They obtained an average [Fe/H] and derived abundances for O and C (found underabundant in comparison to most stars of similar metallicity, at [O/Fe] [C/Fe]), Na and Al (slightly overabundant at [Na/Fe], [Al/Fe]), the -elements Mg, Si, Ca, Ti (defined about normal, with [/Fe]), and finally the -process elements Ba, La and the -process one Ba showing small, normal excesses.
These results were presented so far only at a conference and we miss details on the analysis. However, as the referee pointed out, there may be some inconsistencies in their analysis, that would shed doubts on the complete reliability of their results. In particular, when corrected for the average cluster reddening, the magnitudes and colours of the 8 stars appear to be matched by a [Fe/H]= isochrone better than by a [Fe/H]= one. That implies a discrepancy both for temperatures and gravities and a lower Fe abundance, i.e., altered elemental ratios. We will not further discuss this analysis, awaiting for a more complete presentation.
| Ratio | Mean | Mean | Mean | Mean | Mean | Mean | ||||||
|---|---|---|---|---|---|---|---|---|---|---|---|---|
| NGC | NGC | NGC | NGC | Ter 7 | Ter 7 | |||||||
| 6388 | 6441 | 6528 | 6553 | |||||||||
| (1) | (1) | (2) | (2) | (3) | (3) | (4) | (4) | (5) | (5) | (6) | (6) | |
| O/FeI | 0.30 | 0.16 | +0.12 | 0.20 | 0.05 | 0.14 | +0.38 | 0.13 | +0.24 | 0.05 | ||
| Na/FeI | +0.59 | 0.16 | +0.55 | 0.15 | +0.56 | 0.14 | 0.14 | 0.10 | ||||
| Mg/FeI | +0.21 | 0.07 | +0.34 | 0.09 | +0.29 | 0.11 | +0.56 | 0.10 | +0.14 | 0.06 | +0.08 | 0.07 |
| Al/FeI | +0.69 | 0.24 | +0.30 | 0.15 | 0.13 | 0.04 | ||||||
| Si/FeI | +0.32 | 0.10 | +0.33 | 0.11 | +0.41 | 0.09 | +0.19 | 0.18 | +0.00 | 0.01 | +0.13 | 0.09 |
| Ca/FeI | +0.06 | 0.06 | +0.03 | 0.04 | +0.16 | 0.06 | +0.19 | 0.09 | +0.06 | 0.03 | +0.13 | 0.14 |
| Sc/FeII | +0.05 | 0.06 | +0.15 | 0.15 | 0.17 | 0.10 | 0.24 | 0.18 | 0.06 | 0.06 | ||
| Ti/FeI | +0.37 | 0.10 | +0.29 | 0.10 | +0.05 | 0.08 | +0.21 | 0.06 | +0.13 | 0.03 | +0.12 | 0.07 |
| Ti/FeII | +0.30 | 0.12 | +0.33 | 0.14 | +0.11 | 0.02 | ||||||
| V/FeI | +0.39 | 0.10 | +0.29 | 0.14 | 0.14 | 0.09 | +0.11 | 0.07 | ||||
| Cr/FeI | 0.04 | 0.11 | +0.15 | 0.18 | 0.01 | 0.05 | +0.03 | 0.09 | +0.02 | 0.03 | ||
| Mn/FeI | 0.25 | 0.02 | +0.07 | 0.09 | 0.28 | 0.07 | +0.00 | 0.05 | ||||
| Fe/HI | 0.44 | 0.04 | 0.43 | 0.06 | +0.03 | 0.02 | 0.20 | 0.08 | 0.61 | 0.04 | 0.63 | 0.07 |
| Fe/HII | 0.37 | 0.09 | 0.42 | 0.24 | +0.08 | 0.02 | 0.23 | 0.10 | 0.61 | 0.04 | 0.58 | 0.05 |
| Co/FeI | +0.04 | 0.07 | +0.14 | 0.07 | +0.01 | 0.08 | ||||||
| Ni/FeI | +0.03 | 0.03 | +0.13 | 0.07 | +0.11 | 0.05 | +0.02 | 0.07 | 0.11 | 0.02 | 0.19 | 0.05 |
| Y/FeI | 0.16 | 0.19 | 0.05 | 0.24 | ||||||||
| Zr/FeI | 0.16 | 0.12 | 0.40 | 0.19 | 0.07 | 0.07 | ||||||
| Zr/FeII | 0.20 | 0.17 | ||||||||||
| Ba/FeII | +0.21 | 0.10 | +0.17 | 0.13 | +0.17 | 0.08 | +0.33 | 0.09 | ||||
| La/FeII | +0.36 | 0.10 | +0.42 | 0.15 | ||||||||
| Ce/FeII | 0.27 | 0.16 | +0.22 | 0.07 | ||||||||
| Eu/FeII | +0.29 | 0.08 | +0.38 | 0.11 | +0.53 | 0.05 |
(1) present work, solar reference abundances from Gratton et al. (2003a)
(2) from Tab. 8 of Gratton et al. (Paper III), solar reference abundances from Gratton et al. (2003a)
(3) from Carretta et al. (2001), correction to present solar reference abundances
(4) from Cohen et al. (1999), correction to present solar reference abundances
(5) from Tautvaisiene et al. (2004), with unknown solar reference abundances
(6) from Sbordone et al. (2005), correction to present solar reference abundances
6 Summary
This is the first paper on the detailed chemical composition of the peculiar bulge cluster NGC 6388, based on the analysis of high resolution UVES/FLAMES spectra of seven RGB stars. From these stars (all cluster members) we find an average value [Fe/H] dex with no evidence of intrinsic spread in metallicity in this cluster. We also obtained the detailed abundance pattern for proton-capture elements (O, Na, Al, Mg), elements (Si, Ca, Ti), Fe-peak elements (Sc, V, Cr, Mn, Co, Ni) and neutron capture elements (Y, Zr, Ba, La, Ce, Eu).
Studying the detailed chemistry of stars in such an old and moderately metal-rich object opens to us a powerful window over the various kind of nucleosynthetic sites that contribute to the formation and chemical enrichment of globular clusters, allowing to isolate and study the yields provided by stars in different ranges of masses and lifetimes.
The role of stars in the mass range is recognized from the abundances of process elements like Ba, La, Ce: models for chemical evolution in GCs must necessarily include nucleosynthesis from AGB stars in this mass range. However, within each single cluster the elements are homogeneusly distributed (see James et al. 2004, Armosky et al. 1994): also in NGC 6388 (and NGC 6441) the observed scatter is nearly equal to or smaller than the spread expected from observational errors.
These stars are not the same stars whose lifes and products affect the pattern of proton-capture elements involved in H-burning at high temperatures (O, Na, Al, Mg). The well known anti-correlation Na-O and Al-Mg established in NeNa and MgAl cycles (and also found in NGC 6388) are not mirrored by similar variations in process elements. The clear implication is that the abundance anomalies are generated in stars of another (more large) mass range, likely intermediate mass AGB stars (4-8 ).
We found in stars in NGC 6388 (as well as in the twin cluster NGC 6441) an excess of process elements with respect to field disk and bulge stars of similar metallicity, hint of a better capability to retain ejecta of massive stars ending their life as core-collapse supernovae. The same evidence is supported by another element typically produced in massive stars environment: the pure process neutron capture element Eu. The [Eu/Fe] ratios of NGC 6388 and NGC 6441 stand above the ratios found in field stars and are rather similar to the value shown by low metallicity stars (both in the field and in GCs). In the same way, the high [Eu/Y] values for these two bulge clusters seem to be indicative of a dominance from process with small contribution from the process (at least from the component).
In conclusion, it is still not easy to reconcile all the observational facts into a coherent picture on how globular cluster formed and were enriched. We have at hand contrasting evidences that the enrichment process is not compatible with a pure self-enrichment scenario and, on the other hand, the metal-rich GCs present proofs of enhanced efficiency in retain ejecta from the massive SNe II with respect to field stars or looser open clusters. More works, both on the theoretical and observational fronts, are needed before a definitive conclusion might be reached.
Acknowledgements.
We thank the anonymous referee for the very constructive comments. This publication makes use of data products from the Two Micron All Sky Survey, which is a joint project of the University of Massachusetts and the Infrared Processing and Analysis Center/California Institute of Technology, funded by the National Aeronautics and Space Administration and the National Science Foundation. This work was partially funded by the Italian MIUR under PRIN 2003029437. We also acknowledge partial support from the grant INAF 2005 “Experimental nucleosynthesis in clean environments”.References
- (1) Alonso, A., Arribas, S. & Martinez-Roger, C. 1999, A&AS, 140, 261
- (2) Alonso, A., Arribas, S. & Martinez-Roger, C. 2001, A&A, 376, 1039
- (3) Arlandini, C., Käppeler, F., Wisshak, K., Gallino, R., Lugaro, M., Busso, M., Straniero, O. 1999, ApJ, 525, 886
- (4) Armosky, B.J., Sneden, C., Langer, G.E., Kraft, R.P. 1994, AJ, 108, 1364
- (5) Armandroff, T.E., Zinn, R. 1988, AJ, 96, 92
- (6) Arnett, W.D. 1971, ApJ, 166, 153
- (7) Bragaglia, A., Carretta, E., Gratton, R.G. et al. 2001, AJ, 121, 327
- (8) Burris, D.L., Pilachowski, C.A., Armandroff, T.E., Sneden, C., Cowan, J.J., Roe, H. 2000, ApJ, 544, 302
- (9) Busso, G., Piotto, G., Cassisi, S. 2004, Mem.SAIt., 75, 46
- (10) Cardelli, J.A., Clayton, G.C., & Mathis, J.S. 1989, ApJ, 345, 245
- (11) Carretta, E. 2006, AJ, 131, 1766
- (12) Carretta, E., Gratton, R.G. 2006, in preparation
- (13) Carretta, E., Cohen, J., Gratton, R.G. & Behr, B.B. 2001, AJ, 122, 1469
- (14) Carretta, E., Gratton R.G., Bragaglia, A., Bonifacio, P. & Pasquini, L. 2004, A&A, 416, 925
- (15) Carretta, E., Bragaglia, A., Gratton R.G., Leone, F., Recio-Blanco, A., Lucatello, S. 2006a, A&A, 450, 523 (Paper I)
- (16) Carretta, E., Bragaglia, A., Gratton R.G., Lucatello, S., & Momany, Y. 2006b, A&A, in press (Paper II)
- (17) Carretta et al. (2006c), A&A, in press (Paper IV)
- (18) Carretta et al. (2006d), in preparation
- (19) Cayrel, R. 1986, A&A, 168, 8
- (20) Cohen, J.G., Gratton, R.G., Behr, B.B., Carretta, E. 1999, ApJ, 523, 739
- (21) Corwin, T.M., Catelan, M., Borissova, J., Smith, H.A. 2004, A&A, 421, 667
- (22) Corwin, T.M., Sumerel, A.N, Pritzl, B.J., Smith, H.A., Catelan, M., Sweigart, A.V., Stetson, P.B. 2006, AJ, in press (astro-ph/0605569)
- (23) D’Antona, F. & Caloi, V. 2004, ApJ, 611, 871
- (24) Feltzing, S. & Gustafsson, B. 1998, A&AS, 129, 237
- (25) Gratton, R.G. 1988, Rome Obs. Preprint, 29
- (26) Gratton, R.G. 1989, A&A, 208, 171
- (27) Gratton, R.G., Carretta, E., Eriksson, K., & Gustafsson, B. 1999, A&A, 350, 955
- (28) Gratton, R.G., Carretta, E., Claudi, R., Lucatello, S., & Barbieri, M. 2003a, A&A, 404, 187
- (29) Gratton, R.G., Carretta, E., Desidera, S., Lucatello, S., Mazzei, P. & Barbieri, M. 2003b, A&A, 406, 131
- (30) Gratton, R.G., Sneden, C., & Carretta, E. 2004, ARA&A, 42, 385
- (31) Gratton, R.G., Bragaglia, A., Carretta, E., Lucatello, S., Momany, Y., Pancino, E., & Valenti, E. 2006, A&A, in press (Paper III)
- (32) Gratton, R.G. et al. 2007, A&A, in press (Paper V)
- (33) Harris, W. E. 1996, AJ, 112, 1487
- (34) James, G., François, P., Bonifacio, P., Carretta, E., Gratton, R.G., Spite, F. 2004, A&A, 427, 825
- (35) Kurucz, R.L. 1993, CD-ROM 13, Smithsonian Astrophysical
- (36) Lynch, D.K., Bowers, P.F., Whiteoak, J.B. 1989, AJ, 97, 1708
- (37) Magain, P. 1984, A&A, 134, 189
- (38) McLaughlin, D.E., van der Marel, R.P. 2005, ApJ.Suppl. Ser., 161, 304
- (39) McWilliam, A., Preston, G.W., Sneden, C., Searle, L. 1995, AJ, 109, 2757
- (40) McWilliam, A., Rich, R. M., Smecker-Hane, T. A. 2003, ApJ, 592, L21
- (41) Moehler, S., Sweigart, A.V. 2006a, Baltic Astronomy, 15,41
- (42) Moehler, S., Sweigart, A.V. 2006b, A&A, in press, astro-ph/0606054
- (43) Moehler, S., Sweigart, A.V., Catelan, M. 1999, A&A, 351, 519
- (44) Momany, Y., Held, E. V., Saviane, I., Rizzi, L. 2002, A&A, 384, 393
- (45) Momany, Y., Cassisi, S., Piotto, G., Bedin, L.R., Ortolani, S., Castelli, F., Recio-Blanco, A. 2003, A&A, 407, 303
- (46) Pasquini, L. et al. 2002, The Messenger, 110, 1
- (47) Pritzl, B.J., Smith, H.A., Catelan, M., Sweigart, A.V. 2001, AJ, 122, 2600
- (48) Pritzl, B.J., Smith, H.A., Catelan, M., Sweigart, A.V. 2002, AJ, 124, 949
- (49) Pritzl, B.J., Venn, K.A., Irwin, M.J. 2005, AJ, 130, 2140
- (50) Raimondo, G., Castellani, V., Cassisi, S., Brocato, E., Piotto, G. 2002, ApJ, 569, 975
- (51) Reddy, B.E., Tomkin, J., Lambert, D.L., Allende prieto, C. 2003, MNRAS, 340, 304
- (52) Rich, R.M. et al. 1997, ApJ, 484, L25
- (53) Ryan, S.G., Norris, J.E., beers, T.C. 1996, ApJ, 471, 254
- (54) Sandage, A. 2006, AJ, 131, 1750
- (55) Skrutskie, M.F. et al. 2006, AJ, 131, 1163
- (56) Sobeck, J. S., Ivans, I. I., Simmerer, J. A., Sneden, C., Hoeflich, P., Fulbright, J. P., Kraft, R. P. 2006, AJ, 131, 2949
- (57) Sneden, C., Kraft, R.P., Shetrone, M.D., Smith, G.H., Langer, G.E., Prosser, C.F. 1997, AJ, 114, 1964
- (58) Sneden, C., Pilachowski, C., Kraft, R.P. 2000, AJ, 120, 1351
- (59) Stetson, P. B. 1994, PASP, 106, 250
- (60) Sweigart, A.V., Catelan, M. 1998, ApJ, 501, L63
- (61) Tautvaisiene, G., Wallerstein, G., Geisler, D., Gonzalez, G. & Charbonnel, C. 2004, AJ, 127, 373
- (62) Thoul, A., Jorissen, A., Goriely, S., Jehin, E., Magain, P. Noels, A., Parmentier, G. 2002, A&A, 383, 491
- (63) Travaglio, C., Gallino, R., Arnone, E., Cowan, J, Jordan, F., Sneden, C. 2004, ApJ, 601, 864
- (64) Truran, J. 1988, in The Impact of Very High S/N Spectroscopy on Stellar Physics, eds. G. Cayrel de Strobel, M. Spite, IAU Symp. 132, 577
- (65) Truran, J. 1991, ASP Conf. Ser. 13, 78
- (66) Venn, K.A., Irwin, M., Shetrone, M.D., Tout, C.A., Hill, V., Tolstoy, E. 2004, AJ, 128, 1177
- (67) Wallerstein, G., Kovtyukh, V., & Andrievsky, S. 2005, in From Lithium to Uranium: Elemental Tracers of Early Cosmic Evolution, eds. V. Hill, P. François, F.Primas, IAU Symp. 228, 413
- (68) Yi, S., Demarque, P., Oemler, A. 1998, ApJ, 492, 480
- (69) Zacharias, N., Urban, S. E., Zacharias, M. I., Wycoff, G. L., Hall, D. M., Monet, D. G., Rafferty, T. J. 2004, AJ, 127, 3043