Na-O Anticorrelation and HB. IV. Detection of He-rich and He-poor stellar populations in the globular cluster NGC 6218 ††thanks: Based on observations collected at ESO telescopes under programme 073.D-0211. Tables 2, 3, 5 are only available in electronic form at the CDS via anonymous ftp to cdsarc.u-strasbg.fr (130.79.128.5) or via http://cdsweb.u-strasbg.fr/cgi-bin/qcat?J/A+A/
We used the multifiber spectrograph FLAMES on the ESO Very Large Telescope UT2 to derive atmospheric parameters, metallicities and abundances of O and Na for 79 red giant stars in the Galactic globular cluster NGC 6218 (M 12). We analyzed stars in the magnitude range from about 1 mag below the bump to the tip of the Red Giant Branch. The average metallicity we derive is [Fe/H]= dex (random and systematic errors, respectively), with a very small star-to-star scatter ( dex), from moderately high-resolution Giraffe spectra. This is the first extensive spectroscopic abundance analysis in this cluster. Our results indicate that NGC 6218 is very homogeneous as far as heavy elements are concerned. On the other hand, light elements involved in the well known proton-capture reactions of H-burning at high temperature, such as O and Na, show large variations, anticorrelated with each other, at all luminosities along the red giant branch. The conclusion is that the Na-O anticorrelation must be established in early times at the cluster formation. We interpret the variation of Na found near the RGB-bump as the effect of two distinct populations having different bump luminosities, as predicted for different He content. To our knowledge, NGC 6218 is the first GC where such a signature has been spectroscopically detected, when combined with consistent and homogeneous data obtained for NGC 6752 to gain in statistical significance.
Key Words.:
Stars: abundances – Stars: atmospheres – Stars: Population II – Galaxy: globular clusters – Galaxy: globular clusters: individual: NGC 6218 (M 12)1 Introduction
This is the fourth paper of a series aimed at studying the mechanisms of formation and early evolution of Galactic globular clusters (GCs). To reach this goal we are trying to uncover and establish the possible existence of a second generation of stars in these old stellar aggregates. The motivations and the general strategy have already been explained in the first papers of the series, particularly in Carretta et al. (2006a, hereafter Paper I) dedicated to NGC 2808.
It has been recently realized that a few well known abundance ”anomalies”, one for all the anticorrelation between abundances of Na and O, are present also among unevolved or scarcely evolved cluster stars (Gratton et al. 2001, Ramirez & Cohen 2003, Cohen & Melendez 2005, Carretta et al. 2005). The chemical composition of these stars shows that the alterations observed in the abundances of the light elements C, N, O, Al, Mg cannot be attributed to an extensive phenomenon of evolutionary extra-mixing, since these stars lack the possibility to mix internal nucleosynthetic products to the surface (for reviews see Kraft 1994 and more recently Gratton et al. 2004). It naturally follows that an origin from stars other than the ones we are observing has to be accepted (the so called primordial origin). The best candidates are an earlier generation of intermediate-mass Asymptotic Giant Branch (AGB) stars, able to pollute the material from which the currently observed stars were born from. We then expect to be able to see differences in the abundances for those elements involved in nuclear burning in those pristine stars, i.e. those involved in high temperature proton-capture reactions in the complete CNO cycle (Ne-Na and Mg-Al chains).
It is interesting to note that these anomalies are a signature strictly confined to the high density environment typical of globular clusters: field stars are known to show only the modifications in C and N abundances as predicted by the two typical mixing episodes (first dredge-up and a second mixing after the bump on the RGB) expected for Population II low mass stars, and no alterations in the abundance of heavier nuclei such as O, Na (Charbonnel 1994, Gratton et al. 2000). This striking difference supports the idea that this kind of anomalies might be intimately related to the very same formation of a globular cluster (see e.g. Carretta 2006). On the other hand, if this conclusion is true, we might expect that other physical properties of GCs may show a connection with their chemical signature.
A first surprising discovery was made by Carretta (2006): using more limited samples than those we are collecting in our present survey, he pointed out that a quite good correlation does exist between the spread in the abundance of proton-capture elements and orbital parameters of GCs. In particular, chemical anomalies are found to be more extended in clusters having large-sized orbits and longer periods and in those with larger inclination angles of the orbit with respect to the Galactic plane.
In our study, we are performing a systematic analysis of a large number of stars (about 100 per cluster) in about 20 GCs, determining accurately and homogeneously abundances of Na and O. We have chosen clusters of different horizontal branch (HB) morphologies, metallicities, concentration, densities, et cetera, to understand whether there is some connection between the presence and extent of the anticorrelations and some properties of the globular clusters.
To reduce concerns related to model atmospheres, we are not observing stars near the red giant branch (RGB) tip. To sample a CMD region populated enough and reach the required number of objects, in some clusters we have to select stars in a rather extended range of magnitudes, sampling the cluster giants both above and below the so-called RGB-bump, i.e. the bump in the luminosity function of RGB stars. NGC 6218 is one of these cases and we were able to study in details the region near the RGB-bump, where e.g., effects due to different He contents are enhanced and observable thanks to the slowing of stellar evolutionary rates. This allows us to uncover for the first time the spectroscopic evidence of distinct stellar populations with likely different He content.
In the framework of the present project we have already examined the youngish and peculiar cluster NGC 2808 (Paper I), the more ”normal”, intermediate-metallicity, blue HB cluster NGC 6752 (Carretta et al. 2006, hereafter Paper II), and the anomalous bulge cluster NGC 6441 (Gratton et al. 2006, Paper III). Here we present our results on the Na-O anticorrelation among RGB stars in NGC 6218 (M 12), studied for the first time in this cluster.
From the Harris (1996) catalogue NGC 6218 has an absolute visual magnitude , a distance from the Sun of 4.9 kpc and from the Galactic centre of 4.5 kpc, and a totally blue HB [] without any RR Lyrae star. Its age seems in line with the ones of the oldest Galactic GCs (Rosenberg et al. 1999) The only known peculiarity of NGC 6218 is its very flat mass function (De Marchi et al. 2006), indicative of a very efficient mass segregation and tidal stripping.
Up to now, NGC 6218 had not been the subject of many detailed spectroscopic works, not even to determine its metallicity 111We adopt the usual spectroscopic notation, [X]= log(X) log(X)⊙ for any abundance quantity X, and log (X) = log (NX/NH) + 12.0 for absolute number density abundances.. Before the present work222 After the first version of the present paper was submitted, Jonhson & Pilachowski (2006) presented the analysis of 21 RGB and AGB stars, observed with Hydra on the 3.5m WIYN telescope at resolution . They derived and average metallicity [Fe/H]= () dex and measured abundances of several elements (-, Fe-peak, n-capture elements); in particular, they obtained abundances of Na, but not of O. Since they already presented a quite detailed comparison of their results with ours, we will not repeat it here., only three stars in this cluster had their abundances derived from high resolution spectra. Klochkova & Samus (2001) observed the post-AGB star K 413 (ZNG 8), determining [Fe/H], [Na/Fe] and a very large overabundance of O ([O/Fe]). Mishenina et al. (2003) analyzed star K 118 (ZNG 4), finding [Fe/H]=; they did not measure Na or O. Jasniewicz et al. (2004) presented the analysis of one UV-bright star (ZNG 7, or K 329) in this cluster, a probable AGB star which shows an underabundance of Fe ([Fe/H]) and several other peculiarities; neither Na or O abundances were determined.
Other literature values for the cluster’s metallicity include the one by Brodie & Hanes (1986) based on integrated light and the use of indices which resulted in [Fe/H], and the one by Rutledge et al. (1997) based on the Ca IR triplet, which is [Fe/H] (when the method is calibrated on the Carretta & Gratton 1997 metallicity scale) or [Fe/H] (when calibrated on the Zinn & West 1984 scale).
The present paper is organized as follows: an outline of the observations is given in the next Section; the derivation of atmospheric parameters and the analysis are described in Sect. 3, whereas error estimates and cosmic scatter in metallicity are discussed in Sect. 4. Sect. 5 is devoted to the results for the Na-O anticorrelation. In Sect. 6 we present the evidences for the existence of two distinct population of He-rich and He-poor stars along the RGB of NGC 6218. The relation between chemistry and orbital parameters of the cluster is shown in Sect. 7. Finally, a summary is presented in Sect. 8.
2 Observations, target selection and membership
Our data were collected in Service mode with the ESO high resolution multifiber spectrograph FLAMES/GIRAFFE (Pasquini et al. 2002) mounted on the VLT. Observations were done with two GIRAFFE setups, the high-resolution gratings HR11 (centered at 5728 Å) and HR13 (centered at 6273 Å) to measure the Na doublets at 5682-5688 Å and 6154-6160 Å and the [O i] forbidden lines at 6300, 6363 Å, respectively. The resolution is R=24200 (for HR11) and R=22500 (for HR13), at the center of the spectra. We used one single exposure of 2700 seconds for each grating.
| Grating | Date | UTbeginning | exptime | airmass |
|---|---|---|---|---|
| HR11 | 2004-07-20 | 03:50:04 | 2700 | 1.41 |
| HR13 | 2004-04-13 | 07:25:10 | 2700 | 1.09 |
As done with the previous GCs, our targets were selected among stars near the RGB ridge line and isolated333All stars were chosen to be free from any companion closer than 2 arcsec and brighter than mag, where is the target magnitude.. We used the photometry from Sabbi et al. (2006), calibrated to the standard Johnson system, for our target selection.
The photometric data consist of two dataset. The central region of NGC 6218 was observed in service mode during 1999 June with UT1 of the VLT using FORS1 in the high resolution (HR) mode. In this configuration the plate scale is and the field of view is . The data consist of exposures of 3, 5 and 7 seconds in the , , bands, respectively. A complementary set of wide-field and images acquired with the 2.2 m ESO–MPI telescope at ESO (La Silla), using the Wide Field Imager (WFI) cameras, with a field of view of , was retrieved from the ESO data archive.
The reduction of the HR exposures was carried out using ROMAFOT (Buonanno etal. 1983, Buonanno & Iannicola 1986), a package specifically developed to perform accurate photometry in crowded fields. The WFI data were reduced using DAOPHOT II (Stetson 1994). The data sets were then matched together, and a final catalog listing the instrumental , and magnitudes, and coordinates for all the stars in each chip was compiled. The Guide Star Catalog (GSCII) was used to search for astrometric standards in the entire WFI image field of view. Several hundreds of astrometric GSCII reference stars were found in each chip, allowing us an accurate absolute position of the detected stars. By using a sample of bright stars (lying either in the HR and WFI field of view) as “secondary astrometric standards”, also the astrometric solution of the innermost region of NGC 6218 was found. The final instrumental magnitudes of the HR exposures were transformed to the standard Johnson photometric system by using the same procedure and the same ten photometric stars adopted in Paltrinieri et al. (2001). Stars in common between the HR and WFI images were used to calibrate the WFI catalog on the HR one. A final catalog completely homogeneous in magnitudes and coordinates was obtained.
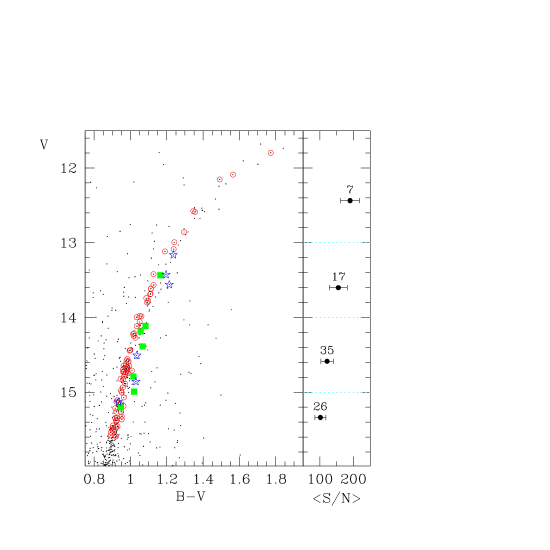
Table 1 lists information about the two GIRAFFE pointings, while a list of all observed targets with coordinates, magnitudes and radial velocities (RVs) is given in Table 2 (the full table is available only in electronic form). The colour magnitude diagram (CMD) of our sample is shown in Figure 1; our targets range from about = 11.8 to 15.6, i.e. from near the RGB tip to more than 1 magnitude below the RGB bump. A few field stars (on the basis of their radial velocities) are indicated by different symbols. Contamination from stars on the asymptotic giant branch (AGB) may be possible for colors redder than ; however, this is not of concern for our analysis, because a priori AGB stars are about 10% of the RGB stars and a posteriori the very small scatter in derived abundances supports the reliability of the adopted atmospheric parameters, including the adopted stellar mass (appropriate for first ascent red giant branch stars).
We used the 1-d, wavelength calibrated spectra as reduced by the dedicated Giraffe pipeline (BLDRS v0.5.3, written at the Geneva Observatory, see http://girbldrs.sourceforge.net). Radial velocities (RVs) were measured using the IRAF444 IRAF is distributed by the National Optical Astronomical Observatory, which are operated by the Association of Universities for Research in Astronomy, under contract with the National Science Foundation package FXCORR on appropriate templates and are shown in Table 2. We have noticed a systematic difference between the RVs of stars observed with both gratings (on average km s-1). This is completely irrelevant from the point of view of the abundance analysis and is most probably due to small zero point errors in the wavelength calibration. We have measured an average shift of +0.02 Å (i.e., about km s-1) for the two auroral emission lines of [O i] at 6300 and 6363 Å, but no such check was possible for grating HR11. Correcting the observed RVs of HR13 for the above mentioned shift and eliminating the sure and possible non members, the average cluster heliocentric velocity is (rms=3.2) km s-1, in very good agreement with the value () tabulated in the updated catalog of Harris (1996).
Seven stars were excluded from this average and from further analysis as non-members based on the RV: these objects differ by more than 15 from the cluster average.
Furthermore, for one object (star 100010) we found very different RVs in the two pointings; this is most likely due to a misidentification of the target in one of the two pointings. Given its dubious status, we dropped this star from our sample too. Other objects were discarded from the sample after the abundances analysis because their metallicity resulted much higher than the cluster average. Most probably, these are disk objects with RVs similar to the cluster’s value. To check this possibility we used the Besançon galactic model (Robin et al. 2003) and found that a relevant fraction of field stars in the direction of NGC 6218 has a RV completely compatible with the one of the cluster.
Not all the stars were observed in both gratings, since we also aimed to target up to 14 stars per cluster with the 7 UVES fibers; hence the GIRAFFE fiber positioning was slightly different between the two pointings. On a grand total of 79 different stars observed and bona fide cluster members, we have 53 objects with spectra for both gratings, 11 with only HR11 observations and 15 with only HR13 observations. We were able however to measure Na abundances for all target stars but one, because the Na doublet at 6154-6160 Å falls into the spectral range covered by HR13, whereas we could expect to measure O (or to determine a limit) only for a maximum number of 68 stars.
| Nr | ID | RA | Dec | RV(HR11) | RV(HR13) | Notes | ||||
|---|---|---|---|---|---|---|---|---|---|---|
| 1 | 100001 | 251.9351289 | -1.8583407 | 15.544 | 14.509 | 12.518 | 11.925 | -34.55 | -31.84 | HR11,HR13,* |
| 2 | 100005 | 251.9152836 | -1.9122903 | 15.890 | 14.860 | 12.791 | 12.151 | -35.94 | -33.03 | HR11,HR13,* |
| 3 | 100010 | 251.9115453 | -1.8639458 | 16.066 | 15.132 | 13.215 | 12.673 | -47.28 | 36.65 | HR11,HR13,* |
| 4 | 100017 | 251.9178348 | -1.9572735 | 16.114 | 15.170 | 13.184 | 12.511 | -40.52 | HR11 | |
| 5 | 100021 | 251.9170197 | -1.9697241 | 16.261 | 15.345 | 13.386 | 12.699 | -47.96 | HR13 | |
| 6 | 100027 | 251.9258546 | -1.8851002 | 16.511 | 15.591 | 13.610 | 12.963 | -41.85 | -39.33 | HR11,HR13 |
| 7 | 101677 | 251.9417972 | -1.9880637 | 14.399 | 13.163 | 10.813 | 9.933 | -24.28 | -21.34 | HR11,HR13, NM?,* |
| 8 | 101682 | 251.8963944 | -1.8638070 | 14.624 | 13.428 | 11.085 | 10.295 | -57.05 | HR13, NM?,* | |
| 9 | 200004 | 251.8400920 | -1.9497273 | 13.944 | 12.589 | 9.958 | 9.068 | -46.41 | HR11 | |
| 10 | 200006 | 251.8643031 | -2.0068012 | 13.923 | 12.577 | 9.977 | 9.096 | -36.58 | HR13 |
3 Atmospheric parameters and analysis
3.1 Atmospheric parameters
Temperatures and gravities were derived as described in Paper I and Paper II; along with the derived atmospheric parameters and iron abundances, they are shown in Table 3 (completely available only in electronic form). We obtained Teff’s and bolometric corrections B.C. for our stars from colours, where was taken from the Point Source Catalogue of 2MASS (Skrutskie et al. 2006) and transformed to the TCS photometric system, as used in Alonso et al. (1999). We employed the relations by Alonso et al. (1999, with the erratum of 2001). We adopted for NGC 6218 a distance modulus of =14.02, a reddening of = 0.19, an input metallicity of [Fe/H] (Harris 1996), and the relations , , and (Cardelli et al. 1989).
As done for NGC 6752 (Paper II), the final adopted ’s were derived from a relation between (from and the Alonso et al. calibration) and based on 79 ”well behaved” stars (i.e., with magnitudes in all the four filters and lying on the RGB). This procedure was adopted in order to decrease the scatter in abundances due to uncertainties in temperatures, since magnitudes are much more reliably measured than colours. The assumptions behind this approach are discussed in Paper II and they will be not repeated here.
Surface gravities log ’s were obtained from the apparent magnitudes, the above discussed effective temperatures and distance modulus, and the bolometric corrections from Alonso et al. (1999), assuming masses of 0.85 M⊙ and as the bolometric magnitude for the Sun.
We eliminated trends in the relation between abundances of Fe i and expected line strength (see Magain 1984) to obtain values of the microturbulence velocities s.
3.2 Equivalent widths and iron abundances
Line lists, atomic parameters and reference solar abundances are from Gratton et al. (2003). Equivalent widths (s) were measured as described in detail in Bragaglia et al. (2001) with the same procedure adopted in Paper I and Paper II for the definition of the local continuum around each line. This is a crucial step at the limited resolution of our spectra, especially for the coolest targets. According to the strategy illustrated in Paper II, we checked the reliability of s measured on the GIRAFFE spectra by performing a comparison with those measured on the high-resolution UVES/FLAMES spectra of 9 stars observed in both configurations. For NGC 6218 s from GIRAFFE are on average larger than those measured from UVES spectra by mÅ (rms=10.0 mÅ from 371 lines), i.e. in excellent agreement. Tables of measured s are only available at the CDS database.
Final metallicities are obtained by choosing in the Kurucz (1993) grid of model atmospheres (with the option for overshooting on) the model with the proper atmospheric parameters whose abundance matches that derived from Fe i lines.
Average abundances of iron for NGC 6218 are [Fe/H]i= (rms=0.03 dex, 79 stars) and [Fe/H]ii= (rms=0.08 dex, 68 objects). The very good agreement indicates a self-consistent analysis, since the ionization equilibrium for Fe is very sensitive to any possible problem in the abundance analysis. The difference we found is scarcely significant, and the star-to star scatter in the residuals is very close to the value we might expect on the basis of errors in the measurements of s, by considering that on average only three lines of Fe ii were typically used in the analysis. The distribution of the resulting [Fe/H] values and of the difference between ionized and neutral iron are shown in Figure 2 as a function of temperature, with stars coded according to the grating(s) they were observed with. There is no significant trend as a function of temperature over a range of almost four magnitudes.
The (small) scatter of the metallicity distribution is discussed in Sect.5.

| Star | Teff | [A/H] | nr | [Fe/H]i | nr | [Fe/Hii | ||||
|---|---|---|---|---|---|---|---|---|---|---|
| (K) | (dex) | (dex) | (km s-1) | (dex) | (dex) | |||||
| 100017 | 4989 | 2.54 | -1.28 | 0.81 | 5 | -1.28 | 0.076 | |||
| 100021 | 5040 | 2.61 | -1.34 | 1.10 | 11 | -1.34 | 0.168 | 2 | -1.66 | 0.163 |
| 100027 | 5112 | 2.72 | -1.28 | 1.45 | 13 | -1.28 | 0.107 | 1 | -1.53 | |
| 200004 | 4239 | 1.07 | -1.28 | 1.66 | 16 | -1.28 | 0.149 | |||
| 200006 | 4235 | 1.08 | -1.34 | 1.28 | 19 | -1.34 | 0.126 | 3 | -1.43 | 0.114 |
| 200014 | 4317 | 1.22 | -1.29 | 1.36 | 15 | -1.29 | 0.062 | |||
| 200019 | 4357 | 1.34 | -1.34 | 1.77 | 21 | -1.34 | 0.150 | 3 | -1.33 | 0.141 |
| 200024 | 4383 | 1.39 | -1.37 | 1.46 | 20 | -1.37 | 0.111 | 3 | -1.35 | 0.158 |
| 200025 | 4392 | 1.44 | -1.30 | 1.44 | 12 | -1.30 | 0.095 | |||
| 200035 | 4523 | 1.70 | -1.40 | 1.36 | 19 | -1.40 | 0.093 | 3 | -1.33 | 0.127 |
| Ratio | [A/H] | EW | tot.1 | tot.2 | ||||
| (+50 K) | (+0.2 dex) | (+0.10 dex) | (+0.10 km s-1) | (dex) | (dex) | |||
| (1) | (2) | (3) | (4) | (5) | (6) | (7) | (8) | (9) |
| Fe/Hi | +0.055 | 0.005 | 0.006 | 0.019 | 24 | +0.025 | 0.039 | 0.039 |
| Fe/Hii | 0.023 | +0.086 | +0.020 | 0.008 | 3 | +0.071 | 0.072 | 0.073 |
| O/Fe | 0.041 | +0.086 | +0.036 | +0.020 | 2 | +0.087 | 0.092 | 0.093 |
| Na/Fe | 0.018 | 0.029 | 0.004 | +0.011 | 3 | +0.071 | 0.073 | 0.073 |
4 Errors in the atmospheric parameters and cosmic scatter in Iron
Following the tested procedure of Paper I and II, we estimated individual (i.e. star-to-star) errors in the derived abundances. These errors are those relevant when discussing the internal spread of abundance within a cluster, the main aim of our study in NGC 6218.
We estimated this kind of uncertainty by considering the three main error sources, i.e. errors in temperatures, in microturbulent velocities and in the measurements of s. We will see that the effects of errors in surface gravities and in the adopted model metallicity are negligible on the total error budget. Hence, in the following we will concentrate on the major error sources.
The first step is to evaluate the sensitivity of the derived abundances for Fe, Na and O on the adopted atmospheric parameters. This was obtained by re-iterating the analysis while varying each time only one of the parameters; the amount of the variations and the resulting sensitivities are shown in Table 4, Columns from 2 to 5.
This exercise was done for all stars in the sample. The average value of the slope corresponding to the average temperature ( K) in the sample was used as representative to estimate the internal errors in abundances, when combined with realistic estimates of internal (i.e. star-to-star) errors in the atmospheric parameters, presented in the following.
Errors in temperatures.
Like we did for NGC 6752, we adopted a final Teff value from a calibration of temperature as a function of the magnitude. We adopted this procedure thanks to the very small errors produced in Teff. The nominal internal error in Teff is estimated to be about 6 K, from the adopted error in (a conservatively large value of 0.02 mag, likely overestimated, in this magnitude range) and the slope of the relation between temperature and magnitude (291 K/mag, along the RGB of NGC 6218). We would like to emphasize here that it is this internal contribution to affect the overall error budget when comparing stars in an individual cluster. Real internal errors in temperatures are likely larger than this nominal value, due to a variety of reasons (see discussion in Paper II). However, we will still adopt this nominal value in the following discussion, because use of larger values would result in expected rms scatter of abundances much larger than observed.
Errors in microturbulent velocities.
We used star 302157 and repeated the analysis changing ; the error on the micro-turbulence velocities is estimated by the change on required to vary the slope of the expected line strength vs abundances relation by 1 value555This value was derived as the quadratic mean of the 1 errors in the slope of the relation between abundance and expected line strength for all stars with more than 15 lines measured. from the original value. The corresponding internal error is 0.15 km s-1.
Errors in measurement of equivalent widths.
In order to estimate this contribution, we selected a subset of 65 stars with more than 15 measured Fe lines. The average rms scatter (0.123 dex) in Fe abundance for these stars, divided by the square root of the typical average number of measured lines (24), provides a typical internal error of 0.025 dex.
Once we have derived the internal errors we may compute the final errors in abundances; they depend on the slopes of the relations between the variation in each given parameter and the abundance. When combined with sensitivities of Table 4, the derived individual star errors for Fe amount to 0.007 dex and 0.029 dex due to the quoted uncertainties in Teff and .
Summing in quadrature these contributions with the impact of errors in s we may evaluate the expected scatter in [Fe/H] due to the most relevant uncertainties in the analysis. We derive (exp.)= dex (statistical error). The inclusion of contributions due to uncertainties in surface gravity or model metallicity does not alter our conclusions.
Total errors, computed using only the dominant terms or including all the contributions, are reported in Table 4, in Cols. 8 and 9 respectively, for iron and for the other two elements measured in this paper.
On the other hand, the observed scatter is formally (slightly) lower: (obs.)= (statistical error), obtained as the rms scatter of abundances from Fe i lines. Within the statistical uncertainties this difference is not significant, and might indicate that the errors are slightly overestimated. The conclusion from our large dataset is that the observed star-to-star rms scatter in Fe abundances in NGC 6218 is no more than 8%.
As for NGC 6752 (see Paper II), we do not find any measurable intrinsic spread in metallicity in NGC 6218, so we conclude that this cluster is very homogeneous as far as the global metallicity is concerned. The stars in our sample are well distributed over almost 5 half-mass radii: the inference is that the heavy metal content of the pristine material from which the stars formed was very well mixed at the time of stellar formation in NGC 6218. As already noted in Paper II, this is a strong constraint for any model of cluster formation.
Finally, systematic errors are not relevant within a single cluster, but could be used when comparing different GCs in the present study. Briefly, the adopted relation between temperatures and magnitude is based on Teff from dereddened , through the calibrations by Alonso et al. Hence, errors in the adopted reddening translate into systematic errors in derived temperatures.
The residual slope of the relation of Fe I abundances with excitation potential is dex/eV (rms=0.025 for individual stars). Following the approach discussed in Paper II (sect. 5.1), this difference implies an error of 0.005 mag in or 0.014 mag in . When combined with the slope K/mag of the Teff vs relation, we obtain a systematic uncertainty of 14 K for the cluster, increasing up to 25 K if we add in quadrature another contribution of a 0.02 mag error in the zero point of colour.
Errors in surface gravity might be obtained by propagating uncertainties in distance modulus (about 0.1 mag), stellar mass (a conservative 10%) and the above error of 25 K in effective temperature. The quadratic sum results into a 0.057 dex of error in . The systematic error relative to the microturbulent velocity , a quantity derived from our own analysis, was divided by the square root of the number of the observed stars, and is estimated in 0.017 km/s.
By using again the sensitivities evaluated in Table 4, we can translate the contributions of systematic errors in Teff, and to the metallicity. Summing in quadrature these contribution with the statistical error of individual abundance determinations, 0.004 dex, we end up with a total systematic error of 0.028 dex.
Note that these errorbars do not include scale errors, due e.g. to errors in the temperature scale by Alonso et al., to the adoption of the Kurucz model atmosphere grid, to departures from LTE in line formation, et cetera. However, these scale errors should have similar effects for stars in different clusters, insofar the atmospheric parameters are also similar. Moreover, second-order effects, e.g. in temperature, cannot be very large, since this would give a much larger spread than the one we observe.
Hence, on the scale we are defining throughout this series of papers, the metal abundance of NGC 6218 is [Fe/H] dex, where the first error bar refers to the individual star errors and the second one is relative to the cluster or systematic error.
5 Results: the Na-O anticorrelation
We derived abundances of O and Na from measured s. Abundances of Na could be derived for all stars but one; depending on the setup used, at least one of the Na i doublets at 5672-88 Å and at 6154-60 Å is always available. Derived average Na abundances were corrected for effects of departures from the LTE assumption according to the prescriptions by Gratton et al. (1999).
Oxygen abundances are obtained from the forbidden [O i] lines at 6300.3 and 6363.8 Å; the former has been cleaned from telluric contamination by H2O and O2 lines, following the procedure of Paper I and II. Neither CO formation nor the high excitation Ni i line at 6300.34 Å are a source of concern: low C abundances are expected, given also the rather high temperatures of our stars, and the contribution of Ni to the measured is negligible (see also Paper II).
In Table 5 we list the abundances of O and Na (the complete table is available only in electronic form). For O we distinguish between actual detections and upper limits; the number of measured lines and the rms values are also indicated. We did not try to remove cosmic rays, since the removal can be difficult and not very precise with a single exposure in each wavelength region. However, all the O measures were interactively checked on the HR13 spectra. Moreover, the Na measurements were interactively checked in all cases where discrepancies between abundances from the 2 to 4 different lines were present.
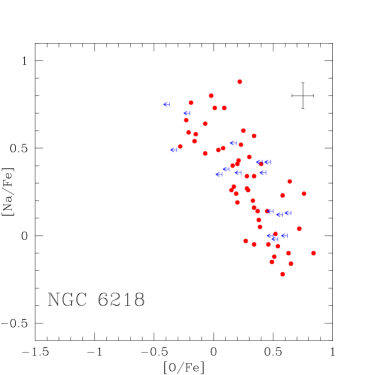
The [Na/Fe] ratio as a function of [O/Fe] ratio is displayed in Figure 3 for each of the red giant stars with both O and Na detections (filled dots) and with upper limits for [O i] (arrows). The overall random errors in O and Na, as due to the contribution of errors in the adopted atmospheric parameters and measurements of s, are also indicated.
No comparison with literature data is possible, since this is the first work to present Na and O abundances for RGB stars in this cluster.
The Na-O anticorrelation in NGC 6218 appears to be normal, without features worthy of note. In Figure 3 there is a good number of stars that appear to have the typical composition of field halo objects, high [O/Fe] and slightly less than solar [Na/Fe] ratios. In the O-poor regime, the anticorrelation is not very much extended toward extreme values, although the presence of upper limits in oxygen in the Na-rich regime hints for the possible existence of a few O-poor stars in this cluster. The overall appearance of the anomalies in Na, O is similar to that observed in other metal-intermediate GCs, such as, for instance, M 3 (Sneden et al. 2004).
On the other hand, we note that NGC 6218 deserves the full status of second-parameter cluster.
In fact, let us consider the issue of the HB morphology. M 3 is the classical template of a globular cluster, with stars uniformly distributed on a red HB, within the instability strip, and in a blue HB (HB parameter HBR = (B-R)/(B+V+R) = 0.08). NGC 6218 has almost the same metallicity ([Fe/H] dex compared to dex for M 3, on the homogeneous scale by Carretta and Gratton 1997) but shows a very different HB morphology (HBR = 0.92): there are no red or variable HB stars and only the blue part of the HB is populated, although the blue HB is not extended as those of other intermediate-metallicity clusters such as NGC 6752 or M 13 (HBR = 1.0 and 0.97, respectively).
Regarding the chemical anomalies, the Na-O anticorrelation in NGC 6218 seems rather similar to the one of M 3, but is very different from that of M 13, while the similarity of HB populations is the other way around. It is a direct inference that GCs showing the same or very similar first parameter (i.e., the metallicity) driving the HB morphology show not only the classical second-parameter effect in the distribution of stars along the HB, but also significant differences in how the chemical anomalies in their light elements show up along the giant branch.
It should obviously be noticed that NGC6218 might be substantially older than M3, possibly explaining the different mean colour of its HB. As a matter of fact, de Angeli et al. (2005) indeed found a rather large age difference between these two clusters, M3 being much younger than NGC6218. Using e.g. the data from ground based observations (available for both clusters) and the Carretta and Gratton (1997) metallicity scale, the relative ages found by de Angeli et al. are for M3 and for NGC6218. A similar age difference of some 2-3 Gyr should be large enough to explain the different mean colour of the HB.
| Star | nr | [O/Fe] | rms | nr | [Na/Fe] | rms | HR | lim |
|---|---|---|---|---|---|---|---|---|
| 100017 | 2 | 0.19 | 0.00 | 3 | ||||
| 100021 | 1 | 0.48 | 1 | 0 | ||||
| 100027 | ||||||||
| 200004 | 2 | 0.77 | 0.10 | 3 | ||||
| 200006 | 2 | 0.45 | 0.05 | 2 | 0.14 | 0.07 | 1 | 1 |
| 200014 | 2 | 0.24 | 0.02 | 3 | ||||
| 200019 | 2 | 0.34 | 0.02 | 2 | 0.57 | 0.04 | 1 | 1 |
| 200024 | 2 | 0.33 | 0.08 | 2 | 0.20 | 0.00 | 1 | 1 |
| 200025 | 2 | 0.01 | 0.06 | 3 | ||||
| 200035 | 2 | 0.34 | 0.03 | 2 | 0.16 | 0.19 | 1 | 1 |
A more direct and homogeneous comparison is possible: in NGC 6752, another GC with quite similar metallicity ([Fe/H] dex, Paper II) and age (see de Angeli et al. 2005), we analyzed a large number of stars with homogeneous procedures, atomic parameters, packages. In both clusters we sampled a range of almost four magnitudes along the red giant branch, and in both GCs the progeny of RGB stars ends up on a HB only populated on the blue side of the instability strip, with no red or variable HB stars.
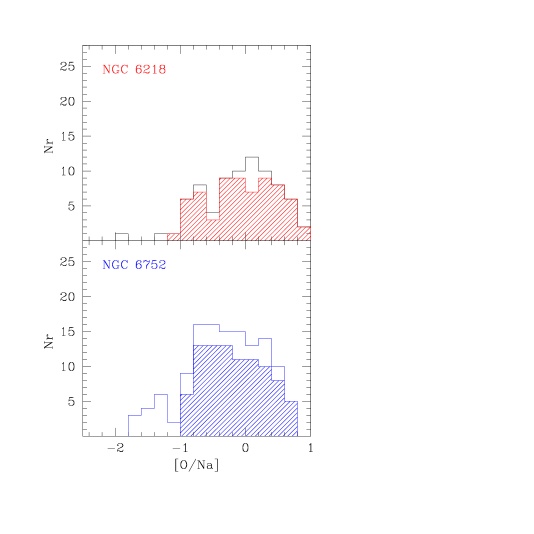
The distribution function of stars along the Na-O anticorrelation in NGC 6218 is shown in the upper panel of Figure 4. The dashed area shows the distribution obtained by using only actual detections or carefully checked upper limits; the empty histogram is derived by following the overall Na-O anticorrelation, as obtained in Paper I, in order to get [O/Fe] values even for stars with no observations in HR13. The bottom panel reproduces the same distribution for NGC 6752, taken from Paper II. The two distributions look different, and this visual impression is confirmed by a Kolmogorov-Smirnov test. In NGC 6218 the number of O-poor and Na-rich stars (with ratio [O/Na]) is roughly comparable to the number of O-rich stars, at variance with the case of NGC 6752, where there is a preponderance of stars with O-poor/Na-rich composition.
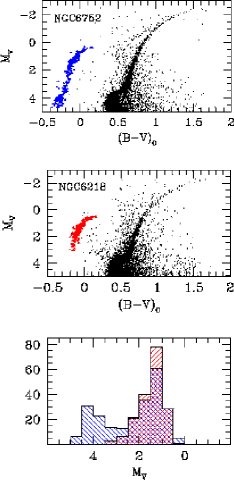
This difference in the ratios of chemical anomalies is in some way mirrored by differences in the HB morphology. As shown in Figure 5, in NGC 6752 the hot blue tail of the HB is populated down to very faint magnitudes, reaching the level of the turn-off point of the Main Sequence. On the contrary, in NGC 6218 the hottest tail of the blue HB is completely absent.
We conclude that these comparisons show that the mechanism generating the chemical anomalies in GCs is also a viable candidate as one of the possible several “second parameters” determining the morphologies of HBs in GCs, although other parameters like e.g. the cluster age, should also be taken into account.
6 The RGB-bump in the luminosity functions of He-poor and He-rich stars
| diff | |||
| NGC 6218 | |||
| +0.39 0.05 | +0.17 0.05 | +0.22 0.07 | |
| +0.22 0.04 | +0.41 0.04 | 0.19 0.06 | |
| +0.25 0.09 | 0.29 0.09 | +0.54 0.13 | |
| NGC 6752 | |||
| +0.46 0.04 | +0.34 0.04 | +0.12 0.06 | |
| +0.29 0.04 | +0.41 0.04 | 0.12 0.06 | |
| +0.24 0.07 | 0.03 0.08 | +0.27 0.11 | |
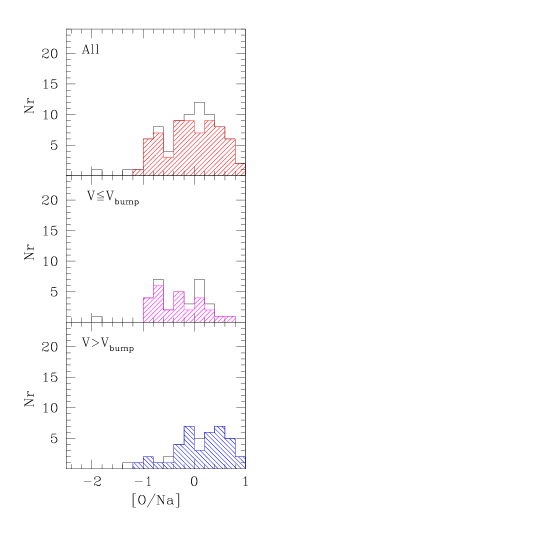
NGC 6218 is the second cluster in the present series in which we observed stars well below the magnitude of the RGB-bump, from our data. As done for NGC 6752, we separate our dataset plotting in the middle and lower panels of Figure 6 the distributions along the Na-O anticorrelation for stars brighter and fainter than the RGB bump, respectively. At variance with the case of NGC 6752, the two subsamples in NGC 6218 show distinctively different distributions. Again, this finding is confirmed by a statistical (Kolmogorv-Smirnov) test. From these distributions the abundances appear shifted towards lower [O/Fe] and higher [Na/Fe] ratios for stars brighter than the magnitude of the RGB-bump.
Is this effect the manifestation of the so-called evolutionary mechanisms at work? The presence of a well defined Na-O anticorrelation before the bump supports the primordial origin for the chemical anomalies, already amply accepted (Gratton et al. 2004). On the other hand, how can we explain why the two distributions are different? There is no good mechanism to invoke in order to produce the appearance of such an evolutionary effect. M 13 is the only other cluster in which a shift towards more Na-rich and O-poor compositions ascending along the RGB had been proposed (Pilachowski et al. 1996). However, recently Sneden et al. (2004) reached the conclusion that an evolutionary origin for these anomalies is doubtful and must be rejected also in the case of M 13.
An evolutionary contribution to the variations of lighter elements such as C and N is expected (and observed, see Smith and Martell 2003). On the other hand, it is well known that Pop. II low mass giants never reach the central temperatures required to activate the proton-capture reactions required to alter the content of heavier nuclei such as O, Na, Al, Mg (see Gratton et al. 2001). Hence, no dependence of abundances for these elements would be expected as a function of luminosity: apparently this seems at odds with what we observe in NGC 6218.
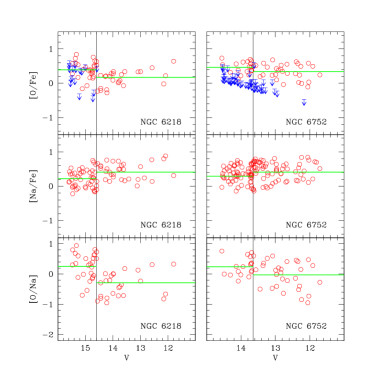
To assess further on the reality of this effect we show in Figure 7 the run of the [O/Fe], [Na/Fe] and [O/Na] ratios as a function of the magnitude both for NGC 6218 (left panels) and NGC 6752 (right panels). The vertical lines in the Figure indicate the RGB bump level, whereas the horizontal lines indicate the average values we found for the two subsamples in each cluster. These values are listed in Table 6 and are computed for [O/Fe] (and [O/Na]) by using only actual measures, excluding any stars with only an upper limit in O.
The Na abundance ratios may be regarded as a more robust indicator than O ratios, because of the presence of limits in O abundances; hence we will concentrate on the former ones.
While the differences in mean abundance ratios in NGC 6752 are not statistically significant, in NGC 6218 they are and we can notice a rather clear discontinuity at the bump level. This is more a step-like pattern than a continuous increase or decrease in Na and O, respectively, as would be expected for an evolutionary effect, like a supposed extra-mixing scenario where O-depletions and Na-enhancements become more marked as the stars climb along the RGB (but only after the RBG-bump as in the field analogs).
The overall pattern could be well described as a mild trend as a function of the magnitude (or effective temperature) superimposed to a step-like discontinuity exactly at the luminosity level of the bump in the luminosity function (LF) of the RGB. This discontinuity is more clear in NGC 6218 than in NGC 6752. What is the explanation of this apparently unexpected behavior?
The first inference is thus that the RGB-bump is involved in some way: it is unlikely that this major alteration is observable exactly at magnitude just by chance. The second certainty is that it cannot be an evolutionary effect, because the Na-O anticorrelation is present well below this luminosity.
The gentle, overall trend (an increase of about 0.1 dex in [Na/Fe] over almost 4 magnitudes in ) is likely due to the combination of two factors:
-
a)
small uncertainties in the corrections for departures from the LTE assumption (Gratton et al. 1999). These corrections are a function of temperature and we may expect that associated errors show up particularly in NGC 6218 because of the rather small internal errors in the analysis and the large range of Teff’s sampled;
-
b)
it is well known (e.g. Dalle Ore 1993) that the model atmospheres by Kurucz (1993) might not provide an accurate reproduction of the correct temperature stratification T() with respect to the real stars in the cool, low-gravity and metal-poor regime. In particular, the actual temperature gradient should be steeper, as required to better reproduce the observations. This would also be consistent with the 3-D model atmospheres including adiabatic expansion of the convective cells (see Asplund et al. 1999). A steeper gradient implies in turn that elements with low excitation potential present lines that appear stronger than expected at low temperatures. Hence, Na abundances could be slightly overestimated.
A fair estimate of the total trend due to the above effects at the metallicity of NGC 6218 is about 0.1 dex.
However, we found that apart from this trend there is a quite real effect, that can possibly be explained by different RGB-bumps on the LFs for the He-poor and He-rich components of the RGB in NGC 6218.
Very recently, Salaris et al. (2006) computed stellar models and isochrones including the metal mixtures observed in real GC stars due to the abundance anticorrelations. They investigated the effect of different degrees of chemical anomalies on cluster sequences and LFs. In particular, Salaris et al. studied the changes induced in the LF along the RGB by a varying He content of the polluting material, finding that the largest effect is at the RGB-bump region: at fixed age and metallicity, the bump becomes brighter as the He content increases, and the difference may be about 0.1 mag (of the same order of the intrinsic width of the bump itself), depending on the relative weights of the components concurring to shape the bump in the LF.
How could this finding help to explain the observed feature in NGC 6218? The main issue here is the theoretical prediction that the LFs of He-poor and He-rich stars are different. Far from the bump region we cannot notice any relevant effect. However, in the limited region bracketing , stars with high Y should have a RGB-bump brighter than the one of stars with normal Y content, due to the higher ratio Z/X.
Observationally these He-rich and He-poor components translate into O-poor/Na-rich and O-rich/Na-poor groups, because of the pattern due to pollution from matter processed in H-burning at high temperature. Thus, at the somewhat brighter magnitude of the RGB-bump of He-rich stars we should expect to find predominantly O-poor stars (hence a higher mean value of Na). On the contrary, at the fainter magnitude of the bump in the LF of He-poor stars we should observe predominantly O-rich stars (with a lower mean value of Na).
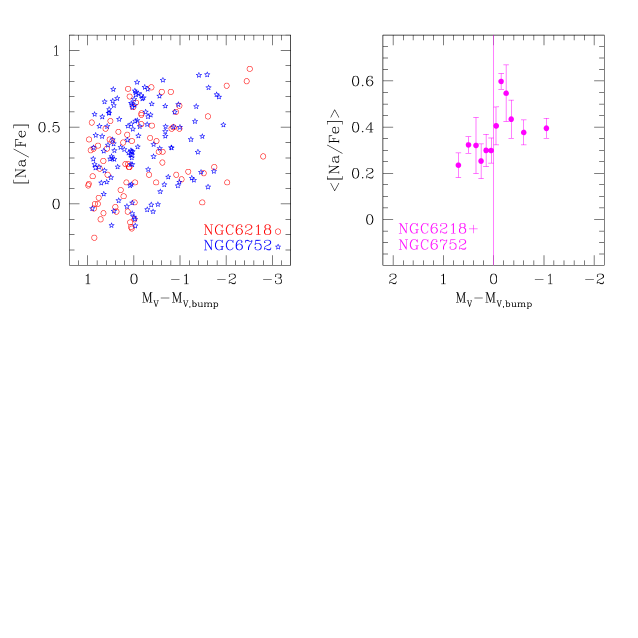
This is how we may interpret the run of [Na/Fe] in NGC 6218 (Figure 7, left panels), but another test can be made. We adopt Na as a preferred indicator, because it has no upper limits but only measured abundances available for all stars in the sample. By plotting the distribution of [Na/Fe] ratios as a function of magnitude, we should see a ”dip” just before the average RGB-bump level, in correspondence to the peak in the LF of He-poor stars, followed by the bump at brighter magnitude due to the peak in the distribution of He-rich/Na-poor stars.
We try to see if this is true in Figure 8. To alleviate the problem of small number statistics, we summed the samples in NGC 6218 (the present work) and in NGC 6752 (Paper II). We feel justified in this approach because the two clusters were studied by using a very homogeneous procedure. In the left panel of Fig 8 we show the run of [Na/Fe] for both clusters; to take into account the different absolute magnitudes of the bumps in the two GCs because of the different metallicities we normalize the of the individual stars to the bump ones (+0.41 and +0.58 in NGC 6752 and NGC 6218, respectively). In the right panel we plot the average [Na/Fe] ratios as a function of absolute magnitude. The results are in fair agreement with the theoretical predictions, taking also into account the fact that the inclusion of NGC 6752 should somewhat smear the effect, since the maximum ”signal” in this kind of plot is obtained when the balance of the two different components is about 50-50%. In NGC 6752 a large fraction of stars seems to be part of the O-poor component, as evident from Figure 4 and from the fact that the majority of unevolved stars are found to be very N-enriched by Carretta et al. (2005). On the other hand, NGC 6218 would be better suited for testing the prediction by Salaris et al. (2006), since in this case we are comparing almost “pure” populations, equally divided in O-poor and O-rich components, but we had to compromise between enhanced signal and smaller numbers.
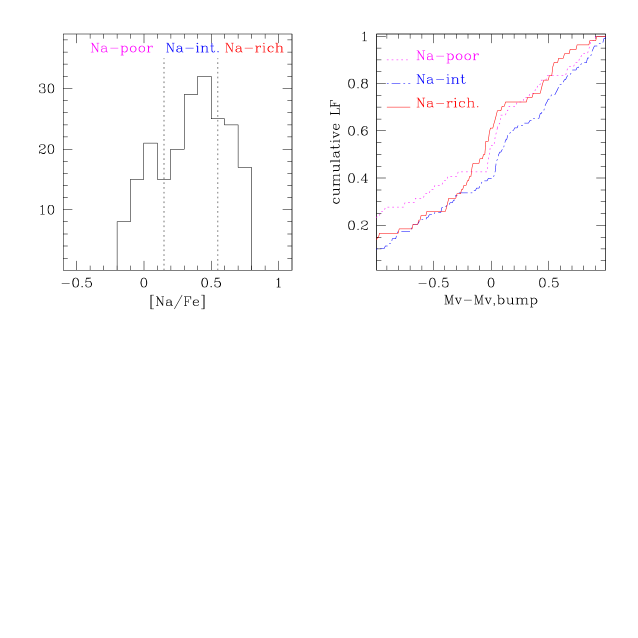
We decided to try to have a direct look at the LFs of the Na-rich and Na-poor populations. We corrected our [Na/Fe] abundances for the small trend with temperature to eliminate any residual spurious effect. We divided our stars in three subsamples, indicated in the left panel of Fig. 9: Na-poor, Na-intermediate and Na-rich. We computed the cumulative LFs (normalized to the number of stars in the three subsamples) and the part near the RGB-bump is shown in the right panel of the same figure. It appears that the Na-rich components has a slightly brighter RGB-bump level, while the Na-poor and Na-intermediate have fainter, very similar levels. The differences are difficult to appreciate from our smallish sample, but we estimate them to be about 0.05 mag between the Na-rich stars and the others. From Salaris et al. (2006) we estimate the dependence of the RGB-bump magnitude from helium abundance to be of about 0.01 mag for each 0.01 variation in Y. Hence, 0.05 magnitudes between the bumps would translate into an enhancement of about 0.05 of Y (i.e., Y 0.30 compared to a normal Y = 0.25) for the Na-rich population, while the Na-intermediate stars do not appear to have a noticeably different Y.
We conclude that for the first time to our knowledge it is possible to actually observe the signature of the existence of distinct populations of stars with different He content in globular clusters only using stars on the RGB. That means to be able to independently constrain HB models. Admittedly, our evidence is not conclusive, due to the limited statistics, but the first step in this direction is encouraging. When our sample of GCs will be entirely analyzed, we will have several other clusters with datasets of stars bracketing the RGB-bump and a higher statistical significance of the plots in Figs 8 and 9 will be available. Interestingly, Caloi & D’Antona (2005) interpreted an RGB clump brighter in M 13 than in M 3 as a possible indication of a different (increased) He content in M 13.
7 Anticorrelation and orbital parameters
In the previous section we have seen that NGC 6218 is a classical second-parameter cluster regarding the HB morphology, shows a Na-O anticorrelation well defined although not extreme, and possibly presents a significant difference in the average abundance ratios below and above a discontinuity at the level of RGB-bump, the likely signature of the presence of two distinct stellar components formed with different He content.
The only other peculiarity known for this cluster concerns its mass function. Recently De Marchi et al. (2006, hereinafter DMPP) found that the mass function (MF) in NGC 6218 is surprisingly flat. The difference with most other GCs is that the flattening of the MF is observed near the cluster half-mass radius, whereas this kind of flat MF is typically found in the core of GCs and is ascribed to relaxation and mass segregation. By analogy with other clusters showing a flat or dropping MF near the half-mass radius (namely, NGC 6712 and Pal 5), well known to be subjected to severe tidal stripping of low mass stars due to repeated interaction with the Galactic potential well, DPMM suggested that the observed MF in NGC 6218 must be the result of severe loss of low mass stars in this cluster too.
Our observed sample is located just around and beyond the half-mass radius of the cluster and we may try to see if there is a relationship between the dynamical history of NGC 6218 and the observed chemical anomalies. In order to answer this question we need to better quantify the relevance and extension of these anomalies. Very recently Carretta (2006) proposed the interquartile range (IQR) of a distribution of abundance ratios as an optimal tool to quantitatively define the extension of chemical inhomogeneities within a cluster and in comparison with other clusters. Following his procedure, we computed the IQR([O/Na])=+0.80 along the Na-O anticorrelation in NGC 6218.
This value is very well correlated with the analogous quantity for the Mg-Al anticorrelation (see Carretta 2006, figure 11, left panel), hence it is a quite good quantitative estimate of the amount of chemical variations in a cluster. The same IQRs can be computed for the [O/Fe] and [Na/Fe] ratios.
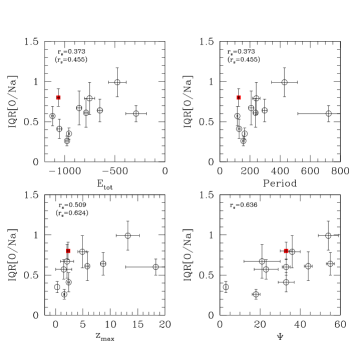
Armed with these useful tools, we explored the relationship between chemical anomalies and structural parameters, as done by Carretta (2006). Adding our values for NGC 6218 we confirm that the spread in the various distributions does not seem to depend directly on the HB type. There seems to be a trend for increasing spread as the cluster mass increases and a more visible trend for the extension of chemical anomalies to increase with increasing ellipticity of the cluster.
However, Carretta (2006) discovered that the shape of clusters -represented by the ellipticity- is strictly related to their orbital features, and in turn this lead for the first time to the discovery of correlations between chemical anomalies and orbital parameters in GCs. Our study confirms (see Fig. 10) once more his finding: the IQR([O/Na]) of NGC 6218 follows the correlations with orbital parameters such as the total energy , the period P of the cluster orbit in the Galaxy, the maximum height above the plane and the inclination angle with respect to the Galactic plane. The orbital parameters are taken from Dinescu et al. (1999) for all clusters, for consistency.
All these relations must be interpreted as a frozen snapshot of the initial conditions (both in chemistry and in kinematics) existing at the epoch of the major star formation in the GCs, since the derived orbital characteristics are the results of averages over several orbital periods. What these correlations are telling us is simply that clusters (or proto clusters) formed more away from the Galactic plane and left relatively undisturbed afterwards have more chances to efficiently retain their gas and to develop a more extended distribution along the Na-O anticorrelation.
NGC 6218 joins to this pattern. Its currently observed mass is about one fifth of the original, according to DMPP. This suggests that:
-
i)
the global anticorrelation must be a phenomenon established early in the cluster history and widespread over the bulk of cluster stars, since it is still fully observed even if the majority of the cluster mass has likely been lost following gravitational shocking and tidal stripping
-
ii)
the average orbital parameters are very useful to keep tracks of the original conditions existing at the moment of cluster formation and during the early evolution, insensitive of the changes due to the repeated interactions with the major sources of gravitational shocking. This likely happens because the time interval between the very first stellar generation and the formation of the second one in a cluster (about 108 yrs) is of the same order of magnitude of a single orbital period.
8 Summary
In this paper we have derived atmospheric parameters and elemental abundances of Na and O for 79 red giant stars in the globular cluster NGC 6218 observed with the multifiber spectrograph FLAMES.
Atmospheric parameters for all targets were obtained from the photometry. From the analysis of the GIRAFFE spectra we derived an average metallicity [Fe/H] dex (random and systematic errors) (with an rms=0.03 dex, 79 stars), without indication of intrinsic star-to-star scatter. The errorbars do not include systematic effects common to all clusters analyzed in this series of papers.
The [Na/Fe] versus [O/Fe] ratios follow the well known Na-O anticorrelation, as in all other GCs examined so far, but a few considerations are due.
In particular, the Na and O distribution does not resembles that of NGC 6752, another intermediate-metallicity cluster with a blue HB morphology: in NGC 6752 the star distribution is skewed toward a predominance of O-poor/Na-rich stars, whereas in NGC 6218 O-poor and O-rich stars seem to be represented in almost equal proportion.
We found that the distributions for stars fainter and brighter than the RGB-bump in NGC 6218 are statistically different, with brighter stars showing on average a higher Na and a lower O content. Moreover, a step-like feature in the abundance ratios distribution at the bump level is clearly present in NGC 6218, and much less evident in NGC 6752. We interpret this behavior as the expected predictions by Salaris et al. (2006) that luminosity functions of He-rich and He-poor stars are distinctively different in the RGB-bump region. Adding together data for [Na/Fe] ratios in both NGC 6752 and NGC 6218 to gain in statistical significance, we detected for the first time the different bumps in the LFs of the stellar components formed with different initial He content in GCs.
Notwithstanding its peculiar mass function and the supposed loss of about four-fifths of the original mass, NGC 6218 seems to follows the correlations found by Carretta (2006) between the orbital parameters and the extension of the chemical anomalies in GCs.
In the future we will continue the analysis of the other clusters in our sample, progressively adding more and more stars observed in the RGB-bump region. The goal of obtaining very accurate luminosity levels for the peak of the distributions of He-rich and He-poor stars in GCs is thus within reach: in turn, this will allow us to estimate quantitatively the degree of He-enrichment in cluster stars, a precious constraint to evolutionary stellar models of intermediate mass AGB-stars and to the modeling of the birth and early evolution of the globular clusters.
Acknowledgements.
This publication makes use of data products from the Two Micron All Sky Survey, which is a joint project of the University of Massachusetts and the Infrared Processing and Analysis Center/California Institute of Technology, funded by the National Aeronautics and Space Administration and the National Science Foundation. This work was partially funded by the Italian MIUR under PRIN 2003029437. We also acknowledge partial support from the grant INAF 2005 “Experimental nucleosynthesis in clean environments”.References
- (1) Alonso, A., Arribas, S. & Martinez-Roger, C. 1999, A&AS, 140, 261
- (2) Alonso, A., Arribas, S. & Martinez-Roger, C. 2001, A&A, 376, 1039
- (3) Asplund, M.,Nordlund, Å., Trampedach, R., & Stein, R. F. 1999, A&A, 346, L17
- (4) Bragaglia, A., Carretta, E., Gratton, R.G. et al. 2001, AJ, 121, 327
- (5) Brodie, J. P., & Hanes, D. A. 1986, ApJ, 300, 258
- (6) Buonanno, R., Buscema, G., Corsi, C.E., Ferraro, I., & Iannicola, G. 1983, A&A, 126, 278
- (7) Buonanno, R., Corsi, C., Bellazzini, M., Ferraro, F. R., & Pecci, F. F. 1997, AJ, 113, 706
- (8) Buonanno, R., & Iannicola, G. 1989, PASP, 101, 294
- (9) Caloi, V., & D’antona, F. 2005, A&A, 435, 987
- (10) Cardelli, J.A., Clayton, G.C., & Mathis, J.S. 1989, ApJ, 345, 245
- (11) Carretta, E. 2006, AJ, 131, 1766
- (12) Carretta, E., Gratton R.G., Lucatello, S., Bragaglia, A., Bonifacio, P. 2005, A&A, 433, 597
- (13) Carretta, E., Bragaglia, A., Gratton R.G., Leone, F., Recio-Blanco, A., Lucatello, S. 2006a, A&A, 450, 523 (Paper I)
- (14) Carretta, E., Bragaglia, A., Gratton R.G., Lucatello, S., & Momany, Y. 2006b, A&A, in press (Paper II)
- (15) Cayrel, R. 1986, A&A, 168, 8
- (16) Charbonnel, C. 1994, A&A, 282, 811
- (17) Cohen, J.G. & Melendez, J. 2005, AJ, 129, 303
- (18) Dalle Ore, C.M. 1993, Ph.D. thesis, University of California, Santa Cruz
- (19) De Angeli, F., Piotto, G., Cassisi, S., Busso, G., Recio-Blanco, A., Salaris, M., Aparicio, A., & Rosenberg, A. 2005, AJ, 130, 116
- (20) De Marchi, G., Pulone, L., & Paresce, F. 2006, A&A, 449,161
- (21) Denissenkov, P.A., Weiss A.
- (22) Dinescu, D. I., Girard, T. M., & van Altena, W. F. 1999, AJ, 117, 1792
- (23) Gratton, R.G., Carretta, E., Eriksson, K., & Gustafsson, B. 1999, A&A, 350, 955
- (24) Gratton, R.G., Bonifacio, P., Bragaglia, A., et al. 2001, A&A, 369, 87
- (25) Gratton, R.G., Bragaglia, A., Carretta, E., Lucatello, S., Momany, Y., Pancino, E., & Valenti, E. 2006, A&A, in press
- (26) Gratton, R.G., Sneden, C., & Carretta, E. 2004, ARA&A, 42, 385
- (27) Gratton, R.G., Sneden, C., Carretta, E., & Bragaglia, A. 2000, A&A, 354, 169
- (28) Gratton, R.G., Carretta, E., Claudi, R., Lucatello, S., & Barbieri, M. 2003, A&A, 404, 187
- (29) Hargis, J. R., Sandquist, E. L., & Bolte, M. 2004, ApJ, 608, 243
- (30) Harris, W. E. 1996, AJ, 112, 1487
- (31) Jasniewicz, G., de Laverny, P., Parthasarathy, M., Lèbre, A., & Thévenin, F. 2004, A&A, 423, 353
- (32) Johnson, C. I., & Pilachowski, C. A. 2006, AJ, 132, 2346
- (33) Klochkova, V. G., & Samus, N. N. 2001, A&A, 378, 455
- (34) Kraft, R.P. 1994, PASP, 106, 553
- (35) Kurucz, R.L. 1993, CD-ROM 13, Smithsonian Astrophysical
- (36) Magain, P. 1984, A&A, 134, 189
- (37) Mishenina, T. V., Panchuk, V. E., & Samus’, N. N. 2003, Astronomy Reports, 47, 248
- (38) Momany, Y., Bedin, L.R., Cassisi, S. et al. 2004, A&A, 420, 605
- (39) Paltrinieri, B., Ferraro, F.R., Paresce, F., & De Marchi, G. 2001, AJ, 121,3114
- (40) Pasquini, L. et al. 2002, The Messenger, 110, 1
- (41) Pritzl, B. J., Venn, K. A., & Irwin, M. 2005, AJ, 130, 2140
- (42) Pilachowski, C.A., Sneden, C., Kraft, R.P., Langer, G.E. 1996, AJ, 112, 545
- (43) Ramirez, S. & Cohen, J.G. 2003, AJ, 125, 224
- (44) Robin, A.C., Reylé, C., Derrière S., & Picaud, S. 2003, A&A, 409, 523
- (45) Rosenberg, A., Saviane, I., Piotto, G., & Aparicio, A. 1999, AJ, 118, 2306
- (46) Rutledge, G. A., Hesser, J. E., & Stetson, P. B. 1997, PASP, 109, 907
- (47) Sabbi, E. et al. 2006, in preparation
- (48) Salaris, M., Weiss, A., Ferguson, J.W., Fusilier, D.J. 2006, astro-ph/0604137
- (49) Salaris, M., Riello, M., Cassisi, S., & Piotto, G. 2004, A&A, 420, 911
- (50) Skrutskie, M.F. et al. 2006, AJ, 131, 1163
- (51) Smith, G.H., Martell, S.L. 2003, PASP, 115, 1211
- (52) Sneden, C., Kraft, R.P., Guhathakurta, P., Peterson, R.C., Fulbright, J.P. 2004, AJ, 127, 2162
- (53) Ventura, P. D’Antona, F., Mazzitelli, I., & Gratton, R. 2001, ApJ, 550, L65
- (54) Zinn, R, & West, M.J. 1984, ApJS, 55 45