Imaging algorithms in radio interferometry
1 Introduction
Unlike an optical telescope, the basic measurements of a radio interferometer (correlations between antennas) are indirectly related to a sky brightness image. In a real sense, algorithms and computers are the lenses of a radio interferometer. In the last 20 years, whereas interferometer hardware advances have resulted in improvements of a factor of a few, algorithm and computer advances have resulted in orders of magnitude improvement in image quality. Developing these algorithms has been a fruitful and comparatively inexpensive method of improving the performance of existing telescopes, and has made some newer telescopes possible. In this paper, we review recent developments in the algorithms used in the imaging part of the reduction process.
What constitutes an ‘imaging algorithm’? Whereas once there was a steady ‘forward’ progression in the reduction process of editing, calibrating, transforming and, finally, deconvolving, this is no longer true. The introduction of techniques such as self-calibration, and algorithms that go directly from visibilities to final images, have made the dividing lines less clear. Although we briefly consider self-calibration, for the purposes of this paper calibration issues are generally excluded. Most attention will be directed to the steps which form final images from the calibrated visibilities.
2 The van Cittert-Zernike equation
To set the framework, we briefly summarize the fundamental theory of radio interferometric imaging. See Thompson et al. [1986] or Perley et al. [1989] for comprehensive descriptions.
Assuming a quasi-monochromatic, spatially incoherent source, the response of an interferometer is given by the van Cittert-Zernike equation:
| (1) |
Here is the spacing (the distance between antenna pairs measured in wavelengths) and are direction cosines of the brightness distribution with respect to this coordinate frame (note that ). The coordinate system is defined such that the -axis points in the direction of the source.
The van Cittert-Zernike equation indicates that the complex-valued visibility function, , is a Fourier-like integral of the sky brightness, , multiplied by the primary beam response of an interferometer, , and . Most radio interferometric telescopes have more than two antennas, and so multiple spacings can be made simultaneously. Indeed for antennas, spacings can be measured. Additionally, as the coordinate system is one fixed on the sky, the Earth’s spin causes the measured spacings to rotate during a synthesis. Thus a good coverage in the domain can be achieved. Further coverage can be gained by physically moving the antennas.
For a number of reasons (mainly computational simplicity) it has been conventional to make a small field assumption, i.e. . In this case, ignoring the primary beam term, the van Cittert-Zernike equation becomes independent of and , and reduces to a two-dimensional Fourier transform:
| (2) |
The primary beam term can be ignored – its effect can be subsumed into the estimate of the sky brightness, and can be corrected for during the analysis stage of the final image. Historically, this two-dimensional relationship has been adequate (or tolerated!) for nearly all radio interferometric imaging. Using this relation for imaging is the conventional approach. However, much recent research has been devoted to devising ways of avoiding the assumptions and approximations in this formulation, and thus avoiding errors or allowing larger fields to be imaged.
In this context, this paper can be roughly divided into two parts. The first part briefly reviews conventional imaging and discusses some recent refinements. The second part addresses recent research to extend imaging beyond the small-field approximation. The two parts are far from mutually exclusive. The extensions are invariably based on the conventional approach in some way. Consequently, refinements in the conventional approach flow immediately through to the extensions.
3 Conventional imaging
Whereas Equation (2) suggests that an inverse two-dimensional Fourier transform will recover a sky brightness, in practice the visibility function is sampled at only a discrete set of points, . So the inverse transform must be approximated by
| (3) |
Here is a weight assigned to each visibility measurement (discussed below), and is called the dirty image. In practice, direct implementation of Equation (3) is rarely done – the Fourier transform operation is usually implemented with FFTs. As this requires the visibilities to be on a regular rectangular grid, a gridding step is required. This is usually done by convolving the visibilities with a particular function and resampling the result at the FFT grid points (other techniques have been used; see Thompson and Bracewell, 1974). The convolving function is chosen to suppress the aliased power in the image. See Sramek and Schwab [1989] for details.
We define the dirty (or synthesized) beam, , as the image that results after replacing by 1 in the Fourier transform step. The dirty beam is the response of a point source at the phase centre. Provided Equation (2) is an adequate approximation, the dirty image will be the convolution of the true sky brightness with the dirty beam,
| (4) |
That is, the dirty beam is the shift-invariant point-spread function (PSF) of the imaging system. In later Sections, where deviations from Equation (2) are considered, the true PSF will differ from the dirty beam.
The following Sections consider recent research in weighting the visibility data before the Fourier transform step, and in the deconvolution algorithms used to estimate the true sky brightness from the dirty images.
3.1 Weighting
Weighting by in the Fourier transform operation is required to account for the different sampling densities in the Fourier plane. Although there are variants [see Sault, 1984; Sramek and Schwab, 1989], there are two traditional approaches:
-
•
Natural weighting is used to maximize point-source sensitivity in the dirty image. Here the visibility weight is inversely proportional to the noise variance of the visibility.
-
•
Uniform weighting is used to minimize sidelobe levels. The weights are inversely proportional to a local density function.
In the usual case where there is an excess of shorter spacings, natural weighting produces significantly poorer dirty beam shape and resolution than uniform weighting. Conversely the noise variance in a uniformly weighted dirty image will typically be a factor of a few worse than the naturally weighted image.
Briggs [1995] has developed a new scheme for weighting visibilities, called robust weighting, which can offer a significant improvement. This scheme minimizes the expected rms difference (either as a result of sidelobes or noise) between the dirty image and the true sky for a point source. It is closely related to the Wiener minimum mean-squared error criteria. For high values of the sampling density function or if the signal-to-noise ratio is very good, robust weighting reduces to uniform weighting. Conversely, in sparsely sampled regions of the visibility function or for poor signal-to-noise ratio, it reduces to natural weighting – this prevents excessive noise amplification.
To some extent, robust weighting combines the best of both natural and uniform weighting. It can reduce the noise in an image, compared to uniform weighting, without much loss of resolution. For example, for a full-track VLA observation, it can reduce the noise by 25%, while the width of the beam increases by only 3%. In cases such as unbalanced VLBI arrays, the improvement in noise can be as significant as a factor of 2, with a loss of resolution of only about 15%. An example for the ATCA is given in Figure 1.

3.2 Deconvolution
The most commonly used approaches to deconvolving the dirty image fall into two groups – CLEAN algorithms and maximum entropy methods (MEM).
The original CLEAN algorithm was introduced by Högbom [1974; see also Schwarz, 1978, 1979 and Cornwell and Braun, 1989]. In the basic CLEAN algorithm the maximum, in absolute value, in the dirty image is located. Assuming that this peak is the result of a point source, a scaled version of the dirty beam (i.e. the response of a point source) is subtracted from the dirty image at this location and the amount subtracted is stored in a component image. For a uniformly weighted image, this procedure is the optimum approach (in a least-squares sense) to locating a point source. This process is repeated on the residual image until the maximum residual is below a certain cut-off level. The scale of the dirty beam subtracted is equal to the maximum in the image, multiplied by a relaxation factor (called the loop gain). This procedure results in a sky model consisting of a set of point sources (components) and a residual image. Because CLEAN’s extrapolation of spatial frequencies beyond the maximum spacing is often unreliable, the image that astronomers usually analyse goes through a ‘restore’ step. This consists of summing the residuals and convolving the component image with a Gaussian (the Gaussian FWHM is chosen to match the dirty beam FWHM).
A number of variants on the basic CLEAN algorithm have been suggested, either to improve its efficiency or to alleviate some of its shortcomings. For example, CLEAN spends much time needlessly checking small residuals and shifting and scaling the dirty beam. To improve efficiency, Clark’s [1980] variant considers only a list of the largest residuals as candidate positions and also uses only a small portion of the dirty beam (the beam-patch) to subtract components. After a certain number of iterations, the errors in the residuals introduced by this approximation are eliminated by doing a proper convolution of the current component image with the dirty beam (implemented with Fourier transforms), and subtracting the result from the dirty image. W. D. Cotton and F. R. Schwab (reported in Schwab [1984]) take this one step further. They re-evaluate the residuals by subtracting the components directly from the visibility data and then re-transforming the residual visibilities. In this way aliasing because of the convolutional gridding is almost eliminated. It also allows deconvolving multiple sub-fields in the primary beam simultaneously (i.e. only the relevant sub-fields need to be imaged if the primary beam is sparsely filled with emission).
The second deconvolution approach is based on MEM. Since only a limited region of the -plane is sampled, an infinite number of images are consistent with the measurements. The maximum entropy principle suggests that the ‘best’ of these images to select is that which maximizes the entropy while being consistent with the measured data. Several forms for entropy have been suggested, although most of the proposed forms give similar results for most practical applications. The original form suggested in radio astronomy [Ables, 1974; Gull and Daniell, 1978] is
| (5) |
See Cornwell and Braun [1989] and Narayan and Nityananda [1986] for more details.
To some extent, CLEAN and MEM are complementary in their application. CLEAN performs well on small, compact sources, while MEM does better on extended sources. Partly because CLEAN is much easier to understand intuitively and is more robust, it is more widely used by radio astronomers than MEM.
However, CLEAN does not perform well on very extended sources. Moreover, if the dirty beam has strong sidelobes, CLEAN can introduce corregations in the deconvolved image [Cornwell, 1983; Schwarz, 1984; Steer et al., 1984]. These appear because artificial peaks are created by the sidelobes of the dirty beam subtracted at a nearby position. Severe problems can also be caused by missing short baseline information. A very extended source can have most of its flux at baselines shorter than the one measured. The only correct way to handle this is to measure this short- and zero-spacing information (see Section 5), but this is not always feasible and one has to try to solve the problem in the deconvolution process. The missing information causes the zero level in the image to vary with position (commonly referred to as the negative bowl). CLEAN is not able to make acceptable images from these kinds of data.
Smoothing the dirty image to lower resolution partly helps to overcome some of these problems, but at the expense of loss of information. Multi-resolution approaches have been suggested [Wakker and Schwarz, 1988; Starck et al., 1994; Brinks and Shane, 1984] that take advantage of smoothing, but retain the fine-scale structure in the image. Wakker and Schwarz [1988] have developed the so-called Multi-Resolution CLEAN (MRC) algorithm. Here the dirty image is smoothed and the difference between the original and the smoothed dirty image is made. Both the smoothed and the difference image are deconvolved separately (with the appropriate smoothed- and difference dirty beams), which ensures that the fine-scale structure is retained.
A similar approach is given by Starck et al. [1994]: dirty images of different resolution ranges are made using a wavelet transform and these images are deconvolved and restored in a way similar to MRC. The wavelet formalism provides a more rigorous framework for the multi-resolution approach.
Another approach to the deconvolution problem is to formulate it as a linear system of the form
| (6) |
and then use algebraic techniques to solve this system. The elements of contain samples of the dirty beam, the elements of are samples of the dirty image, while contains the components of the reconstructed image. Without any additional constraints, the matrix is singular; additional information has to be added to find a solution. Assumptions that regularize the system include positivity and compact support of the source. An algebraic approach is not new in itself [e.g. Andrews and Hunt, 1977], but practical applications of such techniques on problems of the size met in radio astronomy have become feasible only recently.
One approach for solving the linear system is by using a technique called Non-Negative Least Squares (NNLS). NNLS belongs to the class of least-squares problems with linear inequality constraints [Lawson and Hanson, 1974]. In this case, the inequality constraints enforce positivity of the source brightness. Applying NNLS to deconvolution in radio astronomy has been studied in detail by Briggs [1995]. One feature of NNLS is that it finds a direct solution, in contrast to iterative techniques such as CLEAN or MEM.
Although NNLS has its limitations, it performs very well for a certain range of problems: it does well on compact sources, sources that are too extended for CLEAN and too small for MEM to be handled properly. NNLS reproduces the sources with high fidelity, so it works very well as part of a self-calibration loop. This is related to the fact that NNLS zeros the residuals in the dirty image nearly completely. NNLS does have the tendency, like CLEAN, to compact flux. As with CLEAN, a ‘restore’ step is advisable before analysis. Interestingly, NNLS can deconvolve an image from the sidelobes alone, as long as it knows where the source is supposed to be.
Lannes et al. [1994] present another technique based on a least-squares approach where support information is used to regularize the algorithm. Again a linear system similar to that mentioned above is solved, but using a technique which iterates between the and image plane. Unlike CLEAN and NNLS, a ‘restore’ step is not required. Their technique suppresses excessive extrapolation of higher spatial frequencies during the deconvolution.
3.3 Self-Calibration
Self-calibration has proved a very powerful technique in improving the ultimate image quality. It is also intimately coupled to some imaging algorithms. Thus, despite its being somewhat outside the umbrella of ‘imaging’, some discussion of self-calibration is warranted. Comprehensive reviews of self-calibration are given by Pearson and Readhead [1984] and Cornwell and Fomalont [1989].
Because of differential changes in atmospheric delays to different antennas and because of amplitude and phase drifts in the signal paths to the antennas, the measured visibility, , will be related to the true visibility, , by a complex-valued gain. Because these effects are antenna-based, the overall gain factor can be decomposed into two antenna-based gains, and , i.e.
| (7) |
These gains need to be estimated and the measured visibility corrected before the imaging stage. Although regular observations of a calibrator source are normally used to determine the antenna gains, temporal and spatial variations in the atmosphere and instrument mean that this approach is limited.
The self-calibration technique has been very successful in solving this problem: the source under study is used as its own calibrator. Although this at first appears unlikely, its validity rests on a number of principles.
-
1.
Despite antenna gain errors, the data contain good observables. The best known of these is closure phase, which is the sum of the visibility phases around a triangle. It is trivial to show that this is independent of the antenna gains, i.e.
(8) is a good observable.
-
2.
Whereas there are only antenna gains, there are potentially baselines. Hence the number of unknown antenna gains is often significantly smaller than the number of visibilities.
-
3.
Good a priori information is available on the source, such as compact support and positivity.
Although Jennison [1951, 1958] used the closure phase relationship quite early, it was not until it was rediscovered in the 1970s [e.g. Readhead et al., 1980; Readhead and Wilkinson, 1978] that its use became widespread. Schwab [1980] and Cornwell and Wilkinson [1981] further developed the technique into what is now known as self-calibration. See Ekers [1983] for a historical prospective.
The first step in a normal self-calibration is to generate a model of the sky. This is usually done by deconvolving a dirty image (which, in turn, was made with the best current estimate of the antenna gains). From this sky model, model visibilities (i.e. the visibilities that would have been measured if the sky model were correct) can be generated. These are then used to find new antenna gains that minimize the difference between the model and measured visibilities. For example, for model visibilities ,
| (9) |
is minimized. Gain solutions are assumed to remain valid over periods of seconds to hours, depending on physical conditions.
We consider here two more recent contributions to self-calibration theory.
3.3.1 Joint redundancy/self-calibration
Redundancy calibration [Noordam and de Bruyn, 1982], like self-calibration, determines antenna gains directly from the source observations. However, redundancy calibration requires that a certain set of the different baselines actually measure the same spacing, i.e. some baselines are redundant. Redundancy also minimizes Equation (9), except that the summation is over only the redundant baselines, and the model visibility function is also an unknown: redundancy calibration is model independent. The cost of this model independence is that, because several baselines are used to measure the one spacing, coverage suffers.
Another shortcoming of redundant calibration is that it uses only a subset of the baselines (the redundant ones) when determining antenna gains. If some of these baselines are particularly noisy, subject to interference, or otherwise faulty, the redundant solution can be poor. Wieringa [1991, 1992] presented a joint self-calibration/redundancy approach which minimizes Equation (9). For the redundant baselines, the model visibility is treated as an unknown, whereas for the non-redundant ones, the model visibility is derived from the sky model. Wieringa concluded that this gives superior performance. He also presented an interesting analysis of the merits of redundancy and self-calibration and concluded that redundancy is probably useful only for arrays with about 10 to 20 antennas.
3.3.2 Imaging weak sources with poor phase stability
Self-calibration is applicable only when the signal-to-noise ratio in a self-calibration solution interval is greater than about 5. Attempting to self-calibrate noisier data will result in a significant noise bias: self-calibration will ‘phase up’ the noise to resemble the model. Cornwell [1987] noted the relationship between the optical imaging technique of “speckle masking” [e.g. Weigelt and Wirnitzer, 1983; Lohmann et al., 1983; Lohmann and Wirnitzer, 1984; Weigelt, 1991] and closure phase in radio astronomy. In the radio interferometric context, speckle masking integrates the quantity
| (10) |
These three visibilities form a closure triangle. Their product is independent of atmospheric phase, and the phase of the product is the closure phase of the source. Integrating allows a good measure of this to be determined. This technique has found widespread application in the optical and infrared speckle interferometry and aperture-synthesis communities [e.g. Haniff et al., 1987; Nakajima et al., 1989; Gorham et al., 1989]. However, its use at radio wavelengths has been limited because of the narrow range of the regime of signal-to-noise ratio in the radio where it is the appropriate method (it is applicable for signal-to-noise ratios of about 0.5 to a few). Additionally because of the techniques computational expense and as interferometers are usually non-redundant, it is applicable for simple compact objects only.
4 Wide bandwidth effects
The van Cittert-Zernike equation assumes quasi-monochromatic radiation, or essentially that the observing bandwidth is small. When the bandwidth is significant, interferometers experience ‘bandwidth smearing’ (a chromatic aberration). This smearing is readily interpreted in the Fourier plane. For a given antenna separation, the coordinate will be proportional to frequency. Hence different frequencies within the bandwidth correspond to different, radially distributed, coordinates. The measured correlation is the integral of the visibility function over these. That is, the correlation measures a radial smeared visibility function. This radial smearing in the visibility plane corresponds to a radial smearing in the image plane, with the smearing being proportional to the fractional bandwidth, , and the distance from the delay-tracking centre, . Thus the effect is unimportant for narrow bandwidths or near the centre of the field of view. However, the smearing can be quite significant in wide-field images. See Cotton [1989] and Bridle and Schwab [1989] for general discussions.
Clark [1975] noted that appropriate change of coordinates (from to a polar coordinate system, and then taking the logarithm of the radius) converts the smearing to a convolution, and so can be handled by a number of deconvolution algorithms. Such an approach has a number of problems, and does not appear to have been tried in practice. Small amounts of bandwidth smearing can be approximately handled in a Cotton-Schwab-like CLEAN algorithm [e.g. see Condon et al., 1994 for one approach]. Alternatively, Waldram and McGilchrist [1990] used another CLEAN-based approach. Bandwidth smearing can be seen as an imaging system with a position-variant PSF (the true PSF is just the normal dirty beam at the phase centre, but becomes a more smeared version of this as increases). Waldram and McGilchrist CLEAN with the true PSF, which they compute (at least approximately) as a function of position.
The best approach is to solve the problem in hardware: the smearing in the plane can be reduced by breaking the passband into a number of channels. Correlations are then formed between corresponding channels. Each channel correlation is then treated as a distinct visibility with its own coordinate. This reduces the bandwidth smearing to that proportional to the width of each channel, not the total bandwidth.
Imaging with visibilities measured at a number of frequencies has become known as multi-frequency synthesis (and sometimes bandwidth synthesis). Although we introduce multi-frequency synthesis as a cure for bandwidth smearing, it is a far more useful technique. In addition to imaging multiple channels of a passband, multi-frequency synthesis can be used when the observing frequency is intentionally varied, possibly by an appreciable amount. Varying the observing frequency is an alternative way of measuring different locations to physically moving antennas. It is an attractive technique for both fixed (or movable arrays where the number of configurations is limited) if the sampling in the plane would otherwise be sparse.
Although this principle has been known for some time [e.g. McCready et al., 1947], it has received little attention until recently. This was probably a result of a lack of understanding of the image artifacts created by source brightness changes with frequency. Although the technique is clearly not appropriate for spectral-line observations, even for continuum observations there will be a spectral variation (non-zero spectral index) of source brightness. Cornwell [1984] appears to have been the first to consider the resultant image-plane artifacts caused by spectral variation, and to propose a deconvolution approach to remove these artifacts. These ideas were developed further by Conway et al. [1990], Conway [1991] and Sault and Wieringa [1994].
These deconvolution approaches recognize that if the spectral index of a point source is known then its response (a PSF) can be calculated. This will now depend on both the coverage and sampling in frequency. Furthermore, this PSF, , can be expanded as a Taylor’s series in the spectral index,
| (11) |
Here , , etc, are images that depend only on the and frequency coverage of the experiment. is the conventional dirty beam, whereas has been termed the ‘spectral dirty beam’ – it is the response that results from the linear spectral slope of the source brightness. Typically has a peak value of the order of a few times for frequency spreads of %. For single-frequency observations, it (and higher order images) will be identically 0.
Truncating Equation (11), the multi-frequency dirty image can be approximated as obeying a generalized convolution relationship
| (12) |
Conway et al. [1990] have proposed a CLEAN-like algorithm which alternately iterates with the and beams, thus generating an estimate of both and . Sault and Wieringa [1994] refine this with an algorithm which deconvolves with the two beams simultaneously. Figure 2 gives an example from the latter paper.
Conway et al. [1990] and Conway and Sault [1995] considered the errors that result from truncating the spectral index expansion, and showed that for a spread of frequencies of and typical spectral indices, the resultant errors are of order times the second brightest feature in the image. This assumes that the spectral variation of the brightest source has been eliminated by calibration or self-calibration of the spectral flux scale. Sault and Wieringa [1994] considered effects, other than source spectral index, which cause spectral variation, and gave details of a practical multi-frequency synthesis experiment, including some self-calibration issues. Their experiment observed multiple frequencies in three ways: the input bandwidth was broken into 32 correlator channels, two frequencies were observed simultaneously, and these two frequencies were altered every 75 s. By using multi-frequency synthesis, Sault and Wieringa were able to obtain good coverage from two configurations with limited antennas.
5 The Short Spacing Problem and Mosaicing
One of the blessings, and one of the curses, of interferometry is its insensitivity to very extended features. This is readily seen: an interferometer array has a minimum spacing, and structure that is broad enough to produce insignificant flux at the shortest spacing cannot be readily detected. In this regard an interferometer array acts as a filter to broad structure. The antenna dish diameter, , places a limit on the minimum spacing, as shorter spacings would result either in shadowing or, worse still, in physical collision of antennas. In practice, the minimum spacing, , for most arrays is somewhat larger than .
Although deconvolution algorithms can go some way towards estimating short spacings, these are usually inadequate when the extended emission is complex and significant. Measuring the short spacings directly is required. This is commonly done with a single-dish telescope the diameter of which is at least twice the minimum interferometer spacing (a single-dish telescope is sensitive to spacings out to its diameter). A larger diameter than the minimum spacing is required, both because single-dish illumination patterns are typically heavily tapered (and so there is poor sensitivity at the spacings corresponding to the single-dish diameter) and to provide an overlap region to allow simple gain cross-calibration between the interferometer and single-dish data. Two approaches have traditionally been used to combine the interferometer and single-dish data. The first is to form short spacing, pseudo-interferometer visibilities from the single-dish data. These visibilities are then used in the normal interferometric imaging procedures. Because of the different imaging equations of single-dish and interferometer images, some manipulations are required to form the pseudo-interferometer visibilities. See Bajaja and van Albada [1979] for details. The second traditional approach – the so-called feathering approach – combines images. The assumption is that final, deconvolved interferometer and single-dish images have been formed. Each image provides an accurate representation of the true sky in only a limited region of the plane. The true sky can be formed by combining the Fourier transforms of the two images, using the short spacings in the single-dish image and the long spacings of the interferometric image [e.g. Higgs et al., 1977]. The overlap region in the can again be used for simple gain cross-calibration, and can be averaged in some way in forming the output. Holdaway [1992a] reviewed this approach in a somewhat different context. Schwarz and Wakker [1991] discussed a variant, as well as comparing the two traditional approaches.
Another characteristic of interferometer arrays is that their field of view is limited by the primary beam response. Sources larger than the primary beam size must be imaged by using multiple pointings of the interferometer array, and the different fields pieced together. Note that the primary beam extent and the short-spacing problem are both set by – both effects indicate that it is not straightforward to image structures larger than this size.
Only in the last decade has it been recognized that both these shortcomings of an interferometer can be overcome (within limits) by ‘mosaicing’ – the practice of forming a single image from multiple pointings of an interferometer [Cornwell, 1989 gives an overview]. Although mosaicing is clearly needed to image sources larger than the primary beam, it is also effective in measuring short spacings. This stems from the fact that a single interferometer with baseline does not measure just a single spacing in the plane – it measures an integral of spacings from to . This means, in principle, that if the projected spacing between two antennas is the minimum (), then that interferometer is sensitive down to (but excluding) the zero spacing.
Whereas the information in this range of spacings is generally not accessible in a single pointing, it can be recovered in a multi-pointing observation. This was first noted by Ekers and Rots [1979], and the argument substantially enhanced by Cornwell [1988]. Using Cornwell’s argument, if the pointing centre, , is treated as a variable in the imaging equation, then the measured visibilities are given by
| (13) |
Here, for simplicity, we assume that the delay-tracking centre remains fixed at the origin. Let and be the Fourier transforms of the primary beam pattern and the true sky brightness, then it is straightforward to show that
| (14) |
This can be seen as a Fourier transform of from the domain to the domain. So, in principle, by measuring the visibility over a number of pointings, can be recovered for out to .
Cornwell [1988] showed that scanning was not required – all information can be recovered if the pointings are sampled on a grid, the increment of which is no larger than radians (this is typically near the half-power point of the primary beam response). This results from a Nyquist sampling criterion, which applies because the antenna diameter is finite and so the response of an interferometer is inherently band-limited in the spatial frequency domain.
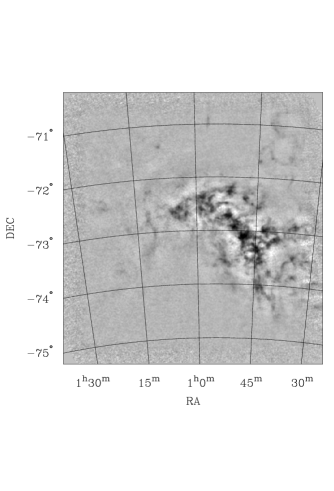
Cornwell [1988] presented a practical algorithm, based on MEM, which does a joint deconvolution of all the separate pointings. Basically the algorithm searches for a sky brightness distribution which maximizes an entropy measure, but which is compatible with the dirty images formed at each pointing. The algorithm is similar to that in Section 3.2 except that both the primary beam and the synthesized beam must be accounted for when converting from a model of the sky to a dirty image at one pointing. The recovery of the extended emission is implicit in the algorithm – Fourier transforms such as Equation (14) never explicitly appear. To date, observations containing several hundred pointings have been deconvolved using Cornwell’s approach (e.g. Staveley-Smith et al. [1995], see Figure 3).
Although, in principle, mosaicing should recover spacings of around each sample in the plane, Cornwell reported that, in practice, the improvement is closer to half this. In part, this undoubtedly results from the reduced sensitivity as drops to zero at . So, to recover all spacings effectively, single-dish data are still required. Cornwell’s algorithm also incorporates single-dish measurements in an elegant fashion. They are simply extra data (albeit with a different imaging equation) that the solution needs to be consistent with.
Since the Cornwell [1988] paper, extensive research and simulation work on mosaicing has been done. This is particularly so within the NRAO, where the driving force has come from planning for the proposed NRAO millimeter array (mosaicing is important at millimeter wavelengths, because the emission processes produce extended structures and because of smaller primary beam sizes). The NRAO Millimeter Array Memorandum Series contains many papers on mosaic-related issues. A summary of a number of aspects of the work is presented in Cornwell et al. [1993]. Three imaging-related results to come out of this research will be briefly described.
5.1 The homogeneous array concept
One aim of the millimeter array design is to measure all spacings up to some maximum. Given that mosaicing interferometer data cannot produce good estimates for spacings shorter than about , there has been considerable debate about the best method to measure these. Although Cornwell et al. [1993] mention several possibilities, only two are serious contenders: the large single-dish approach (with its diameter a few times the minimum interferometer spacing), and the so-called homogeneous array (with each element of the interferometer acting as a single dish, and with the minimum interferometer spacing slightly larger than ). With the homogeneous array, it is assumed that the spacings down to about are determined interferometrically using joint deconvolution, whereas the antennas in single-dish mode provide information on spacings shorter than this.
Cornwell et al. [1993] concluded that both the homogeneous array and large single-dish approaches can produce high-quality results. In particular, they showed that the homogeneous array is reasonably robust to a number of instrumental errors. Given the greater simplicity of the homogeneous array, and the greater ease of achieving the pointing and surface accuracy requirements with small elements, the homogeneous array approach is to be preferred.
5.2 Errors in mosaicing experiments
In interferometric, single-pointing images of objects smaller than the primary beam, “primary beam” errors (pointing errors, errors in the assumed form of the primary beam, errors caused by a primary beam which is not circularly symmetric, etc) are of limited importance. Indeed the final dynamic range of images is totally independent of some primary beam errors (e.g. a constant pointing offset in RA and DEC). This is not so with mosaicing – a good model of the overall primary beam response is as important as a good model of the synthesized beam. Both the primary and synthesized beams are important in determining the overall PSF of a mosaic experiment.
Cornwell et al. [1993] presented formulae which estimate the effects of various errors in the resultant final images. They also presented simulation results to confirm the validity of the formulae. For example, they suggested that if is the rms sidelobe level in the synthesized beam, and if is the rms difference between the actual and assumed primary beam response, and if the primary beam responses of all antennas are identical, then the dynamic range in an image will be limited to approximately
| (15) |
This indicates the importance, both of knowing the primary beam well, and for an array which has good coverage to minimize the synthesized beam sidelobes.
Some research has investigated ways to reduce the effects of pointing errors in the final images. Holdaway [1993] presented an algorithm which can handle time-varying, but known, pointing errors in interferometer data. Emerson [1991] demonstrated a cross-calibration procedure for determining global pointing errors in single-dish data, which he showed is a significant error when combining interferometer and single-dish data. Emerson’s results show that, left uncorrected, global single-dish pointing errors are more significant for larger dishes. However, they are easier to correct in this case, and the resultant performance is superior to that for a smaller dish. His results suggest that there was some advantage in using the large single-dish approach rather than the homogeneous array. Presumably this is because there is a greater region of overlap in the domain in which to cross-calibrate for the former than for the latter.
Other references to primary beam errors include Braun [1988b] and Holdaway [1992b].
5.3 Alternative imaging approaches
Cornwell [1994] and Cornwell et al. [1993] provide reviews of alternative mosaicing algorithms. All mosaicing schemes, at some level, perform a form of linear mosaicing operation (a weighted sum of the pixels in the images of the different pointings). If is an image of the th pointing, then the linear mosaic is
| (16) |
Here is the noise level in image of each pointing.
One approach to mosaicing is to deconvolve images of each pointing individually, and then to mosaic the results linearly. The greater computational simplicity of this approach makes it attractive for large-sky surveys [e.g. Condon et al., 1994; Bremer, 1994]. Primary beam errors also have less effect on the dynamic range of such images, as the deconvolution is done in single-pointing mode. However, the short-spacing advantages of mosaicing can only be realized in joint deconvolution (i.e. if the multiple pointings are combined before or during the deconvolution process) [Cornwell, 1988].
Sault et al. [1995] and Viallefond and Guilloteau [1993] take a different approach. Both form a linear mosaic of the dirty images of each pointing, and then deconvolve this composite image. They do this in a way which accounts for the position-variant nature of the PSF. Sault et al. show that there are practical advantages to such an approach and that it is capable of recovering short-spacing information. Buit whereas Sault et al. present deconvolvers based on the maximum entropy method and the Steer et al. [1984] variant of CLEAN, Viallefond and Guilloteau use a more traditional Högbom [1974] CLEAN algorithm.
Braun [1988a, 1988b] noted that, as dynamic range in joint deconvolution can be limited by primary beam errors on the bright compact objects, and as these objects benefit little from joint deconvolution, then a hybrid imaging scheme may be desirable. He advocated using a joint deconvolution approach with the shorter interferometer spacings and single-dish data, and individual imaging and deconvolution for the longer spacing data. The two resultant images are then combined using a traditional feathering operation. In addition to dynamic range considerations, this scheme may be computationally cheaper. Holdaway [1992a] expanded on some of Braun’s approaches.
6 Wide-field imaging with non-coplanar baselines
In the two-dimensional Fourier transform approximation of Equation (2), the term of the van Cittert-Zernike equation has been neglected. There are two regimes where this is appropriate.
-
1.
If the sampling in is coplanar, i.e.
(17) for some and , then the van Cittert-Zernike equation reduces to a two-dimensional Fourier relation in the distorted ‘direction cosines’
(18) (19) In practice these distorted direction cosines mean simply that a different set of formulae are required to convert from pixel coordinates to celestial coordinates. Coplanar observations will result from east-west arrays and from snapshots of physically planar arrays.
-
2.
For observations with non-coplanar baselines, the two-dimensional approximation is equivalent to ignoring the phase term,
(20) For small fields () this may be adequate.
The first regime involves no approximation; the techniques of this section are not relevant for east-west arrays. We are interested here in eliminating the approximation in the second regime.
The phase term ignored in the two-dimensional approximation is
| (21) | |||||
| (22) |
Assuming that a two-dimensional Fourier transform is used, the effect of this approximation is to smear sources in proportion to the square of their distance from the delay-tracking centre. The smearing, being a property of array geometry etc only, is predictable for a given observation; it can be viewed as a position-variant PSF when the conventional approach is used to transform. Near the centre, the conventional dirty beam represents the PSF well, whereas at a distance from the centre, its representation is poor.
The limitations of ignoring the phase term have been appreciated for some time and algorithms have been proposed to account for it [e.g. Brouw, 1975; Clark, 1973, 1978; Frater and Docherty, 1980; Bracewell, 1984; McLean, 1984]. However, it was not until recently that astrophysical requirements and improved computational resources have led to the implementation of these algorithms. This is, in part, a result of the development of high-resolution, low-frequency arrays. To see that the problem is more significant at these frequencies, Cornwell and Perley [1992] noted that the maximum phase term goes as
| (23) |
This assumes that emission fills the primary beam. As this is often not the case at shorter wavelengths ( cm), the importance of the effect is steeper than the linearity that the above formula suggests.
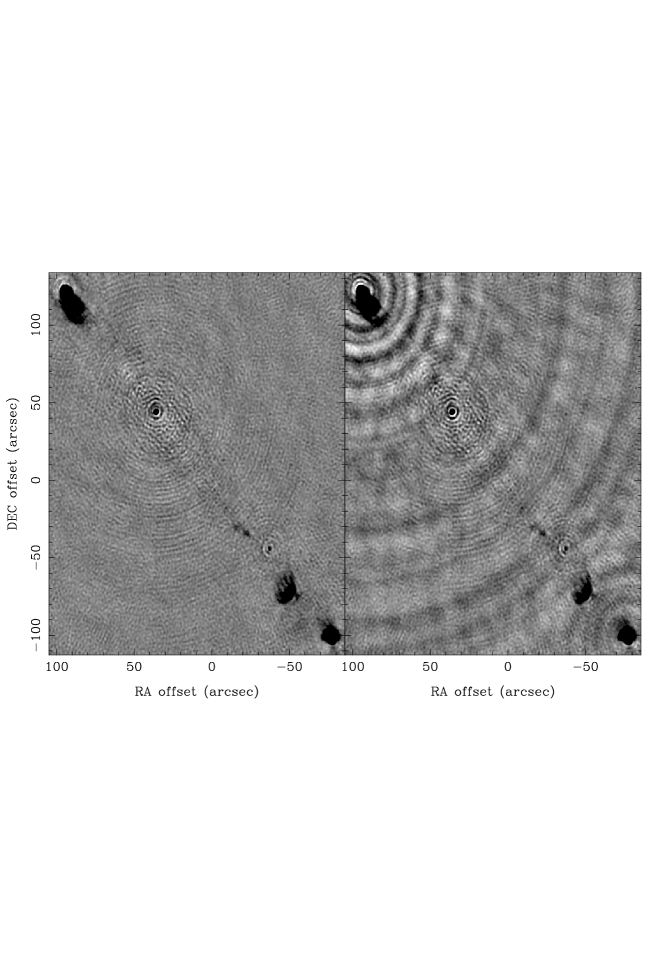
Algorithms to handle the problem can be divided into four broad classes: we will discuss each in turn. Cornwell and Perley [1992] gave an overview of the problem, and compared some approaches. They also discussed the implementation of two approaches in detail. Examples from this paper are given in Figure 4.


6.1 Deconvolution with a position-variant PSF
This approach was originally proposed by McLean [1984], whereby a CLEAN-like algorithm is used to deconvolve a smeared image: when a point source is located in a CLEAN iteration, the true PSF at that position is computed and subtracted. McLean proposed a power-series expansion of dirty beams to determine the PSF. Waldram and McGilchrist [1990] and Waldram [1991] implemented a conceptually similar approach, although they computed the position-variant PSFs on a coarse grid on the sky, and used a weighted sum of these to approximate the PSF at any point in the field. Their application was for a linear array (the Cambridge Low Frequency Synthesis Telescope) which deviates from east-west by only .
6.2 Approaches using coplanar decomposition
If visibility sets that are coplanar do not have a problem, one approach is to decompose a non-coplanar set of visibilities into a collection of (at least approximately) coplanar sets. Each coplanar set could then be imaged, deconvolved, and distorted onto a common image grid. This was the basis of suggestions by Bracewell [1984] and Frater and Docherty [1980], although their decompositions, motivated by different array geometries, were quite different. For a physically coplanar array, decomposing into a set of snapshots is another possibility. This was the approach taken by Condon et al. [1994] in a somewhat different context. The main shortcoming with this approach is that, as deconvolution is usually a non-linear operation, the sum of the separate deconvolutions will be inferior to a single ‘correct’ deconvolution.
6.3 The polyhedron method
If the phase term can be ignored for sufficiently small fields, one approach is to build up a large field from small facets of the sky – i.e. the celestial sphere is approximated by a celestial polyhedron. This approach – the so-called polyhedron method – appears to have been first suggested by Clark [1979], and has been implemented and discussed in detail by Cornwell and Perley [1992]. The Cornwell and Perley implementation, in many respects, is an extension of the Cotton-Schwab CLEAN algorithm [Schwab, 1984].
6.4 Three-dimensional approach
This approach concedes that the problem is not fundamentally two dimensional. Instead it notes that simple manipulation can convert the van Cittert-Zernike equation to a three-dimensional Fourier transform
| (24) |
Here the visibility (uncorrected for delay tracking) is a three-dimensional transform of the celestial sphere. This is probably the most intuitive and first-recognized approach [e.g. Clark, 1973; Brouw, 1975]. Perley [1989] and Cornwell and Perley [1992] considered the technique and its implementation. They showed that a three-dimensional dirty beam relates the true and dirty celestial spheres by a convolution relationship. They generalized two-dimensional deconvolution algorithms to work on this three-dimensional problem. In practical terms Cornwell and Perley [1992] noted that, whereas a three-dimensional transform approach is computationally cheap and simpler to program compared to the polyhedron method, it is expensive in terms of memory.
7 Non-isoplanatic imaging
In all the preceding discussion, we implicitly assumed that the visibility data were corrected for antenna gains. However, to be able to do this requires isoplanaticism – the assumption that the atmospheric path delays are constant over the field of view. That is, the antenna gains are independent of source position. This, however, will not be the case at wavelengths longer than about 1 m, because of large ionospheric irregularities and large primary beam sizes. Non-isoplanaticity will be significant, for example, for the GMRT [Swarup, 1990, 1991] and for the VLA at 74 MHz [Kassim et al., 1993].
Non-isoplanaticism will mean that standard imaging, calibration and self-calibration schemes will be inadequate. Schwab [1984] considered extensions to self-calibration, where an antenna phase was determined at a number of points on the sky, and interpolation used for intermediate positions. He also advocated a modified Cotton-Schwab CLEAN algorithm similar to the polyhedron method of Cornwell and Perley [1992 – see Section 6 above] for imaging and deconvolution.
Subrahmanya [1990, 1991] advocated a different self-calibration model: because the primary beams of the different antennas of the VLA and GMRT overlap significantly at typical ionospheric heights, he suggested that the number of unknowns in a self-calibration solution could be reduced by solving for a geometric model of the ionosphere. The ionosphere would be modelled as a number of phase cells at a given height. The effect of these cells on the observed phase of a given source on a given antenna could then be predicted. Bhatnagar [1995] reports that convergence of Subrahmanya’s method is very sensitive to the ionospheric cell size and the initial model of the source.
Although Kassim et al. [1993] reported VLA observations at 74 MHz, they restricted their attention to strong, relatively compact, sources where non-isoplanatic issues could be ignored to first order. As yet, there appear to be no practical implementations of non-isoplanatic imaging algorithms.
8 Acknowledgements
We thank the referees, W. N. Brouw, T. J. Cornwell and J. E. Noordam, as well as R. D. Ekers and D. Goddard for their comments and corrections. We are also grateful to D. S. Briggs, T. J. Cornwell and L. Staveley-Smith for allowing us to reproduce diagrams from their papers.
9 References
J. G. Ables [1974], “Maximum entropy spectral analysis,” Astr. Astrophys. Suppl., 15, pp. 383-393.
H. C. Andrews, and B. R. Hunt [1977], Digital Image Restoration, Signal Processing, Englewood Cliffs, New Jersey, Prentice-Hall Inc.
E. Bajaja, and G. D. van Albada [1979], “Complementing aperture synthesis radio data by short spacing components from single dish observations,” Astr. Astrophys., 75, pp. 251-254.
S. Bhatnagar [1995], GMRT Internal Report, Pune, India.
R. N. Bracewell [1984], “Inversion of nonplanar visibilities,” in J. A. Roberts (ed.), Proceedings of IAU/USRI Conference on Indirect Imaging, Cambridge Univ. Press, pp. 177-183.
R. Braun [1988a], “Mosaicing with high dynamic range,” NRAO Millimeter Array Memo 46, Socorro, NM.
R. Braun [1988b], “Simulations of primary beam truncation and pointing errors with the MMA,” NRAO Millimeter Array Memo 54, Socorro, NM.
M. A. R. Bremer [1994], “The Westerbork Northern Sky Survey (WENSS): A radio survey using the mosaicing technique,” in D. R. Crabtree, R. J. Hanisch, and J. Barnes (eds.), Astronomical Data Analysis Software and Systems III, Astronomical Society of the Pacific Conference Series, 61, pp. 175-178.
A. H. Bridle, and F. R. Schwab [1989], “Wide Field Imaging I: Bandwidth and time-averaging smearing,” in R. A. Perley, F. R. Schwab, and A.H. Bridle (eds.), Synthesis Imaging in Radio Astronomy, Astronomical Society of the Pacific Conference Series, 6, pp. 247-258.
Briggs D.S. [1995], Ph.D. Thesis, New Mexico Institute of Mining and Technology.
E. Brinks, and W. W. Shane [1984], “A high resolution hydrogen line survey of Messier 31. I. Observations and data reduction,” Astr. Astrophys. Suppl., 55, pp. 179-251.
W. N. Brouw [1975], “Aperture synthesis,” in B. Alder, S. Fernbach, M. Rotenberg (eds.), Methods in Computational Physics, 14, pp. 131-175.
B. G. Clark [1973], “Curvature of the sky,” VLA Scientific Memo 107, NRAO, Socorro, NM.
B. G. Clark [1975], “Bandwidth correction by deconvolution,” VLA Scientific Memo 118, NRAO, Socorro, NM.
B. G. Clark [1979], “Digital processing methods for aperture synthesis observations,” in C. van Schooneveld (ed.), Proceedings of IAU Colloquium 49, Image Formation from Coherence Functions in Astronomy, D.Reidel, pp. 113-120.
B. G. Clark [1980], “An efficient implementation of the algorithm CLEAN,” Astr. Astrophys., 89, pp. 377-378.
J. J. Condon, W. D. Cotton, E. W. Greisen, Q. F. Yin, R. A. Perley, and J. J. Broderick [1994], “The NRAO VLA Sky Survey,” in D. R. Crabtree, R. J. Hanisch, and J. Barnes (eds.), Astronomical Data Analysis Software and Systems III, Astronomical Society of the Pacific Conference Series, 61, pp. 155-164.
J. E. Conway [1991], “Multi-frequency synthesis,” in T. J. Cornwell, and R. A. Perley (eds.), Proceedings of IAU Colloquium 131, Radio Interferometry: Theory, Techniques and Applications, Astronomical Society of the Pacific Conference Series, 19, pp. 171-179.
J. E. Conway, and R. J. Sault [1995], “Multi-frequency synthesis,” in J. A. Zensus, P. J. Diamond, and P. J. Napier (eds.), Workshop on Very Long Baseline Interferometry and the VLBA, Astronomical Society of the Pacific Conference Series, 82, pp. 309-325.
J. E. Conway, T. J. Cornwell, and P. N. Wilkinson [1990], “Multi-frequency synthesis: a new technique in radio interferometric imaging,” Mon. Not. R. Astr. Soc., 246, pp. 490-509.
T. J. Cornwell [1983], “A method of stabilizing the clean algorithm,” Astr. Astrophys., 121, pp. 281-285.
T. J. Cornwell [1984], “Broadband mapping of sources with spatially varying spectral index,” VLB Array Memo 324, NRAO, Socorro, NM.
T. J. Cornwell [1987], “Radio-interferometric imaging of weak objects in conditions of poor phase stability: the relationship between speckle masking and phase closure methods,” Astr. Astrophys., 180, pp. 269-274.
T. J. Cornwell [1988], “Radio-interferometric imaging of very large objects,” Astr. Astrophys., 202, pp. 316-321.
T. J. Cornwell [1989], “Wide field imaging III: mosaicing,” in R. A. Perley, F. R. Schwab, and A.H. Bridle (eds.), Synthesis Imaging in Radio Astronomy, Astronomical Society of the Pacific Conference Series, 6, pp. 277-286.
T. J. Cornwell [1994], “Mosaicing: Current status,” in M. Ishiguro, and W. J. Welch (eds.), Astronomy with Millimeter and Submillimeter Wave Interferometry, Astronomical Society of the Pacific Conference Series, 59, pp. 96-103.
T. J. Cornwell, and R. Braun [1989], “Deconvolution,” in R. A. Perley, F. R. Schwab, and A. H. Bridle (eds.), Synthesis Imaging in Radio Astronomy, Astronomical Society of the Pacific Conference Series, 6, pp. 167-184.
T. J. Cornwell, and E. B. Fomalont [1989], “Self-calibration,” in R. A. Perley, F. R. Schwab, and A. H. Bridle (eds.), Synthesis Imaging in Radio Astronomy, Astronomical Society of the Pacific Conference Series, 6, pp. 185-197.
T. J. Cornwell, M. A. Holdaway, and J. M. Uson [1993], “Radio-interferometric imaging of very large objects: implications for array design,” Astr. Astrophys., 271, pp. 697-713.
T. J. Cornwell, and R. A. Perley [1992], “Radio-interferometric imaging of very large fields – The problem of non-coplanar arrays,” Astr. Astrophys., 261, pp. 353-364.
T. J. Cornwell, and P. N. Wilkinson [1981], “A new method for making maps with unstable radio interferometers,” Mon. Not. R. Astr. Soc., 196, pp. 1067-1086.
W. D. Cotton [1989], “Special problems in imaging,” in R. A. Perley, F. R. Schwab, and A. H. Bridle (eds.), Synthesis Imaging in Radio Astronomy, Astronomical Society of the Pacific Conference Series, 6, pp. 233-246.
R. D. Ekers [1983], “The almost serendipitous discovery of self-calibration,” in K. Kellermann, and B. Sheets (eds.), Proceedings of the Workshop on Serendipitous Discoveries in Radio Astronomy, NRAO.
R. D. Ekers, and A. H. Rots [1979], “Short spacing synthesis from a primary beam scanning interferometer,” in C. van Schooneveld (ed.), Proceedings of IAU Colloquium 49, Image Formation from Coherence Functions in Astronomy, D. Reidel, pp. 61-63.
D. T. Emerson [1991], “Imaging characteristics of the proposed NRAO MMA, with and without a single large element, and a pointing correction algorithm,” in T. J. Cornwell, and R. A. Perley (eds.), Proceedings of IAU Colloquium 131, Radio Interferometry: Theory, Techniques and Applications, Astronomical Society of the Pacific Conference Series, 19, pp. 441-444.
R. H. Frater, and I. S. Docherty [1980], “On the reduction of three dimensional interferometer measurements,” Astr. Astrophys., 84, pp. 75-77.
P. W. Gorham, A. M. Ghez, S. R. Kulkarni, T. Nakajima., G. Neugebauer, J. B. Oke, and T. A. Prince [1989], “Diffraction-limited imaging. III 30 mas closure phase imaging of six binary stars with the Hale 5m telescope,” Astron. J., 98, pp. 1783-1799.
S. F. Gull, and G. J. Daniell [1978], “Image reconstruction from incomplete and noisy data,” Nature, 272, pp. 686-690.
C. A. Haniff, C. D. Mackay, D. J. Titterington, D. Sivia, and J. E. Baldwin [1977], “The first images from optical aperture synthesis,” Nature, 328, pp. 694-696.
L. A. Higgs, T. L. Landecker, and R. S. Rogers [1977], “The true extent of the Gamma Cygni supernova remnant,” Astron. J., 82, pp. 718-724.
J. A. Högbom [1974], “Aperture synthesis with a non-regular distribution of interferometer baselines,” Astr. Astrophys. Suppl., 15, pp. 417-426.
M. A. Holdaway [1992a], “Mosaicing with even higher dynamic range,” NRAO Millimeter Array Memo 73, Socorro NM.
M. A. Holdaway [1992b], “Surface accuracy requirements for mosaicing at millimeter wavelengths,” NRAO Millimeter Array Memo 74, Socorro NM.
M. A. Holdaway [1993], “Imaging with known pointing errors,” NRAO Millimeter Array Memo 95, Socorro NM.
R. C. Jennison [1951], Ph.D. Thesis, University of Manchester.
R. C. Jennison [1958], “A phase sensitive interferometer technique for the measurement of the Fourier transforms of spatial brightness distributions of small angular extent,” Mon. Not. R. Astr. Soc., 118, pp. 276-284.
N. E. Kassim, R. A. Perley, W. C. Erickson, and K. S. Dwarakanath [1993], “Subarcminute resolution imaging of radio sources at 74 MHz with the Very Large Array,” Astron. J., 106, pp. 2218-2228.
A. Lannes, E. Anterrieu, and K. Bouyoucef [1994], “Fourier interpolation and reconstruction via Shannon-type techniques. I. Regularization principle,” J. Mod. Opt., 41, pp. 1537-1574.
C. L. Lawson, and R. J. Hanson [1974], Solving Least Squares Problems, Englewood Cliffs, New Jersey, Prentice-Hall Inc.
A. W. Lohmann, and B. Wirnitzer [1984], “Triple correlations,” Proc. IEEE, 72, pp. 889-901.
A. W. Lohmann, G. Weigelt, and B. Wirnitzer [1983], “Speckle masking in astronomy: triple correlation theory and applications,” Applied Optics, 22, pp. 4028-4037.
L. L. McCready, J. L. Pawsey, and R. Payne-Scott [1947], “Solar radiation at radio frequencies and its relation to sunspots,” Proc. Roy. Soc. A, 190, pp. 357-375.
D. J. McLean [1984], “A simple expansion method for wide-field mapping,” in J. A. Roberts (ed.), Proceedings of IAU/USRI Conference on Indirect Imaging, Cambridge Univ. Press, pp. 185-191.
T. Nakajima, S. R. Kulkarni, P. W. Gorham, A. M. Ghez, G. Neugebauer, J. B. Oke, T. A. Prince, and A. C. S. Readhead [1989], “Diffraction limited imaging. II. Optical aperture-synthesis imaging of two binary stars,” Astron. J., 97, pp. 1510-1521.
R. Narayan, and R. Nityananda [1986], “Maximum entropy image restoration in astronomy,” Ann. Rev. Astr. Ap., 24, pp. 127-170.
J. E. Noordam, and A. G. de Bruyn [1982], “High dynamic range mapping of strong radio sources, with application to 3C84,” Nature, 299, pp. 597-600.
T. J. Pearson, and A. C. S. Readhead [1984], “Image formation by self-calibration in radio astronomy,” Ann. Rev. Astr. Ap., 22, pp. 97-130.
R. A. Perley [1989], “Wide field imaging II: Imaging with non-coplanar arrays,” in R. A. Perley, F. R. Schwab, and A. H. Bridle (eds.), Synthesis Imaging in Radio Astronomy, Astronomical Society of the Pacific Conference Series, 6, pp. 259-275.
R. A. Perley, F. R. Schwab, and A. H. Bridle (eds.) [1989], Synthesis Imaging in Radio Astronomy, Astronomical Society of the Pacific Conference Series, 6.
A. C. S. Readhead, and P. N. Wilkinson [1978], “The mapping of compact radio sources from VLBI data,” Astrophys. J., 223, pp. 25-36.
A. C. S. Readhead, R. C. Walker, T. J. Pearson, and M. H. Cohen [1980], “Mapping radio sources with uncalibrated visibility data,” Nature, 285, pp. 137-140.
R. J. Sault [1984], “The weighting of visibility data,” VLA Scientific Memo 154, NRAO, Socorro, NM.
R. J. Sault, and M. H. Wieringa [1994], “Multi-frequency synthesis techniques in radio interferometric imaging,” Astr. Astrophys. Suppl., 108, pp. 585-594.
R. J. Sault, L. Staveley-Smith, and W. N. Brouw [1995], “An approach to interferometric mosaicing,” to be submitted to Astr. Astrophys..
F. R. Schwab [1980], “Adaptive calibration of radio interferometer data,” Proc. S.P.I.E., 231, pp. 18-24.
F. R. Schwab [1984], “Relaxing the isoplanatism assumption in self-calibration; applications to low-frequency radio interferometry,” Astron. J., 89, pp. 1076-1081.
U. J. Schwarz [1978], “Mathematical statistical description of the iterative beam removing technique (Method CLEAN),” Astr. Astrophys., 65, pp. 345-356.
U. J. Schwarz [1979], “The CLEAN method – use, misuse and variations,” in C. van Schooneveld (ed.), Proceedings of IAU Colloquium 49, Image Formation from Coherence Functions in Astronomy, D.Reidel, pp. 261-275.
U. J. Schwarz [1984], “The reliability of CLEAN maps and the corrugation effect,” in J. A. Roberts (ed.), Proceedings of IAU/USRI Conference on Indirect Imaging, Cambridge Univ. Press, pp. 255-260.
U. J. Schwarz, and B. P. Wakker [1991], “Adding short spacings to synthesis maps in the sky domain,” in T. J. Cornwell, and R. A. Perley (eds.), Proceedings of IAU Colloquium 131, Radio Interferometry: Theory, Techniques and Applications, Astronomical Society of the Pacific Conference Series, 19, pp. 188-191.
R. A. Sramek, and F. R. Schwab [1989], “Imaging,” in R. A. Perley, F. R. Schwab, and A. H. Bridle (eds.), Synthesis Imaging in Radio Astronomy, Astronomical Society of the Pacific Conference Series, 6, pp. 117-138.
J. L. Starck, A. Bijaoui, B. Lopez, and C. Perrier [1994], “Image reconstruction by the wavelet transform applied to aperture synthesis,” Astr. Astrophys., 283, pp. 349-360.
L. Staveley-Smith, R. J. Sault, D. McConnell, M. J. Kesteven, D. Hatzidimitriou, K. C. Freeman, and M. A. Dopita [1995], “An HI mosaic of the Small Magellanic cloud,” Publ. Astron. Soc. Aust., 12, pp. 13-19.
D. G. Steer, P. E. Dewdney, and M. R. Ito [1984], “Enhancements to the deconvolution algorithm CLEAN,” Astr. Astrophys., 137, pp. 159-165.
C. R. Subrahmanya [1990], “Non-isoplanatic ionosphere and low-frequency imaging,” in J.E. Baldwin, and Wang Shouguan (eds.), Proceedings of URSI/IAU Symposium on Radio Astronomical Seeing, International Academic Publishers, pp. 198-201.
C. R. Subrahmanya [1991], “Low frequency imaging and the non-isoplanatic atmosphere,” in T. J. Cornwell, and R. A. Perley (eds.), Proceedings of IAU Colloquium 131, Radio Interferometry: Theory, Techniques and Applications, Astronomical Society of the Pacific Conference Series, 19, pp. 218-222.
G. Swarup [1990], “Giant metrewave radio telescope (GMRT) – Scientific objectives and design aspects,” Ind. J. Radio & Space Phys., 19, pp. 493-505.
G. Swarup [1991], “Giant Metrewave Radio Telescope (GMRT),” in T. J. Cornwell, and R. A. Perley (eds.), Proceedings of IAU Colloquium 131, Radio Interferometry: Theory, Techniques and Applications, Astronomical Society of the Pacific Conference Series, 19, pp. 376-380.
A. R. Thompson, and R. N. Bracewell [1974], “Interpolation and Fourier transformation of fringe visibilities,” Astron. J., 79, pp. 11-24.
A. R. Thompson, J. M. Moran, and G. W. Swenson Jr. [1986], Interferometry and Synthesis in Radio Astronomy, New York, New York, John Wiley & Sons.
F. Viallefond, and S. Guilloteau [1993], “Mosaic deconvolution,” in preparation, Observatoire de Meudon, Paris.
B. P. Wakker, and U. J. Schwarz [1988], “The Multi-Resolution Clean and its application to the short-spacing problem in interferometry,” Astr. Astrophys., 200, pp. 312-322.
E. M. Waldram [1991], “The use of beam-sets in the analysis of wide-field maps from the CLFST,” in T. J. Cornwell, and R. A. Perley (eds.), Proceedings of IAU Colloquium 131, Radio Interferometry: Theory, Techniques and Applications, Astronomical Society of the Pacific Conference Series, 19, pp. 180-183.
E. M. Waldram, and M. M. McGilchrist [1990], “Beam-sets – A new approach to the problem of wide-field mapping with non-coplanar baselines,” Mon. Not. R. Astr. Soc., 245, pp. 532-541.
G. Weigelt [1991], “Triple-correlation imaging in optical astronomy,” in E. Wolf (ed.), Progress in Optics, Amsterdam, North-Holland, XXIX, pp. 295-319.
G. Weigelt, and B. Wirnitzer [1983], “Image reconstruction by the speckle-masking method,” Opt. Lett., 8, pp. 389-391.
M. H. Wieringa [1991], “The use of redundancy in interferometry: A comparison of redundancy and selfcal,” in T. J. Cornwell, and R. A. Perley (eds.), Proceedings of IAU Colloquium 131, Radio Interferometry: Theory, Techniques and Applications, Astronomical Society of the Pacific Conference Series, 19, pp. 192-196.
M. H. Wieringa [1992], “An investigation of the telescope based calibration methods REDUNDANCY and SELF-CAL,” Experimental Astronomy, 2, pp. 203-225.