High-redshift obscured quasars
Abstract
Using mid-infrared and radio criteria, we select a sample of candidate obscured quasars. Optical spectroscopy confirms about half of these as type-2 quasars, and modelling the population suggests 50-80% of the quasars are obscured. We find some flat radio spectrum type-2 quasars, and tentative evidence for obscuration unrelated to the torus. Using a similar sample, we also find evidence for a significant fraction of Compton-thick quasars.
1Astrophysics, Department of Physics, University of Oxford, Keble Rd, Oxford, OX1 3RH, UK
2Max-Planck Insitut für Astronomie, Königstuhl-17, D-69117, Germany
†E-mail: martinez@mpia-hd.mpg.de (AMS)
1. Introduction
The population of high-redshift obscured (type-2) quasars (active galactic nuclei with W) has proven an elusive one, despite great progress in deep surveys. In radio-selected samples, the fraction of unobscured (type-1) quasars to the total number of quasars (the quasar fraction) is found to be (Willott et al. 2000), corresponding to a ratio of type-2 to type-1 1:1. At X-ray wavelengths, surveys have been successful in finding large numbers of type-2 AGN, but the exact fraction of type-2 quasars is still unclear (for recent results, see e.g. Wang et al. 2006; Dwelly & Page 2006; Gilli et al.2006).
A possible explanation for the discrepancies is that some quasars are very heavily obscured (with absorbing columns, m-2) and are therefore very difficult to detect in X-ray surveys. An alternative approach is to use the characteristic warm dust ( 100-1000 K) signature of AGN to select obscured quasars based on their mid-infrared properties, and indeed Lacy et al. (2006) confirmed the success of a 3.6 to 8 m colour selection to find AGN (obscured and unobscured) at intermediate redshifts.
Of particular cosmological relevance is the quasar fraction at 2, around the maximum in the quasar activity. We therefore devised a set of strict selection criteria to look for 2 type-2 quasars. This has also practical advantages, since above Ly is visible with ground-based optical spectrographs.
2. Selection
Quasars are bright at mid-infrared wavelengths due to the presence of warm dust. At 2, observed 24 m corresponds to rest-frame m, or dust at K. At these wavelengths, the obscuration due to dust is negligible, unless the is extreme. The extinction due to dust increases rapidly with decreasing wavelength, so that type-2 quasars that are bright at 24 m should be significantly fainter at 3.6 m (rest-frame 1.2 m). In addition, if the quasar has a value of , the 3.6-m flux density will be dominated by the host galaxy, instead of the quasar light. Since quasar host galaxies are typically massive ellipticals, one can assume a typical galaxy mass, and use the 3.6-m flux density to obtain a crude photometric redshift.
Therefore we demand objects to meet the following criteria: Jy and Jy. Assuming a typical quasar SED, the 24-m criterion corresponds to slightly below the break in the quasar luminosity function at , while the flux density cut corresponds to . This allows some margin of error for our crude cut.
These two criteria should select quasars with and . However, they are also likely to include a large number of ultra-luminous infrared galaxies (ULIRGs) at 1. We therefore included a radio criterion: 350 Jy 2 mJy. Only ULIRGs with very high star-formation rates ( 100-350 yr-1 of massive stars) are expected to make this cut, which therefore minimises the contamination in our sample. The trade-off is that the quasars we select are radio-intermediate ( W Hz-1 sr-1), so although their (rest-frame) 8-m luminosity densities correspond to below the break in the luminosity function, their radio properties make them more rare than the radio-quiet quasars.
3. The quasar fraction
Applying this criteria, we found a number of candidates (21 in the 4 deg2 of the Spitzer extragalactic First Look Survey, FLS), and optical spectroscopy confirmed about half of these as narrow-line type-2 quasars at . One object at had no high-ionisation lines, and could plausibly be a ULIRG contaminant. The rest of the objects had completely blank spectra, and there is no contamination from type-1 quasars (see Martínez-Sansigre et al. 2006a).
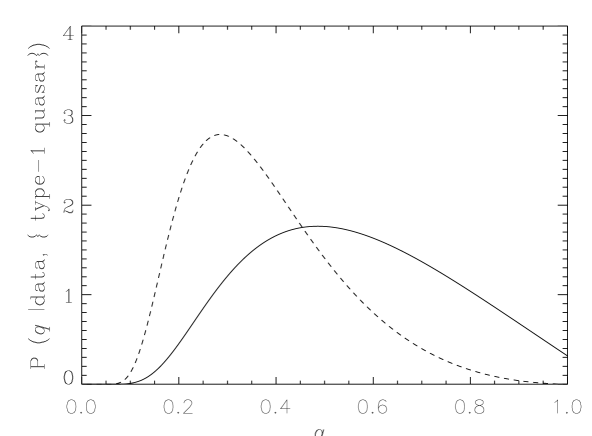
To estimate the quasar fraction, we modelled the expected number of type-1 quasars meeting our 24-m and 1.4 GHz criteria, and at , where our completeness is expected to be high. Assuming a flat prior probability distribution (PDF) for the quasar fraction (reflecting our ignorance), we calculated the posterior PDF of the quasar fraction, given the predicted number of type-1 quasars, and the number of type-2 quasars showing narrow-lines and with . This is shown as the solid curve in Figure 1. The distribution peaks around a value of the quasar fraction, , implying a similar number of narrow-line type-2 quasars as type-1 quasars.
Some of the blank objects will be in the “spectroscopic desert” (1.2 1.7), yet many are probably at (and two cases have been spectroscopically confirmed to be at and 2.25 from Spitzer spectroscopy by Weedman et al. 2006). We therefore use the crude photometric estimates (from the 3.6 m flux density) to estimate how many blank-spectrum objects lie at . When these objects are added to the narrow-line objects, one obtains the dashed-line distribution of Figure 1, and the modal value for is now closer to 0.25. The true quasar fraction is probably somewhere between and , so that we can conclude that at the peak of type-1 quasar activity, 50-80% of quasars are obscured (Martínez-Sansigre et al. 2005).
A possible explanation for the blank objects is that they are being obscured by dust on scales larger than the narrow-line region. The obscuration would therefore be independent of the orientation. If this scheme is true, then some of the blank-spectrum objects are expected to harbor quasars with the torus face-on: objects that would be type-1s if they were not obscured by dust on kpc scales. If the radio jet is close enough to our line of sight, such a quasar might exhibit a flat-spectrum.
To test this, we used radio data at 1.4 and 4.9 GHz from the VLA and at 610 MHz from the GMRT to measure the radio spectral indices ( Martínez-Sansigre et al.2006b). Most objects show steep spectra, as expected from radio sources, and some gigahertz-peaked sources are also found. However, four objects show flat radio spectra. One of these is the object, and its radio luminosity ( W Hz-1 sr-1) is consistent with a massive-star-formation rate of 300 yr-1: it is probably a ULIRG contaminant. The other three objects are probably flat-spectrum type-2 quasars, and none show narrow-emission lines (one of them has from Spitzer spectroscopy).
4. Compton-thick quasars
If this scheme is correct, as suggested by the evidence collected so far, then type-2 quasars outnumber type-1 quasars by 2-3:1, and therefore a fraction of type-2 quasars seems to have been missed out by hard X-ray surveys. The most likely explanation is therefore that some of these type-2 quasars are optically-thick to Compton-scattering, i.e. are “Compton-thick” ( m-2). Since no X-ray data was available for the first sample, we selected a similar sample in the Subaru-XMM Deep Fiels (SXDF) where deep X-ray data was available. The area here is smaller (0.8 deg2), so we needed to change our selection slightly to yield more quasars. We lowered the lower cut in radio flux density to Jy and left all other criteria unchanged. As well as increasing the number of high-redshift type-2 quasars, this would increase the number of ULIRG contaminants, and no spectroscopy was originally available to distinguish between objects.
To separate the type-2 quasars from the ULIRGs, we fitted the spectral energy distributions (SEDs) between B-band and 24 m, using a quasar and a ULIRG model, and used a bayesian criterion (the odds ratio) to select between models. We only kept the objects where the quasar model was strongly favoured over the ULIRG model, with reasonably good fits, and with , so that they could be tested observationally. This left us with 12 good type-2 candidates, only two of which were detected in the deep X-ray catalogue of the SXDF. From the photometric redshifts and the X-ray data, the two objects have estimated column densities of log 27.25 and 27.50, so they are both heavily obscured but Compton-thin.
The other 10 objects are undetected in X-rays, up to an approximate flux limit in the 2-12 keV band 3 W m-2. They have similar estimated values of and bolometric luminosities to the two X-ray detections, so if they are indeed quasars, they are probably more heavily absorbed, with m-2. We therefore find evidence that many of these objects are Compton-thick (Martínez-Sansigre et al. 2006c).
Acknowledgments.
We thank our collaborators for their important contributions to this work.
References
- Dwelly & Page (2006) Dwelly T., Page M. J., 2006, MNRAS, 372, 1755
- (2) Gilli R., Comastri A., Hasinger G., 2006, A&A, in press (astro-ph/0610939)
- Lacy et al. (2006) Lacy M., Petric A., Sajina A., Canalizo G., Storrie-Lombardi L. J., Armus L., Fadda D. & Marleau F. R., 2007, AJ, 133, 186
- Martínez-Sansigre et al. (2005) Martínez-Sansigre A., Rawlings S., Lacy M., Fadda D., Marleau F. R., Simpson C., Willott C. J., Jarvis M. J., 2005, Nat, 436, 666
- Martínez-Sansigre et al. (2006a) Martínez-Sansigre A., Rawlings S., Lacy M., Fadda D., Jarvis M. J., Marleau F. R., Simpson C., Willott C. J., 2006a, MNRAS, 370, 1479
- (6) Martínez-Sansigre A., Rawlings S., Garn T., Green D. A., Alexander P., Klöckner H.-R., Riley J. M., 2006b, MNRAS, 373L, 80
- Martínez-Sansigre et al. (2006c) Martínez-Sansigre A., et al. 2006c, MNRAS, submitted (astro-ph/0611739)
- Wang et al. (2006) Wang J. X., et al. 2006, ApJ, accepted (astro-ph/0611251)
- Weedman et al. (2006) Weedman D. W., Le Floc’h E., Higdon S. J. U., Higdon J. L., Houck J. R., 2006, ApJ, 638, 613
- Willott et al. (2000) Willott C. J., Rawlings S., Blundell K. M., Lacy M., 2000, MNRAS, 316, 449