11email: zhangy96@hkucc.hku.hk 22institutetext: Department of Physics, University of Hong Kong, Pokfulam Road, Hong Kong, China 33institutetext: Harvard-Smithsonian Centre for Astrophysics, 60 Garden Street, Cambridge, MA 02138, USA
Temperature fluctuations in H ii regions: for the two-phase model
Abstract
Aims. We investigate temperature fluctuations in H ii regions in terms of a two-phase model, which assumes that the nebular gas consists of a hot and a cold phase.
Methods. We derive general formulae for ([O iii]), the [O iii] forbidden line temperature, and (H i), the hydrogen Balmer jump temperature, in terms of the temperatures of the hot and cold phases, and .
Results. For large temperature differences, the values of required to account for the observed difference between ([O iii]) and (H i) are much lower than those deduced using the classical formulae that assume random and small amplitude temperature fluctuations. One should therefore be cautious when using a two-phase model to account for empirically derived values. We present a correction of a recent work by Giammanco & Beckman, who use a two-phase model to estimate the ionization rate of H ii regions by cosmic rays. We show that a very small amount of cold gas is sufficient to account for values typically inferred for H ii regions.
Key Words.:
ISM: general – ISM: H ii regions1 Introduction
Temperature fluctuations in H ii regions are a much-discussed problem. Peimbert (p67 (1967)) investigated for the first time the effects of such fluctuations on temperatures empirically derived from spectroscopic observations and found that they may lead to higher electron temperatures being derived from the collisionally excited [O iii] nebular-to-auroral forbidden-line ratio, ([O iii]), than those derived from the Balmer jump of the H i recombination spectrum, (H i). If significant temperature fluctuations exist in H ii regions and yet are ignored in the analysis, they may lead to underestimating ionic abundances calculated from collisionally excited lines (CELs) (e.g. Esteban et al. e02 (2002)). The parameter (Peimbert 1967) was introduced to quantitatively characterize temperature fluctuations. Since then the parameter has been extensively used in nebular studies. Under the conditions that , where is the local electron temperature and the average value weighted by the square of density. The value of can be determined either by comparing ([O iii]) and (H i) or by comparing ionic abundances derived from CELs and from recombination lines (RLs) (see Peimbert et al. p04 (2004), for further details).
Two-phase models, which approximate a nebula by two components of different physical conditions, represent an over-simplified, yet frequently used method of studying nebular physics (e.g. Viegas & Clegg v94 (1994); Zhang et al. z05 (2005)). Using a two-phase model, Stasińska (s02 (2002) ) points out that the classical picture of temperature fluctuations may be misleading under certain conditions, and three parameters are needed to characterize temperature inhomogeneities. One of the open questions in the study of H ii regions is that values of derived from observations are consistently higher than those predicted by photoionization models (Stasińska s00 (2000)). Recently, Giammanco & Beckman (g05 (2005); GB05 thereafter) constructed a two-temperature-phase model capable of explaining values deduced for a number of H ii regions by means of incorporating a component of cool ionic gas ionized by cosmic rays. However, values deduced from observations cannot be applied directly to two-phase models. This is because empirical values of deduced from observations were calculated from formulae derived by assuming random and small-amplitude temperature fluctuations, assumptions that are apparently broken for a two-phase model.
The purpose of the current work is to quantitatively study the relationship between the values predicted by two-phase models and those measured by observations. We show that, in the case of a very cold ionic gas component embedded in a ‘normal’ H ii region, deduced from observations using the empirical method may have significantly overestimated the real values.
2 Analysis
According to Peimbert (p67 (1967)), for a given ionic species of number density , the thermal structure of an H ii region can be characterized by an average temperature and a mean square temperature fluctuation parameter , defined as
| (1) |
and
| (2) |
respectively. Assuming , and can be determined from measured ([O iii]) and (H i) using relations,
| (3) |
and
| (4) |
(Peimbert p67 (1967); Garnett g92 (1992)). Esteban et al. (e02 (2002)) report values for a sample of H ii regions. Their values are reproduced in the first row of Table 1. Although they were obtained by comparing ionic abundances derived from CELs and from RLs, we assume that they are the same as would be deduced from from and using Eqs. (3) and (4). The assumption is supported by studies of Torres-Peimbert & Peimbert (t03 (2003)), who find general agreement between values inferred from the differences between and and those inferred from the apparent discrepancies between CEL and ORL abundances. Esteban et al. (e02 (2002)) did not provide values of . For the purpose of comparison, we follow GB05 and assume that ([O iii]), as given in the second row of Table 1. However, as pointed out previously by Stasińska (s02 (2002)), the empirical method of estimating using Eqs. (3) and (4) may be invalid under certain conditions. In the following, we show that in the two-phase model, values of that are required to account for the measured differences between and (or differences between ORL and CEL abundances) may be much lower than that derived from the empirical method.
In the framework of the two-phase model, which assumes that the electron temperature structure of an H ii region consists of a hot and a cold phase, we follow GB05 and assume equal densities of the two phases and an ionization fraction of unity for the hot gas. Electron temperatures are designated as and for the hot and cold phases, respectively. The intensity of an [O iii] forbidden line transition of wavelength is given by
| (5) |
where is the excitation energy of the upper level. It follows that
where is a constant depending only on atomic data, and super- or subscript ‘h’ and ‘c’ refer to quantities of the hot and cold phases, respectively. In the cold phase, the ionization fraction of oxygen is expected to be lower than that of hydrogen. As a reasonable approximation, we assume that . Our analysis is insensitive to this assumption since the cold phase essentially contributes no [O iii] forbidden line fluxes given its very low temperature and the fact that emissivities of forbidden lines decline exponentially with decreasing temperature (c.f Eq. 5). We thus obtain
| (7) |
where, using the notation of GB05, is the mass ratio of the cold to hot gas, and is the ionization fraction of hydrogen in the cold gas. It can be easily seen that for , .
Similarly, from the flux of the Balmer jump,
| (8) |
and the flux of H,
| (9) |
we have
| (10) |
or
| (11) |
Equation (10) shows that weights towards . Following GB05, for a two-phase model, we obtain
| (12) |
| (13) |
| (14) |
and
| (15) |
Therefore, for the two-phase scenario, and should be determined from Eqs. (7), (10), (12), and (13) instead of from Eqs. (3) and (4). The latter are only valid for random and small amplitude fluctuations.
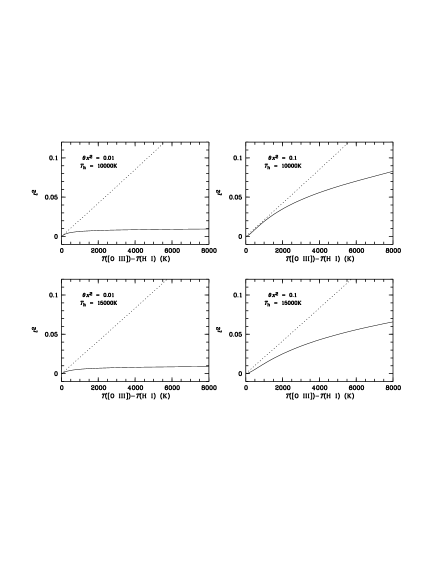
In Fig. 1 for given values of and , we compare as a function of derived from the empirical method using Eqs. (3) and (4), and that derived in the scenario of two-phase model using Eqs. (7), (10), and (13). The plots show that, depending on above a critical value of , the empirical method significantly overestimates , particularly for the case of small . The amount of deviation is insensitive to the value adopted for . In addition, we find that as the temperature difference between the two phases is larger than a critical value (typically K), empirical deduced from observations can no longer be used at their face values to constrain two-phase models, a point overlooked by GB05 as discussed in the following section.
3 New estimates of for GB05 model
GB05 showed that the ionization of cold neutral gas by cosmic rays may significantly contribute to temperature fluctuations. They used a two-phase model to explain values obtained by Esteban et al. (e02 (2002)) for a number of H ii regions. However, the high temperature difference between the two phases in GB05 model (see their Table 1) suggests that values obtained by Esteban et al. cannot be applied directly to two-phase models. Values of derived by GB05 need to be re-considered.
We re-estimate values for the sample of H ii regions of Esteban et al. (e02 (2002)). Following GB05, three values of are assumed, 100, 1000, and 4000 K. Under these conditions, temperature in the cold gas is too low to collisionally excite the [O iii] lines, and consequently Eq. (7) can be simplified to
| (16) |
Substituting values of and given by Esteban et al. (e02 (2002)) [hereafter referred as and , in order to distinguish them from those deduced from Eqs. (12) and (13)] into Eqs. (3) and (4), we obtain ([O iii])(,) and (H i)(,), which are tabulated in Rows 3 and 4 of Table 1. Note that here we take the same assumption by GB05 that ([O iii]). Then can be determined from Eq. (11), where , . Although the values of ([O iii])(,) thus obtained are slightly higher than the actual values deduced from observations (see Table 1), the resulting are hardly affected.
In Table 1 we compare our values to those of GB05 (given in parentheses); for low values of differences of up to a factor of a hundred are found. It can easily be seen that the discrepancies increase with decreasing temperature of the cold gas, as suggested by Fig. 1. For K, our derived values of are very low, suggesting that the values of reported by Esteban et al. (e02 (2002)) can be explained by the existence of a very small amount of cold gas.
Table 1 also gives and values derived from the Eqs. (12) and (13). As the Table shows, the real values are lower when than those derived from the empirical method. As a result, values of the cosmic ray ionization rate, , derived by GB05 have been grossly overestimated [c.f. their Eq. (17)]. Our conclusion is consistent with the range of values inferred for the Orion nebula from Gamma ray observations.
| Object | NGC 604 | NGC 5461 | NGC 5471 | NGC 2363 |
|---|---|---|---|---|
| 0.027 | 0.041 | 0.074 | 0.128 | |
| 8150 | 8600 | 14100 | 15700 | |
| ([O iii])(,) | 9052 | 9943 | 15913 | 18528 |
| (H i)(,) | 7783 | 8011 | 12358 | 12344 |
| 0.00013 | 0.00016 | 0.00009 | 0.00013 | |
| 0.00413 | 0.00053 | 0.00312 | 0.00429 | |
| 0.02511 | 0.03503 | 0.02401 | 0.03540 | |
| 9051 | 9941 | 15911 | 18526 | |
| 9011 | 9884 | 15860 | 18445 | |
| 8518 | 9370 | 15413 | 17719 | |
| 0.00013(0.028) | 0.00017(0.042) | 0.00010(0.075) | 0.00013(0.130) | |
| 0.00522(0.035) | 0.00659(0.052) | 0.00356(0.086) | 0.00480(0.146) | |
| 0.08690(0.10) | 0.10664(0.14) | 0.04378(0.14) | 0.05905(0.23) |
4 Conclusion
We have studied the relationship between values of predicted by a two-phase model and those derived empirically from observations (empirical method). Our results show that the existence of extremely cold gas within H ii regions may lead to overestimated calculated from empirically determined and . We stress that care should be taken when using the two-phase model to study large temperature fluctuations of H ii regions. In this model, CELs are hardly produced by the cold gas, which on the other hand makes a large contribution to the flux at the Balmer jump, due to the dependence of . Accordingly, the existence of a very small amount of cold material may lead to a large discrepancy between and . In other words, in spite of its small mass, the existence of extremely cold material can reproduce apparently large (as derived from the empirical method), much larger than the actual value [as defined by Eq. (2)].
Finally, we revisited the GB05 study of cosmic ray ionization as a mechanism for creating temperature fluctuations in H ii regions. While this provides a potential mechanism for creating cold ionized plasma in H ii regions, we show that the values of required to produce the ionization have been overestimated in their treatment, due to the discrepancy discussed above. Based on the formulae presented here, we re-estimated their model parameters. The corrections are apparent, particularly in cases where temperature of the cold gas component is low, resulting in lower values of that agree better with the estimates for the Orion nebula published in the literature.
Acknowledgements.
We thank the referee, Dr. C. Morisset, for helpful comments that improved clarity of the paper. We would also like to thank Dr. Morisset for computing new values of and , based on our estimates of . Those values are now tabulated in Table 1. YZ and XWL acknowledge support by NSFC grant #10325312.References
- (1) Esteban, C., Peimbert, M., Torres-Peimbert, S., & Rodríguez, M. 2002, ApJ, 581, 241
- (2) Garnett, D. R. 1992, AJ, 103, 1330
- (3) Giammanco, C., & Beckman, J. E. 2005, A&A, 437, L11 (GB05)
- (4) Peimbert, M. 1967, ApJ, 150, 825
- (5) Peimbert, M. , Peimbert, A., Ruiz, M. T., & Esteban, C. 2004, ApJ, 150, 431
- (6) Stasińska, G. 2000, RevMaxAA, 9, 158
- (7) Stasińska, G. 2002, RevMaxAA, 12, 62
- (8) Torres-Peimbert, S., & Peimbert, M. 2003, in IAU Symp. 209, Planetary Nebulae: Their Evolution and Role in the Universe, ed. P. R. Wood & M. Dopita (San Francisco: ASP), p363
- (9) Viegas, S. M., & Clegg, R. E. S. 1994, MNRAS, 271, 993
- (10) Zhang, Y., Liu, X.-W., Liu, Y., & Rubin, R. H. 2005, MNRAS, 358, 457