Steps towards a map of the nearby universe
Abstract
We present a new analysis of the Sloan Digital Sky Survey data aimed at producing a detailed map of the nearby () universe. Using neural networks trained on the available spectroscopic base of knowledge we derived distance estimates for million galaxies distributed over sq. deg. We also used unsupervised clustering tools developed in the framework of the VO-Tech project, to investigate the possibility to understand the nature of each object present in the field and, in particular, to produce a list of candidate AGNs and QSOs.
1 Introduction
The recent developments in the fields of wide field digital detectors, dedicated survey telescopes and computer sciences, promise to fulfill in a few years one of the oldest dreams of the scientific community, namely, the production of an accurate taxonomy of the nearby universe. At a very basic level, such taxonomy will consist in a detailed description of both positions and types for all objects matching well defined selection criteria (e.g. flux limited or volume limited samples). Even so, however, it will be of the uttermost relevance for many fields of cosmology and astroparticle physics [1, 2]. In what follows we shall shortly outline the first results of our ongoing efforts to produce a 3-D map of the nearby universe with a characterization of galaxy types in a few, broadly defined, categories: normal (early and late type) galaxies, AGN, QSO, etc. Such work takes place in the framework of the European VO-Technological Infrastructures project (VO-Tech, [4]). We used as input data the Sloan Digital Sky Survey Data Release 4 and/or 5 (hereafter SDSS4/5; [5]) which provides photometric data in 5 bands for several hundred million galaxies distributed over sq. deg. and additional spectroscopic information for a subsample of about 1 million extragalactic objects.
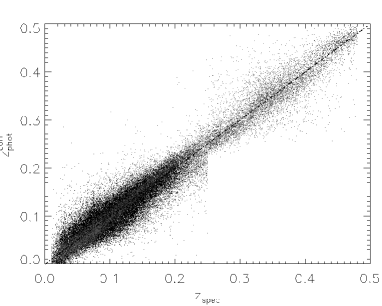
2 The photometric redshift
In order to evaluate photometric redshifts we made use of an improved version [6] of the Neural Networks (NNs) method presented in [7, 8]. Both steps were accomplished using the NN architecture known as MLP (Multi Layer Perceptron, [9, 10]).
We adopted a two steps approach: first we trained an MLP to recognize nearby (id est with redshift ) and distant () objects, then we trained two separate MLPs to work in the two different redshift regimes. Such approach finds a strong support in the fact that in the SDSS-5 catalogue, the distribution of galaxies inside the two different redshift intervals is dominated by two different galaxy populations: the Main Galaxy (MG) sample in the nearby region, and the Luminous Red Galaxies (LRG) in the distant one. The use of two separate networks ensures that the NNs achieve a good generalization capabilities in the nearby sample, leaving the biases mainly in the distant one. To perform the separation between MG and LRG objects, we extracted from the SDSS-4 Spectroscopic Subsample (hereafter, SpS) training, validation and test sets weighting, respectively, , and of the total number of objects (449,370 galaxies). The resulting test set, therefore, consisted of 89,874 randomly extracted objects. After this first step, the evaluation of photometric redshifts was performed working separately in the two regimes. Errors were then evaluated on the test set by measuring the dispersion of points in the vs plane, i. e. the variance of the variable, after performing an interpolative correction to correct for residual systematics.
Our results can be summarized as follows:
-
•
For the MG sample, the robust variance turned out to be over the whole redshift range and and for the nearby and distant objects, respectively.
-
•
For LRG sample we obtained over the whole range, and and for the nearby and distant samples, respectively.
3 The clustering
The implementation of a reliable classification scheme requires the partitioning of the observed parameter space in clusters of objects sharing some underlying common physical property. Obviously, since there is no a priori reason to assume that photometric classifications must reflect strictly any morphological classification, any effective classification method must be unsupervised and partition the photometric parameter space using only the statistical properties of the data themselves.
Most unsupervised methods, however, require the number of clusters to be provided a priori. This circumstance represents a serious problem when exploring large and complex data sets where the number of clusters can be very high or, in any case, unpredictable. A simple treshold criterium is not satisfactory in most astronomical applications due to the high degeneracy and the noisiness of the data which lead to the erroneous agglomeration of data. We therefore implemented a hierarchical approach which starts from a preliminary clustering performed using as unsupervised clustering algorithm the so called ”Probabilistic Principal Surfaces” or PPS described in [12, 13], and then makes use of the Negative Entropy concept and of a dendrogram structure to agglomerate the clusters found in the first phase [6].
| Cl. n | SP0 | SP1 | SP2 | SP3 | SP4 | SP6 |
|---|---|---|---|---|---|---|
| 1 | 69 | 145 | 9362 | 48 | 0 | 12 |
| 2 | 25 | 133 | 13370 | 10 | 0 | 12 |
| 3 | 149 | 132 | 63 | 64 | 0 | 5 |
| 4 | 44 | 3396 | 1530 | 189 | 67 | 1 |
| 5 | 202 | 85 | 447 | 2428 | 6 | 10 |
| 6 | 26 | 125 | 13728 | 12 | 0 | 12 |
| 7 | 0 | 0 | 0 | 0 | 0 | 484 |
| 8 | 1 | 1 | 1 | 0 | 0 | 329 |
| 9 | 541 | 1507 | 127 | 4750 | 18 | 1 |
| 10 | 89 | 474 | 2117 | 19 | 4 | 529 |
We first applied the PPS algorithm to the sample of spectroscopically selected SDSS DR-4 objects using as parameters for the clustering the 4 colours obtained from model magnitudes (u-g,g-r,r-i,i-z). We fixed the number of latent variables and latent bases of the PPS to 614 and 51 respectively, so obtaining at the end of this step 614 clusters, each formed by objects which only respond to a certain latent variables. We choose a large number of latent variables in order to obtain an accurate separation of objects and to avoid that any group of distinct but near points in the parameter space could be projected onto the same cluster by chance. These first order clusters were then fed to the NEC algorithm which determined the final number of clusters. The plateau analysis of the agglomerative process and the inspection of the dendrogram allowed to set the treshold to a value corresponding to 31 clusters. We present in table (1) the ten most populous clusters together with the distribution of the specClass index within each cluster. The additional 21 clusters represent less than 10 of the objects and are still under investigation. It needs to be emphasized that the clustering makes use of the photometric data only and the spectroscopic information is used only to validate them. As it can be seen, galaxies (SP2) clearly dominate clusters 1, 2 and 6. Whether this separation reflects or not some deeper differences among the three groups (such as, for instance, different morphologies), cannot be assessed on the grounds of presently available data. AGNs (SP3) dominate clusters 5 and 9 even though some contamination from galaxies exists. Late type stars (SP6) populate mainly clusters 7 and 8 and are strong contaminants of cluster 10 which also is dominated by galaxies. It needs to be stressed, however, that the use of the specClass as label must be taken with some caution since it is becoming increasingly evident that this index suffers from severe biases [14].
Acknowledgements: this work was sponsored by the Italian MIUR through a PRIN grant and by the EC through the VO-Tech project. The authors wish to thank G. Miele and G. Raiconi for useful discussions.
References
- [1] Cuoco A., D’Abrusco R., Longo G., Miele G. & Serpico P. D., JCAP 009 (2006) .
- [2] Blake C., Bridle S., MNRAS 363-4 (2005) 1329-1348.
- [3] Staiano A., De Vico L., Ciaramella A., Donalek C., Longo G., Raiconi G., Tagliaferri R., Amato R., Del Mondo C., Mangano G. & Miele G., IEEE (2005) in print.
- [4] WWW site: http://eurovotech.org.
- [5] Adelman-McCarthy J., et al., ApJS (2007) submitted.
- [6] D’Abrusco R., Staiano A., Longo G., Brescia M., De Filippis E., Paolillo & Tagliaferri R., ApJ (2006) submitted.
- [7] Tagliaferri R., Longo G., Andreon S., Capozziello S., Donalek C., & Giordano ,G., Lectures Notes in Computer Science 2859 (2003) 226.
- [8] Firth A. E., Lahav O., Somerville R.S., MNRAS 339 (2003) 1195.
- [9] Bishop C. M., Neural Networks for Pattern Recognition, Oxford University Press, Oxford, 1995.
- [10] Duda R.O., Hart P.E., Stork D.G., Pattern Classification, John Wiley & Sons Inc., Second Edition, 2001.
- [11] de Vaucouleurs G, de Vaucouleurs A., Corwin H.C. jr, Second Reference Catalogue of Bright Galaxies, University of Texas Press, Austen, 1976.
- [12] Chang K., Nonlinear Dimensionality Reduction Using Probabilistic Principal Surfaces, PhD Thesis, The University of Texas at Austin (USA), 2000.
- [13] Staiano A., Unsupervised Neural Networks for the Extraction of Scientific Information from Astronomical Data, PhD thesis, University of Salerno (Italy), 2003.
- [14] Sorrentino G., Radovich M. & Rifatto A., AA 451-3 (2006) 809-816.