The Remarkable 602 kpc Optical Filament Associated with a Poststarburst Galaxy in Coma Cluster111Based on data collected at the Subaru Telescope, which is operated by the National Astronomical Observatory of Japan.
Abstract
In the deep narrow band image of the Coma Cluster taken with Suprime-Cam of the Subaru telescope, we found an extremely long and narrow (60 kpc2 kpc) H emitting region associated with a poststarburst galaxy (D100). Follow up spectroscopy shows that the region has the same redshift as D100. The surface brightness of the region is typically 25 mag(AB) arcsec-2 in H which corresponds to 0.5 – 410-17erg s-1 cm-2 arcsec-2. We set two possible explanations for the origin of the region; gas stripped off from a merged dwarf, or gas stripped off from D100 by ram pressure. Either scenario has difficulty to fully explain all the observed characteristics of the region.
1 Introduction
Deep H-alpha imaging provides an opportunity to detect new faint extended features, even in well studied regions (e.g., Veilleux et al., 2003). In nearby cluster Abell 1367, Gavazzi et al. (2001) found extended ionized regions associated with starburst Irr galaxies. The size of the regions are 758 kpc, and 508 kpc. Yoshida et al. (2002) discovered another extremely extended ionized region (35 kpc) in Virgo cluster, which is found to be a part of 11025 kpc HI gas (Oosterloo & van Gorkom, 2005). Veilleux et al. (2003) used tunable filter for searching ionized gas around nearby galaxies. They found 20 kpc complexes/filaments in 6 galaxies out of 10. Another type of elongated gas is Magellanic Stream (hereafter MS; Mathewson, Cleary, Murray, 1974). MS is orbiting around our Galaxy, and emitting H (Weiner & Williams, 1996, hereafter WW96). The connection between such ionized region and the evolution of associated galaxy is, however, not understood.
In this paper, we report the serendipitous discovery of a long and narrow (60 kpc2 kpc) ionized region associated with a poststarburst galaxy D100 (Dressler, 1980, or GMP 2910, Godwin, Metcalfe & Peach, 1983) in the Coma cluster. We assume that the distance modulus of the Coma cluster as and (,,)=(0.73,0.24,0.72) (Spergel et al., 2006). Under these assumptions, 1 arcsec corresponds to 0.474 kpc at the distance.
2 Imaging Observation and Result
We observed 3427 arcmin region near the Coma cluster center ()(J2000.)=(12:59:26, +27:44:16) with Suprime-Cam (Miyazaki et al., 2002) at the Subaru Telescope on 28 Apr 2006 and 3 May 2006 UT (Table 1). We used three broad band filters, , , , and a narrow band filter (N-A-L671, hereafter NB). The NB filter is designed for observing H emitting objects in the Coma cluster at , and has bell-shaped transmission with central wavelength of 6712 Å and FWHM of 120 Å. The imaging data were reduced in standard manner. The limiting surface brightness and the PSF sizes of the final image are summarized in Table 1. We adopted SA113 (Landolt, 1992) for and band photometric standard. The photometric zero points are converted to AB magnitude, assuming AB-Landolt is 0.169 and -0.140 for and , respectively (Fukugita et al., 1995). The flux of NB and band are calibrated with spectrophotometric standard; GD153 (Borlin, Colina & Finley, 1995) for NB and HZ44 (Oke, 1990) for . The magnitude of the stars are m(GD153)=13.77(NB) and m(HZ44)=12.35() in AB system.
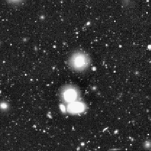
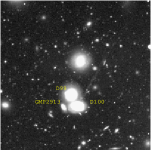
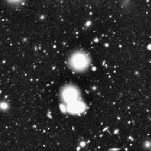
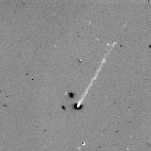
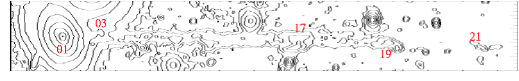
In order to create the H image, we subtract scaled -band image from NB image, so that the residual of typical stars and galaxies should be minimal. The resulting H image is shown in Figure 1, together with the broad band images. A striking feature can be seen in the H image: a narrow and straight ionized region reminiscent of a jet extends from the galaxy D100 to the north-east. The contour of NB surface brightness is shown in Figure 2. D100 is an Irr or Sab galaxy of magnitude. It is noted that the direction of the major axis of D100 is slightly different between the H image and three broad band images. Its neighbor D99 has different velocity, and thought to be a chance overlap (Caldwell, Rose, & Dendy, 1999; hereafter C99). The third galaxy GMP 2913 has no spectroscopic information in the literature.
We carefully surveyed archived data of D100, and found that the feature is vaguely recognized in the shallow -band image taken at the William Herschel Telescope (WHT) in 1996 (Komiyama et al., 2002), and in the -band Subaru image111taken from Subaru data archive system SMOKA http://smoka.nao.ac.jp/ taken in 2001. Bright parts are also visible in the shallow H image of Universidad Complutense de Madrid survey (Pérez-Gonzáles et al., 2003) 222http://t-rex.fis.ucm.es/ucm_survey/. The feature is therefore not transient over a time scale of 10 years.
3 Spectroscopic Observation and Result
The spectra of some part of the region were taken with Faint Object Camera and Spectrograph (Kashikawa et al., 2002) in multi object spectroscopy mode on 23 Jun 2006 UT. We used short slits whose lengths were 6 – 16 arcsec to obtain the spectra of bright filaments in the ionized region. The width of the slits was , giving the spectral resolution 700 with 300B grism. We obtained eight sets of 30 minutes exposures. The sky condition was not photometric. We observed HZ44 (Oke, 1990) for relative flux calibration.
The data were reduced in standard manner; bias subtraction, flat-fielding and distortion correction. For wavelength calibration, we used night-sky emissions. Background sky spectrum is constructed for each exposure from spectra where no feature is detected either in our NB image or H image. The sky subtracted spectra of the eight exposures are then scaled and coadded with 3-sigma clipping. Examples of the resulting spectra are shown in Figure 3.
The redshift of D100 center (ID=01) is estimated to be from H, [NII] and [SII] emissions. The value is consistent with of D100 itself reported by Smith et al. (2004). The vertical lines in Figure 3 indicate emission at the estimated redshift of D100. We also obtained a spectrum of neighbor galaxy GMP 2913. The galaxy shows strong H absorption, and the redshift estimated from the absorption is . The proximity of the redshift and the projected distance (9 kpc) suggests that GMP 2913 may have interacted, or be interacting with D100.
Each spectrum of emission line region is fitted with a linear continuum plus three-gaussian (H, and [NII]6548,6583) model in 6600 Å6800 Å. Since [SII]6717,6731 emission-lines at z=0.018 overlap both atmospheric emission and absorption, we did not include [SII] in our analysis. We also fit a single gaussian+continuum model to H and [OIII]5007, separately. The flux ratios of best-fit values are summarized in Table 2. The relative radial velocity data (column 4 in Table 2) show that the redshifts of ionized regions are close to the redshift of D100, indicating that the region is physically associated with D100. Since the spectra were obtained under non-photometric condition, we calculate H flux (Table 2 column 8) from NB surface brightness of imaging data (Table 2 column 5), NB filter response and observed spectrum.
C99 described spatially resolved spectra of D100 in detail. They reported that the galaxy has both strong emission and strong underlying Balmer absorption in the central 2 arcsec while only Balmer absorption is seen at 3 arcsec radius. Such configuration is also seen in our Figure 1. This suggests that central starburst was triggered shortly after star formation in the disk stopped by some reason. In our spectra, H absorption is seen at the regions over the core. In ID=02 spectra, which is in the emission line region, H emission is buried in strong Balmer absorption, and only [OIII] is detected. We therefore regard that among the values in Table 2 [NII]/H and [OIII]/H is upper limit, and H brightness is lower limit in the regions where continuum is detected (ID=01-04).
There is no signs of AGN activities because the ratio [OIII]/H is smaller than 0.49 at the center. The lack of AGN sign is consistent with previous studies of the galaxy (Quillen et al., 1999, C99).
4 Characteristics of the extended region
A distinct characteristic of the ionized region is its morphology; it is narrow (2 kpc), long (60 kpc), and straight. The region ends at the central region of D100, and no emission is found at the opposite side (Figure 1). The velocity field of the region is distorted and does not show any smooth global gradient, but it suggests that the region is kinematically connected to the center of D100 (Table 2). The nucleus of D100 shows starburst characteristics and its disk shows a poststarburst feature whose age is 0.25 Gyr (C99).
Bravo-Alfaro et al. (2000) observed HI around the center of Coma with typical threshold of 2-4 cm-2. Though their observed region include D100, they found no HI feature around D100. Regarding X-ray, Finoguenov et al. (2004) presented resolved X-ray map of Coma cluster center. In the map, no feature is recognized around D100.
The total mass of the ionized gas is estimated as follows. Since we have no information about inclination, we assume that the extention of the region is perpendicular to the line of sight, and it is approximated as 60kpc1kpc radius cylinder, hereafter. The typical H surface brightness of the region is erg cm-2 s-1arcsec-2 (Table 2). It corresponds to H photon flux of cm-2 s-1 str-1. The case B recombination coefficient at K is cm3 s-1 (Bland-Hawthorn & Maloney, 1999). Assuming optically thin gas and isotropic radiation field, the emission measure of the region is estimated as cm-6 pc. We assume that the thickness of the region kpc, and then the rms of the electron density is cm-3. If the gas is totally ionized and have uniform distribution, the mass of the ionized gas is about 1kpc2 60kpc 2 M⊙. The order of the estimated mass is comparable to the order of total gas mass in a dwarf galaxy. If ionization fraction is lower, the value is underestimated. However, if ionization fraction is lower than 0.9, for example, the HI column density is 3 cm-2 and must have been detected in HI observation by Bravo-Alfaro et al. (2000) whose threshold is 2-4 cm-2. We can conclude that the ionization fraction should be almost unity. If filling factor is low, on the other hand, the total mass should be smaller. The estimated value, 2 M⊙, is therefore the upper limit.
5 Possible explanation
At first glance, the straight morphology of the ionized region gives us the impression that it is a jet ejected from the galaxy nucleus. The lack of current AGN activity in D100 and no detection of radio jet around D100, however, make it difficult to interpret the ionized region as an AGN jet. In the following, we discuss on possible scenarios for the origin of the extended ionized region and answer the questions, 1) the origin of the gas, 2) the mechanism to form the long and narrow morphology, and 3) the ionization source.
5.1 Infalling dwarf scenario
One possibility is that the gas came from other object than D100; galaxy or gas cloud. The object would possibly be dissipated or absorbed by D100, because we can not find any giant galaxies near the region. The neighbor dwarf, GMP 2913, is apparently not connected to the region, and therefore GMP 2913 might not be the origin of the gas. A possible candidate is a small clump seen 4 arcsec away from the center of D100 (corresponds to ID=03 spectra in Table 2 and Figure 2), which could be a remnant core of infalling dwarf.
In this infalling dwarf hypothesis, either ram-pressure to the dwarf or tidal force by D100 can be a mechanism to form the region. A famous example of an elongated gas cloud without stars is MS. The width of MS is estimated to be 3.5 kpc (WW96). The length of MS can be calculated as 50 kpc from its extension in the sky (50 degree; e.g., Brüns et al., 2005), and the distance from us (50 kpc). The size is comparable to the extended region discussed here. The total HI mass of MS, 2-5108 M⊙(Moore & Davis, 1994; Putman et al., 2003a; Brüns et al., 2005), is also comparable to the estimated gas mass of the region. The mechanism which formed MS is still under argument (e.g., Cornors, Kawata, &Gibson, 2006, and references therein), but the same mechanism might have worked here. WW96 reported that the brightest parts of MS emit 2erg cm-2 s-1 arcsec-2 of H which is comparable to the H brightness observed for the region in this study(see Table 2). The difference is that the H emitting region in MS is patchy (Putman et al., 2003b), while the region in this study has smooth and wide-spread H emission (Figure 1,2). The difference may be explained by difference of ionization source.
The ionization source of bright spots of MS is first thought to be a friction with hot plasma of Galactic halo (WW96). Though the mechanism is argued to be insufficient for the luminosity of the bright spots in MS (Bland-Hawthorn & Maloney, 1999; Bland-Hawthorn & Putman, 2001; Bland-Hawthorn & Maloney, 2002), it could work effectively in hot intracluster plasma in Coma cluster. Putman et al. (2003b) suggested that some bright spots in MS, which are an order of magnitude stronger in H, may be produced through the interaction with halo debris. Similarly, the interaction with surrounding plasma in the Coma cluster could ionize the region in this study. We can see enhanced [NII]/H and [OIII]/H ratios at some part of the extended emission region, which implies a moderately low energy shocks of moderately metal rich gas.
To explain the H emission of MS, Bland-Hawthorn & Maloney (1999) showed that escaping photons from Galactic disk can ionize the spots. We checked whether escaping photons from D100 can ionize the region using simple model. The apparent size of H emitting region of D100 is arcsec2=1.2 str. Since typical H photon flux density of the extended region is cm-2 s-1 str-1, the total H photon flux is cm-2 s-1. Assuming the distance to the region from us to be 100Mpc, total H photon flux from the region is 41051 s-1 if the region is cylindrical. Since most of the disk is now in poststarburst phase, we simplify the model that ionizing photons are created only at the core, and calculate H photon from a cone of 60kpc depth and 1kpc radius circle, whose opening angle is 8.710-4 str. Since the volume of cone is 1/3 of cylinder, the flux from the cone is 1.3 1051 s-1. Assuming spherical symmetry, the whole ionizing photon flux from the core is estimated as 1.9 s-1. Following Kennicutt (1998), the starforming rate required to ionize the region is 200 M⊙ yr-1 in D100. If there has been a strong starburst at the D100 core for 2 years (60kpc / light speed), and the core region is free from dusts, the photon from the core can ionize the whole extended region.
Yet another ionizing source is EUV photons from hot plasma (Maloney & Bland-Hawthorn, 2001). Maloney & Bland-Hawthorn (2001) discussed that EUV from hot gas in cluster of galaxies can be ionizing source of gas clouds. Such ionizing EUV is found to be strong in Coma cluster (Bowyer et al., 2004), and it is also possible that the extended region is ionized by the EUV. Any of the three possible sources and their combination can ionize the extended region.
A possible infalling dwarf scenario is as follows, (1) A dwarf galaxy was trapped by the gravity of D100 and started to interact. (2) The gas in D100 disk lost angular momentum and fell into core. This stopped star formation in the disk and central starburst is triggered. (3) The dwarf expelled gas as a stream by the same mechanism as MS was formed. (4) The gas is orbiting around D100, or infalling into D100 and fully ionized by some mechanism discussed above.
The problem of this scenario is the configuration of the region. The stream seems to be smoothly connected to the core and there is no feature in the other side of the core. To reproduce such an appearance, the stream should end or be truncated just at our line of sight to D100. Moreover, as we see a straight morphology, the stream is observed as edge-on. The probability of such a configuration is very low.
The absense of smooth velocity gradient is another difficulty, since such stream is thought to have smooth velocity gradient.
5.2 Ram pressure stripping scenario
We should consider the other origin of the gas; the gas came from the disk of D100. Under this assumption, the mechanism to form the region would be the ram pressure stripping by surrounding gas. C99 noted that D100 shows little rotation at 121∘ position angle, which might imply that D100 have shallow gravitational potential. If this is the case, it is possible to strip the central gas of D100 very far away from the galaxy by ram pressure. Two examples of ionized gas stripped by ram pressure are reported by Gavazzi et al. (2001) in Abell 1367, whose sizes are 758kpc and 508kpc. Another example is discovered by Sun et al. (1990) in A3627 as 718 kpc X-ray tail. The ionizing source of the region can be the same as that of the infalling dwarf scenario; escaping photon from D100, moderate internal shock, and/or EUV photon from hot plasma.
In this scenario, the formation of the region is as follows. (1) A dwarf galaxy was trapped by the gravity of D100 and started to interact. The interacting galaxy could be neighboring GMP 2913 or a small clump near the core (ID=03). (2) The gas in D100 disk lost angular momentum and fell into core. This stopped star formation in the disk and central starburst was triggered. (3) The condensed central gas received ram-pressure of intracluster medium (ICM) and is stripped with disturbed velocity. (4) The gas was blown far out of the disk. This scenario explains the distorted velocity field in the region and the fact that the end of the stream is connected to the core.
A difficulty of the scenario is that the ionized region is too narrow and straight (260kpc) compared with the examples found in previous studies (e.g., 758kpc, 508kpc Gavazzi et al., 2001) and simulations (e.g. Roediger et al., 2006). Bland-Hawthorn et al. (1995) discussed that intracluster plasma can confine ionized gas in Fornax cluster. Similar confinement process may be able to confine such a narrow (kpc) and long extended region in Coma cluster, since surrounding hot plasma is much denser than Fornax. This scenario also requires some reason why ram pressure began to act just after D100 experienced the merger. If the infall of disk gas was induced not by the minor merger, but by the ram pressure, the coincidence is explained in natural. Though it is known that most of field poststarburst galaxies are created by merger/interaction (e.g. Zabludoff et al., 1996; Blake et al., 2004; Goto, 2005, and references therein), such ram-pressure induced poststarburst in rich clusters has also been suggested by some previous studies (Poggianti et al., 2004; Pracy et al., 2005). Currently we do not have simulations to reproduce such a morphology of ionized gas.
We will need some additional data, such as resolved and much deep X-ray and radio data, metallicity of the gas, to investigate the nature of the region in detail. As we set slit along the region, spectroscopy of higher spatial resolution across the region would give us another hints about velocity structure and gas excitation, which may set constraints on gas properties and confinement mechanism. We also require some model simulations to reproduce the morphology.
References
- Bravo-Alfaro et al. (2000) Bravo-Alfaro, H., Cayatte, V., van Gorkom, J.H., Balkowski, C. 2000, AJ, 119, 580
- Blake et al. (2004) Blake, C. et al. 2004, MNRAS, 355, 713
- Brüns et al. (2005) Brüns, C. et al. 2005, A&A, 432, 45
- Bowyer et al. (2004) Bowyer, S., Korpela, E.J., Lampton, M., Jones, T.W. 2004, ApJ, 605, 168
- Borlin, Colina & Finley (1995) Borlin, R.C., Colina, L., Finley, D.S. 1995, AJ, 110, 1316
- Bland-Hawthorn et al. (1995) Bland-Hawthorn, J., Ekers, R.D.,van Breugel, W., Koekemoer, A., Taylor, K. 1995, ApJ, 447, L77
- Bland-Hawthorn & Maloney (1999) Bland-Hawthorn, J., Maloney, P.R. 1999, ApJ, 510, L33
- Bland-Hawthorn & Putman (2001) Bland-Hawthorn, J., Putman, M.E. 2001, in ASP Conf. Ser. 240 Gas and Galaxy Evolution, ed. J. E. Hibbard, M. Rupen, & J. H. van Gorkom (San Francisco: ASP), 369
- Bland-Hawthorn & Maloney (2002) Bland-Hawthorn, J., Maloney, P.R. 2002, in ASP Conf. Ser. 254, Extragalactic Gas at Low Redshift, ed. J. S. Mulchaey & J. Stocke (San Francisco: ASP), 267
- Caldwell et al. (1999) Caldwell, N., Rose, J.A., Dendy, K. 1999, AJ, 117, 140 (C99)
- Cornors et al. (2006) Connors, T.W., Kawata, D., Gibson, B.K. 2006, MNRAS, 371, 108
- Dressler (1980) Dressler, A., 1980, ApJS, 42, 565
- Finoguenov et al. (2004) Finoguenov, A., Briel, U.G., Henry, J.P., Gavazzi, G., Iglesias-Paramo, J., Boselli, A. 2004, A&A, 419, 47
- Fukugita et al. (1995) Fukugita, M., Shimasaku, K., Ichikawa, T. 1995, PASP, 107, 945
- Gavazzi et al. (2001) Gavazzi, G., Boselli, A., Mayer, L., Iglesias-Paramo, J., Vílchez, J.M., Carrasco, L. 2001, ApJ, 563, L23
- Godwin et al. (1983) Godwin, J.G., Metcalfe, N., & Peach, J.V. 1983, MNRAS, 202, 113
- Goto (2005) Goto, T. 2005, MNRAS, 357, 937
- Kashikawa et al. (2002) Kashikawa, N. et al. 2002, PASJ, 54, 819
- Kennicutt (1998) Kennicutt, R.C. Jr. 1998, ARA&A, 36, 189
- Komiyama et al. (2002) Komiyama, Y. et al. 2002, ApJS, 138, 265
- Landolt (1992) Landolt, A.U. 1992, AJ, 104, 340
- Maloney & Bland-Hawthorn (2001) Maloney, Philip R.; Bland-Hawthorn, J. 2001, ApJ, 553, L129
- Mathewson, Cleary, Murray (1974) Mathewson, D. S., Cleary, M. N., Murray, J. D. 1974, ApJ, 190, 291
- Miyazaki et al. (2002) Miyazaki, S., et al. 2002, PASJ, 54, 833
- Moore & Davis (1994) Moore, B., Davis, M. 1994, MNRAS, 270, 209
- Oke (1990) Oke, J.B., 1990, AJ, 99, 1621
- Oosterloo & van Gorkom (2005) Oosterloo, T., van Gorkom, J. 2005, A&A, 437, L19
- Pérez-Gonzáles et al. (2003) Peréz-Gonzárez, P.G., Zamorano, J., Gallego, J., Aragón-Salamanca, Gil de Paz, A. 2003 ApJ, 591, 827
- Poggianti et al. (2004) Poggianti, B.M. et al. 2004, ApJ, 601, 197
- Pracy et al. (2005) Pracy, M.B. et al. 2005, MNRAS, 359, 1421
- Putman et al. (2003a) Putman, M.E., Staveley-Smith, L., Freeman, K.C., Gibson, B.K., Barnes, D.G. 2003, ApJ, 586, 170
- Putman et al. (2003b) Putman, M.E., Bland-Hawthorn, J., Veilleux, S., Gibson, B.K., Freeman, K.C., Maloney, P.R., 2003, ApJ, 597, 948
- Quillen et al. (1999) Quillen, A.C., Rieke, G.H., Rieke, M.J., Caldwell, N., Engelbracht, C.W. 1999, ApJ, 518, 632
- Roediger et al. (2006) Roediger, E., Brüggen, M., Hoeft, M., 2006, MNRAS, 371, 609
- Smith et al. (2004) Smith, R.J. et al., 2004, AJ, 128, 1558
- Spergel et al. (2006) Spergel, D.N. et al., 2006, (astro-ph/0603449)
- Sun et al. (1990) Sun, M., Jones, C., Forman, W., Nulsen, P.E.J., Donahue, M., Voit, G.M., 2006, ApJ, 638, L81
- Weiner & Williams (1996) Weiner, B.J., Williams, T.B. 1996, AJ, 111, 1156 (WW96)
- Veilleux et al. (2003) Veilleux, S., Shopbell, P.L., Rupke, D.S., Bland-Hawthorn, J., Cecil, G. 2003, AJ, 126, 2185
- Yoshida et al. (2002) Yoshida, M., et al. 2002, ApJ, 567, 118
- Zabludoff et al. (1996) Zabludoff, A.I. et al. 1996, ApJ, 466, 104
| filter | PSF size | SBlim(ABmag arcsec-2) | Date(UT) | exposure |
|---|---|---|---|---|
| 1”.06 | 28.8 | 2006-04-28 | 2450sec | |
| 2006-05-03 | 3450sec | |||
| 0”.75 | 27.7 | 2006-04-28 | 11300 sec | |
| 2006-05-03 | 160 sec | |||
| 1”.10 | 27.2 | 2006-04-28 | 5240 sec | |
| 2006-05-03 | 2240 sec + 1120 sec | |||
| NB | 0”.76 | 27.7 | 2006-04-28 | 81800 sec |
| 2006-05-03 | 3120 sec |
| ID | Length | Distance | SBNB | [NII]/H | [OIII]/H | FHα | |
|---|---|---|---|---|---|---|---|
| (1) | (2) | (3) | (4) | (5) | (6) | (7) | (8) |
| 01 | 2.7 | 0.0 | 0 | 18.5 | 0.47 | 0.45 | 233. |
| 02 | 1.2 | 2.2 | +24 | 20.4 | 0.86 | [OIII]bbOnly [OIII] is detected | 10.2 |
| 03 | 1.2 | 3.8 | +59 | 21.3 | 0.53 | 0.45 | 7.0 |
| 04 | 1.2 | 8.2 | +122 | 23.7 | 0.85 | 0.59 | 1.8 |
| 05 | 1.5 | 11.7 | +55 | 24.4 | 0.86 | – | 1.2 |
| 06 | 1.2 | 16.3 | +71 | 24.8 | 0.57 | – | 1.5 |
| 07 | 1.2 | 18.1 | +105 | 24.6 | 0.80 | – | 1.3 |
| 08 | 1.5 | 20.6 | +63 | 24.2 | 0.52 | – | 2.3 |
| 09 | 2.4 | 23.9 | +116 | 24.2 | 0.73 | 0.67 | 2.1 |
| 10 | 0.9 | 31.1 | +314 | 24.2 | 0.64 | HccOnly H is detected | 2.6 |
| 11 | 1.5 | 32.3 | +78 | 24.5 | 0.66 | HccOnly H is detected | 2.1 |
| 12 | 2.1 | 40.9 | +74 | 24.6 | 0.87 | 0.58 | 1.9 |
| 13 | 1.8 | 50.3 | +150 | 24.9 | 0.63 | HccOnly H is detected | 1.8 |
| 14 | 2.1 | 53.1 | +134 | 25.1 | 0.61 | – | 1.3 |
| 15 | 2.7 | 60.4 | +161 | 25.8 | 0.65 | – | 0.64 |
| 16 | 1.5 | 64.3 | +2 | 24.8 | 0.57 | HccOnly H is detected | 1.3 |
| 17 | 2.1 | 66.1 | +110 | 23.9 | 0.44 | HccOnly H is detected | 3.7 |
| 18 | 1.5 | 89.3 | +182 | 25.1 | 0.59 | – | 1.3 |
| 19 | 2.4 | 91.2 | +130 | 24.3 | 0.54 | 0.29 | 3.1 |
| 20 | 2.1 | 94.0 | +138 | 24.9 | 0.81 | 0.42 | 1.5 |
| 21 | 1.2 | 118.0 | +303 | 26.0 | 0.88 | – | 0.64 |
| 22 | 3.0 | 121.3 | +149 | 26.2 | 0.69 | – | 0.59 |