Vol.0 (200x) No.0, 000–000
11email: wenyu_wang@sjtu.edu.cn 22institutetext: Department of Physics, Shanghai Jiao Tong University, 800 Dongchuan Road, Shanghai 200240, PRC
X-Ray Properties of the Point Source Population in the Spiral Galaxy NGC 5055 (M63) with Chandra
Abstract
By analyzing the Chandra ACIS S3 data we studied the X-ray properties of the low-mass and high-mass X-ray binary populations in the nearby spiral galaxy NGC 5055. A total of 43 X-ray point sources were detected within the 2 effective radii, with 31 sources located on the disk and the rest 12 sources in the bulge. The resolved point sources dominate the total X-ray emission of the galaxy by accounting for about 80% of the total counts in 0.3–10 keV. By carrying out the spectral fittings we calculated the 0.3–10.0 keV luminosities of all the detected X-ray point sources and found that they span a wide range from a few erg s-1 to over erg s-1. After compensating for the incompleteness at the low luminosity end, we find that the corrected XLF of the bulge population is well fitted with a broken power-law model with a break at erg s-1, while the profile of the disk population’s XLF agrees with a single power-law distribution with a slope of . The disk population is significantly richer at erg s-1 than the bulge population, inferring that the disk may have undergone relatively recent, strong starbursts that significantly increased the HMXB population, although ongoing starbursts are also observed in the nuclear region. Similar XLF profiles of the bulge and disk populations were found in M81. However, in most other spiral galaxies different patterns of the spatial variation of the XLF profiles from the bulge to the disk have been observed, indicating that the star formation and evolution history may be more complex than we have expected.
keywords:
galaxies: individual (NGC 5055)—X-ray: binaries—stars: luminosity function—stars: formation1 Introduction
The study of the X-ray properties of the bright point sources in spiral galaxies, most of which are low-mass X-ray binaries (LMXBs) and high-mass X-ray binaries (HMXBs), may provide us with valuable observational constraints on the star formation and evolution history in the disk and bulge of the host galaxy. With the superb high spatial resolution of the Chandra X-Ray Observatory, a large population of X-ray point sources have been resolved for the first time in some nearby spiral galaxies. In a few specific cases, distinct X-ray characteristics have been revealed for the sources located in the bulge and those in the disk, which can be interpreted as the evidence for the spatial variation of stellar population composition that reflects the differences in star formation history (e.g., Tennant et al. 2001; Kong et al. 2002; Soria & Kong 2002). In this paper we present a Chandra study of the point sources in the nearby starburst galaxy NGC 5055 (M63; SA(rs)bc), which is one of the prototype Arm Class 3 flocculent galaxies (Elmegreen & Elmegreen 1987) that shows regular, two-arm spiral structure to a radius of 4.0 kpc in the near-infrared band. The optical center of the galaxy is identified at RA=13h15m49.25s Dec=+42d01m49.3s (J2000; Maoz et al. 1996). The LINER nucleus is UV bright and is surrounded by luminous young star clusters, showing clear stellar absorption signatures (Maoz et al. 1998; Leitherer et al. 2002). The inclination and position angles of the galaxy are deduced to be and , respectively (Garcia-Gomez & Athanassoula 1991). We organize the paper as follows. In §2, we describe the observation and data reduction. In §3, we present the imaging analysis. In §4, we investigate the X-ray properties of the detected point sources, which includes the temporal and spectral analysis as well as the calculations of hardness ratios and X-ray luminosity functions (XLFs). Finally, we discuss and summarize the results in §5 and §6, respectively. Throughout the paper, we quote errors at the 90% confidence level unless mentioned otherwise. We adopt a distance of 7.2 Mpc to NGC 5055 (Michele & Serra 1997), which is consistent with the distance calculated from its redshift () if cosmological parameters km s-1 Mpc-1, and are adopted. At this distance corresponds to about 2.1 kpc.
2 Observation and Data Reduction
NGC 5055 was observed with Chandra with the CCD 0, 1, 2, 3, 6 and 7 of the Chandra Advanced CCD Imaging Spectrometer (ACIS) in operation on two separate occasions, which started on August 27, 2001 for a total exposure of 28.4 ks, and on April 15, 2001 for a short duration of 2.4 ks, respectively. The events were telemetered in faint mode and the data were collected with a frame time of 3.2 s. The CCD temperature was set at 120 C. In the August 27 observation from which the data of this work was drawn, the center of galaxy was positioned on the ACIS S3 chip (CCD 7) with an offset of from the nominal pointing for the S3 chip, so nearly all the emission of the galaxy was covered by the S3 chip. In the analysis that follows, we used the CIAO software version 2.3 to process the data extracted from the S3 chip only. In order to apply the latest calibration, we started with the Level-1 data. We kept events with ASCA grades 0, 2, 3, 4 and 6, and excluded bad pixels, bad columns, and columns adjacent to bad columns and node boundaries. In order to identify occasional periods of high background, we extracted the lightcurve of the source-free regions on the S3 chip in 2.5–7.0 keV where the background flares are expected to be most visible. We found that up to about 5% of the total exposure time was affected by high background flares. By excluding the contaminated intervals we obtained a clean exposure of 27.0 ks for the analysis.
3 X-ray Image
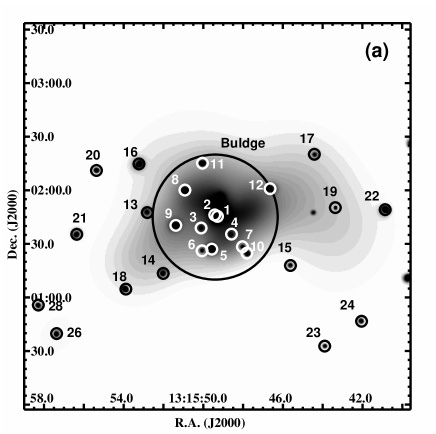
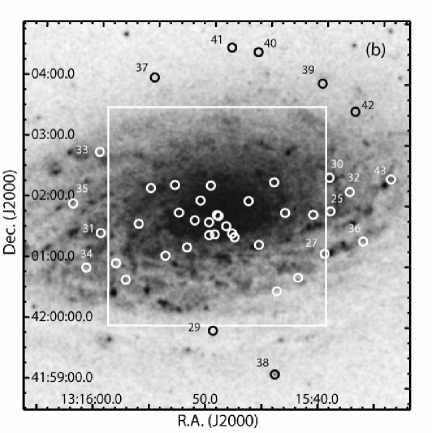
In Figure 1a we plot the Chandra S3 image of NGC 5055 in 0.3–10.0 keV in logarithmic scale. The image has been corrected for both exposure and background, and has been smoothed by using a minimum signal-to-noise ratio of 3 and a maximum signal-to-noise ratio of 5 per beam. We find that the X-ray emission from the galaxy is dominated by a large population of X-ray point sources, which contribute about 80% of the total counts of the galaxy in 0.3–10.0 keV. The diffuse X-ray emission is nearly symmetric within about , and is slightly elongated in east-west direction in outer regions. No diffuse X-rays is significantly detected beyond , which is approximate the size of the bulge (; Baggett et al. 1998). We find that the diffuse X-ray emission is peaked at RA=13h15m49.3s DEC=+42d01m45.5s (J2000) where a bright nuclear X-ray point source is detected. The position of the X-ray peak also coincides with the optical and infrared centers of the galaxy to within . In Figure 1b we show the optical image drawn from the Digital Sky Survey (DSS) in linear scale, on which the locations of the 43 detected X-ray sources are marked with circles for comparison (§4.1).
4 X-ray Point Sources
4.1 Detections
We detected X-Ray point sources on the ACIS S3 image using the CIAO tool celldetect with a signal-to-noise threshold of 3. We first restricted the detections in 0.3–10.0 keV, and then crosschecked the results in 0.5–7.0 keV. We also have crosschecked the results by using the wavelet-based CIAO tool wavdetect and by visional-examination. On the whole S3 CCD 46 sources are detected, of which 43 sources are located within the 2 effective radii (1 effective radius = 1 = ; Thornley 1996). In this work we focus our study on these 43 sources only. The spatial distribution of the 43 sources show a clear concentration towards the galaxy center, inferring that most of them are physically associated with the galaxy. Based on the results of the deep Chandra observations of the blank fields (Mushotzky et al. 2000), we performed Monte-Carlo simulations and found that only few () of the 43 point sources may be unrelated background sources. By overlaying the positions of these sources on the DSS image (Fig. 1b), we find that 31 of the 43 sources are detected on the disk with a tendency to reside on the spiral arms. The rest 12 sources are detected in the bulge, of which up to about source may be a disk population source that is misclassified into the bulge population due to the project effect. At the X-ray peak a nuclear source is detected, however it does not have the highest count rate among the detected sources. We list the properties of the 43 sources in Table 1, where we sort them in the order of increasing projected distance from the center of the galaxy.
4.2 Temporal Variabilities
After removing the intervals of strong background flares, we extracted the 0.3–10.0 keV lightcurves of the detected sources that each has more than 60 counts in total. We calculated the Kolmogoroff-Smirov (K-S) statistic for each of the lightcurves against the null hypothesis that the count rate of the source is temporally invariant over the effective exposure time; if the source is temporally invariant, the cumulative fraction of the count is a diagonal from 0 to 1. We find that Src 22 (243 counts), Src 35 (600 counts) and Src 38 (102 counts) show significant evidence for temporal variations on the 90% confidence level (Fig. 3). This is not likely to be caused by the variations of the local background, since the K-S test gives negative results in the background variability. For the central source (Src 1), the temporal variability is less significant in terms of the K-S test, possibly because K-S tests are most sensitive around the median value of the independent variable. However, by calculating the variability parameter , where and are the maximum and minimum count rates, respectively, and and are the corresponding errors, we find that Src 1 is marginally variable on timescales of 1 5 hr during which its count rate changed by about .
4.3 Hardness Ratios
Since the background-corrected count rates of most of the resolved X-ray point sources are low, which makes it impossible to carry out spectral analysis for each source, we turned to study the hardness ratios of all the resolved sources that are defined as and , where , and are the background-corrected counts extracted in 0.3–1.0 keV (), 1.0–2.0 keV () and 2.0–10.0 keV (), respectively. The same approach has been adopted in earlier works (e.g., Sarazin et al. 2000). We list the calculated hardness ratios and the 1 errors in column 7 and 8 of Table 1, and plot against in Figure 4. In the figure we show the predicted hardness ratio distributions for an absorbed power-law model by adopting column densities of cm-2 (the Galactic value; Dickey & Lockman 1990) and cm-2, and photon indices of and 4.0, as well as the hardness ratios for an absorbed blackbody model by adopting the Galactic absorption and temperatures of and 0.1 keV.
We find that the distribution of the colors is similar to that of M31 (Kong et al. 2002) and the nearly face-on, gas-rich spiral galaxy M83 (Soria & Wu 2003). Most of the sources lie in a broad diagonal band extending from to (1,1). One source (Src 19) that is located at a moderate distance () to the galaxy center has hardness ratios of about and is thus identified as a supersoft source (SSS). If the selection criterions of Supper et al. (1997) and Kahabka (1999) are applied, 5 other sources (Src 6, 7, 9, 13 and 14) can be identified as candidates of SSSs as well since they satisfy and , or . If we slacken the selection limit to and (e.g. Swartz et al. 2002), Src 12 and 15 can also be classified as SSS candidates. As is shown in Figure 4 the hardness ratios of these supersoft sources can approximately be described with an absorbed black-body model with the temperatures ranging from about 0.2 to 0.3 keV. Src 31 has a hardness ratio of (1,1), which appears to have been heavily absorbed by a column density significantly larger than the Galactic value. Since Src 31 is located far away from the center of the galaxy () and its hardness ratios agree with those expected by an absorbed power-law model with an absorption of cm-2 and a photon index of , it is probably an unrelated background AGN.
For comparison, within the 2 region the measured mean hardness ratios for the total X-ray emission of the galaxy are . For the same region, the mean hardness ratios are for all the resolved X-ray point sources and for the unresolved diffuse emission.
4.4 Spectral Analysis
We first extracted and studied the cumulative spectrum of all the 42 off-center point sources resolved within 2. The backgrounds were extracted from a carefully selected annulus around each source. By applying the latest CALDB we have corrected for the charge transfer inefficiency (CTI) and the continuous degradation in the ACIS quantum efficiency, which is especially severe at lower energies. To avoid the effects of calibration uncertainties at lower energies and instrumental background at higher energies we restricted the spectral analysis to the 0.7–7.0 keV energy band. We found that the cumulative spectrum cannot be fitted with a single absorbed power-law model, if the absorption is fixed at the Galactic value. When the absorption was allowed to vary, however, the absorbed power-law model can give an acceptable fit (). The resulting absorption and photon index are cm-2 and , respectively. With these parameters the total flux of all the 42 off-center sources in 0.3–10.0 keV is calculated to be erg s-1 cm-2. We also have divided the resolved off-center sources into the disk and the bulge populations and studied their cumulative spectra in 0.7–7.0 keV. The cumulative spectrum of the disk population can be marginally fitted with an absorbed power-law model with an absorption of cm-2 and a photon index of (). The spectrum of bulge population, on the other hand, can be well fitted with a model that consists of a power-law component and a black body component, both subjected to a common absorption that is consistent with the Galactic value (). The obtained photon index and temperature are and keV, respectively.
By excluding all the detected point sources we examined the spectrum of the diffuse emissions extracted in that includes the contributions from both the unresolved point sources and the inter-stellar medium (ISM). The background was extracted in a source-free boundary region on the S3 chip as far away as possible from the galaxy. We first attempted to fit the spectrum with an absorbed power-law or an absorbed MEKAL model, but neither of them gives an acceptable fit to the data, unless the absorption is allowed to increase to unreasonable, physically meaningless values. Thus we attempted to apply a model that consists of a MEKAL component to represent the emission of the hot ISM, and a power-law component to represent the contribution of X-ray binaries, with both components subjected to a common absorption. Since the abundance of the MEKAL component is poorly constrained, we tentatively fixed it to 0.1 , which is obtained by Tyler et al. (2004) for the central region of NGC 5055. We found that when the absorption is fixed to the Galactic value, the model provides us with an acceptable fit (), with a gas temperature of keV and a photon index of . The total flux of the emission in 0.3–10.0 keV is erg s-1 cm-2, of which about 54% can be ascribed to the power-law component.
Of the 43 X-ray sources resolved within 2, 10 sources (Src 1, 5, 8, 9, 16, 18, 22, 25, 27 and 35) have a total counts larger than 100. We extracted the individual spectra of these sources and the corresponding background spectra in annular regions adjacent to where the source spectra were extracted. We fitted each spectrum with an absorbed power-law model and/or an absorbed multicolor disk blackbody model (DBB), and list the results in Table 2. The spectrum of the center source (Src 1) is well fitted by an absorbed power-law model with a photon index of , which is typical for those of supermassive black holes in active galaxies. The 0.3–10.0 keV luminosity of Src 1 corrected for the absorption is calculated to be erg s-1, which is lower than that of most low-luminosity AGNs. The spectrum of the brightest source Src 35, which showed significant temporal variations during the observation (§4.2), can be fitted with an absorbed DBB model with an inner disk temperature of keV. This source is a candidate ultra-luminous X-ray source (ULX) since its 0.3–10.0 keV luminosity is erg s-1.
According to the previous studies of the SSSs in spiral galaxies (e.g., M101, Pence et al. 2001; M31, Kong et al. 2002; M83, Soria & Wu 2003), SSSs are probably white dwarfs fueled by accretion from their low-mass companions. Indeed we find that the spectrum of the SSS candidate Src 9 can be fitted with an absorbed DBB model with the inner temperature of keV, which is consistent with that of an accreting white dwarf.
4.5 X-Ray Luminosity Functions of the Resolved Off-Center Point Sources
All Off-Center Sources Detected within 2
Assuming that all the off-center X-ray point sources
resolved within 2 are located at the distance of NGC 5055, we
calculated their X-ray luminosities in 0.3–10.0 keV using the
best-fit spectral parameters for their cumulative spectrum. The
conversion factor of the counts is erg
cts-1, and the resulting luminosities range from to erg s-1. With these we
construct the XLF and illustrate it in Figure 5a. Since the detection
of the point sources is not complete at the faint end of the
luminosity function, by adopting a method similar to that utilized
in, e.g., Kim and Fabbiano (2004) and Xu et al. (2005) we ran
Monte-Carlo simulations to create fake point sources on the S3 image
of NGC 5055 in 0.3–10.0 keV. In the simulations we created fake
sources by using the MARX package (Wise et al. 1997), and assumed
that the radial distribution of the fake sources at any given
luminosity follows the r1/4 law (de Vaucouleurs 1948). At a
given luminosity, we determined how many of the fake
sources can be detected with the same technique used in §4.1. In
such a way we corrected both the observed XLF and the background for the unresolved sources.
The corrected XLF are also shown in Figure 5b.
We fitted both the uncorrected and corrected cumulative XLFs with the software Sherpa by using either a single power-law profile or a broken power-law profile
where L/L38 is the 0.3–10.0 keV luminosity in units of
erg s-1, and and are the slope
indices for the lower and higher luminosity ends, respectively. We
find that for the uncorrected XLF, the fittings with the single
power-law model can be immediately rejected
(). It overestimates the data at the high
luminosities and underestimates the data at the low luminosities. The
use of the broken power-law model, on the other hand, can
significantly improve the fittings and provide us with an acceptable
fit (). The best-fit parameters at the 90% confidence level are
erg s-1,
and
. For the XLF corrected for the
effect of incompleteness at the faint end of the XLF,
the single power-law model also cannot give an acceptable
fit (), while the broken power-law model can
improve the fittings significantly () with the
best-fit parameters erg
s-1, and
.
Bulge and Disk Populations
We studied the XLFs of the bulge and disk population
sources (Fig. 5) and found that the single
power-law model is inadequate to describe both the uncorrected XLFs of
the bulge population () and the disk population
(). The broken power-law model, however, gives
a good fit to the data with erg s-1, and
for the bulge population
(), and
erg s-1, and
for the disk population
(). We then corrected the XLFs for the
incompleteness at the low energies using the method as is described
above for all the resolved off-center sources. For the bulge
population, a broken power-law is still needed to describe the XLF
with erg s-1,
and
(). The
corrected XLF of the disk population is found to be nicely
consistent with a single power-law model with a slope of
().
We have crosschecked our results on the XLF profiles of all the resolved off-center sources and disk population by excluding Src 35, the brightest source that may bias the fittings. We found that within the errors the best-fit parameters are consistent with those obtained with Src 35 included.
5 Discussion
We calculated the 0.3–10.0 keV luminosities of 43 X-ray point sources detected within 2 of NGC 5055 and found that they span a wide range from about erg s-1 to erg s-1, which is typical for spiral galaxies (M81; Tennant et al. 2001, NGC 1637; Immler et al. 2003) and early-type galaxies (Xu et al. 2005 and references therein) at similar distances. After compensating for the incompleteness at the low luminosity end, we find that the corrected XLF of the bulge population is well fitted with a broken power-law model, while the profile of the disk population’s XLF satisfies a single power-law distribution. The disk population is significantly richer at the high-luminosity end ( erg s-1) than the bulge population, inferring that the star formation history of the bulge is distinct from that of the disk. In other words, the disk may have undergone recent, strong starbursts that significantly increased the HMXB population, although ongoing starbursts are also observed in the nuclear region of NGC 5055. Quite similar phenomenon has been found in M81 (also identified as a LINER or Sy1.8) by Tennant et al. (2001), who reported that the XLF of the bulge population exhibits a break at erg s-1, and the XLF of the disk population can be fitted with a single power-law.
Different patterns of the spatial variation of the XLF profiles from the bulge to the disk are observed in other spiral galaxies. In M83, a SAB(s)c galaxy that hosts a starburst nucleus (Soira & Wu 2003), the profile of the bulge XLF is consistent with a single power-law with a slope of 0.8, while a break appears on the XLF of the disk population at about erg s-1. This might suggest that, unlike in NGC 5055 and M81, there is no strong starbursts in M83 on the disk in the recent past, and the HMXBs dominate the source population only in the nuclear starburst regions, rather than over the entire disk. In M31 Primini et al. (1993), Shirey et al. (2001), Kaaret (2002) and Kong et al. (2002) found that the cumulative XLF of all the detected point sources has a distinct break at erg s-1, a slope of for the high luminosity end and a slope of for the low luminosity end. Kong et al. (2002) also studied the cumulative XLFs of the point sources in the inner bulge, outer bulge and disk regions. They found that there is a spatial variation in the XLF profiles; both the break luminosity and the slope of the cumulative XLF increase outwards monotonously from the inner bulge, where the LMXBs dominate the X-ray emission of point sources, to the disk. In a few other spiral galaxies where the XLFs have been studied in detail, however, the report of a break on the XLF is not available in literatures. These includes M101 (Pence et al. 2001), IC342 (Bauer et al. 2003; Kong 2003), NGC 891 (Temple et al. 2005), NGC 1637 (Immler et al. 2003) and M51 (Terashima & Wilson 2004), for which the slopes of the XLFs range from about 0.5 to about 1.
The diversity of the XLF profiles of the X-ray sources in spiral galaxies indicates that the star formation and evolution history may be more complex than we have expected, so that further careful multi-band investigations are needed. In addition, we suggest that, since typically only 50-150 X-ray point sources are detected per galaxy, the uncertainty introduced by the small number statistics may bias our conclusions on the XLF profile to a certain extent. In Xu et al. (2005), by performing Monte-Carlo simulations we showed that even if there is an universal break on the XLFs of early-type galaxies, the statistical errors definitely preclude us from measuring it correctly. The same result can be applied to the measurements of the XLF profiles of spiral galaxies.
6 Summary
We detected a total of 43 X-ray point sources (12 in the bulge and 31 on the disk) within the 2 effective radii of NGC 5055, whose 0.3–10.0 keV luminosities range from a few erg s-1 to over erg s-1. After compensating for the incompleteness at the low luminosity end, the corrected XLF of the bulge population is well fitted with a broken power-law model ( erg s-1), while the XLF of the disk population satisfies a single power-law distribution (). The disk population is significantly richer at erg s-1 than the bulge population, inferring that the disk may have undergone relatively recent, strong starbursts that significantly increased the HMXB population, although ongoing starbursts are also observed in the nuclear region. This is similar to what has been found in M81. In most other spiral galaxies, however, different patterns of the spatial variation of the XLF profiles from the bulge to the disk are observed, indicating that the star formation and evolution history may be more complex than we have expected.
Acknowledgements.
This work was supported by the National Science Foundation of China (Grant No. 10273009 and 10233040), Shanghai Key Projects in Basic Research No. 04JC14079.References
- [1] Baggett W. E., Baggett S. M., Anderson K. S. J. 1998, AJ, 116, 1626
- [2] Bauer F. E., Brandt W. N., Lehmer B. 2003, AJ, 126, 2797
- [3] de Vaucouleurs G. 1948, Ann. d’Astrophys., 11, 247
- [4] Dickey J. M., Lockman F. J. 1990, ARA&A, 28, 215
- [5] Elmegreen D. M., Elmegreen B. G. 1987, ApJ, 314, 3
- [6] Garcia-Gomez C., Athanassoula E. 1991, A&AS, 89, 159
- [7] Immler S., Wang Q. D., Leonard D. C. et al. 2003, ApJ, 595, 727
- [8] Kaaret P. 2002, ApJ, 578, 114
- [9] Kahabka P. 1999, A&A, 344, 459
- [10] Kahabka P. 2002, A&A, 388, 100
- [11] Kim D.-W., Fabbiano G. 2004, ApJ, 611, 846
- [12] Kong A. K. H. 2003, MNRAS, 346, 265
- [13] Kong A. K. H., Garcia M. R., Primini F. A. et al. 2002, ApJ, 577, 738
- [14] Leitherer C., Li I.-H., Calzetti D. et al. 2002, ApJS, 140, 303
- [15] Maoz D., Filippenko A. V., Ho L. C. et al. 1996, ApJS, 107, 215
- [16] Maoz D., Koratkar A., Shields J. C. et al. 1998, AJ, 116, 55
- [17] Michele D. V., Serra R. 1997, Met, 3, 26
- [18] Mushotzky R. F., Cowie L. L., Barger A. J. et al. 2000, Nature, 404, 459
- [19] Pence W. D., Snowden S. L., Mukai K. et al. 2001, ApJ, 561, 189
- [20] Primini F. A., Forman W., Jones C. 1993, ApJ, 410, 615
- [21] Sarazin C. L., Irwin J. A., Bregman J. N. 2000, ApJ, 544, L101
- [22] Shirey R., Soria R., Borozdin K. et al. 2001, A&A, 365, L195
- [23] Soria R., Kong A. K. H. 2002, ApJ, 572, L33
- [24] Soria R., Wu K. 2003, A&A, 410, 53
- [25] Supper R., Hasinger G., Pietsch W. et al. 1997, A&A, 317, 328
- [26] Swartz D. A., Ghosh K. K., Suleimanov V. et al. 2002, ApJ, 574, 382
- [27] Temple R. F., Raychaudhury S., Stevens I. R. 2005, MNRAS, 362, 581
- [28] Tennant A. F., Wu K., Ghosh K. K. 2001, ApJ, 549, L43
- [29] Terashima Y., Wilson A. S. 2004, ApJ, 601, 735
- [30] Thornley M. D. 1996, ApJ, 469, L45
- [31] Tyler K., Quillen A. C., LaPage A. et al. 2004, ApJ, 610, 213
- [32] Wise M. W., Huenemoerder D. P., Davis J. E. 1997, ASPC, 125, 477
- [33] Xu Y.-H., Xu H.-G., Zhang Z.-L. et al. 2005, ApJ, 631, 809
| Src. | R.A.(J2000) | Dec.(2000) | count rate | d | (0.3–10.0 keV) | b | c | notes d |
|---|---|---|---|---|---|---|---|---|
| No. | (h:m:s) | (d:m:s) | ( cnt s-1) | (arcsec) | ( erg s-1) | |||
| 1 | 13:15:49.287 | +42:01:45.41 | 6.70 | 0 | 3.83 | b, c, v | ||
| 2 | 13:15:49.423 | +42:01:46.23 | 2.88 | 1.727 | 1.44 | b, | ||
| 3 | 13:15:50.109 | +42:01:38.90 | 0.53 | 11.23 | 0.30 | b, | ||
| 4 | 13:15:48.581 | +42:01:35.48 | 0.46 | 12.66 | 0.24 | b | ||
| 5 | 13:15:49.570 | +42:01:27.06 | 4.51 | 18.61 | 2.56 | b | ||
| 6 | 13:15:50.061 | +42:01:26.12 | 0.99 | 21.12 | 0.58 | b, s | ||
| 7 | 13:15:48.033 | +42:01:28.42 | 0.56 | 21.99 | 0.32 | b, s | ||
| 8 | 13:15:50.923 | +42:02:00.13 | 3.76 | 23.42 | 2.16 | b | ||
| 9 | 13:15:51.380 | +42:01:40.38 | 7.51 | 23.86 | 4.16 | b, s, v | ||
| 10 | 13:15:47.807 | +42:01:24.85 | 3.19 | 26.35 | 1.79 | b | ||
| 11 | 13:15:50.042 | +42:02:15.21 | 2.80 | 30.96 | 1.60 | b | ||
| 12 | 13:15:46.642 | +42:02:00.89 | 3.37 | 33.28 | 1.92 | b, s, v | ||
| 13 | 13:15:52.813 | +42:01:47.54 | 0.67 | 39.35 | 0.37 | s | ||
| 14 | 13:15:52.013 | +42:01:13.47 | 1.05 | 44.07 | 0.61 | s | ||
| 15 | 13:15:45.619 | +42:01:17.90 | 0.39 | 49.26 | 0.21 | s | ||
| 16 | 13:15:53.232 | +42:02:14.79 | 8.87 | 52.87 | 5.10 | |||
| 17 | 13:15:44.417 | +42:02:20.17 | 0.58 | 64.43 | 0.34 | |||
| 18 | 13:15:53.889 | +42:01:04.68 | 4.83 | 65.49 | 2.80 | |||
| 19 | 13:15:43.364 | +42:01:50.30 | 0.73 | 66.17 | 0.42 | s | ||
| 20 | 13:15:55.369 | +42:02:11.11 | 0.84 | 72.47 | 0.46 | |||
| 21 | 13:15:56.358 | +42:01:35.35 | 1.42 | 79.43 | 0.83 | |||
| 22 | 13:15:40.858 | +42:01:49.16 | 8.71 | 93.98 | 5.02 | v | ||
| 23 | 13:15:43.900 | +42:00:32.75 | 0.55 | 94.25 | 0.31 | |||
| 24 | 13:15:42.048 | +42:00:46.67 | 0.68 | 99.78 | 0.37 | |||
| 25 | 13:15:39.338 | +42:01:53.27 | 5.89 | 111.1 | 3.42 | |||
| 26 | 13:15:57.370 | +42:00:39.78 | 1.02 | 111.4 | 0.65 | |||
| 27 | 13:15:39.739 | +42:01:11.00 | 5.79 | 111.8 | 3.36 | |||
| 28 | 13:15:58.286 | +42:00:55.74 | 0.87 | 111.9 | 0.50 | |||
| 29 | 13:15:49.488 | +41:59:51.84 | 2.16 | 113.5 | 1.25 | |||
| 30 | 13:15:39.496 | +42:02:26.35 | 2.43 | 116.5 | 1.41 | |||
| 31 | 13:15:59.716 | +42:01:25.17 | 0.45 | 117.9 | 0.26 | |||
| 32 | 13:15:37.668 | +42:02:12.76 | 1.46 | 132.3 | 0.84 | |||
| 33 | 13:16:00.013 | +42:02:45.36 | 0.82 | 133.6 | 0.45 | |||
| 34 | 13:16:00.916 | +42:00:50.72 | 0.46 | 140.6 | 0.26 | |||
| 35 | 13:16:02.251 | +42:01:53.63 | 21.4 | 144.6 | 12.49 | v | ||
| 36 | 13:15:36.348 | +42:01:24.17 | 1.32 | 145.7 | 0.75 | |||
| 37 | 13:15:55.308 | +42:04:00.39 | 1.29 | 150.7 | 0.74 | |||
| 38 | 13:15:43.878 | +41:59:10.46 | 3.50 | 166.2 | 2.02 | v, u | ||
| 39 | 13:15:40.339 | +42:03:59.03 | 0.74 | 166.6 | 0.44 | |||
| 40 | 13:15:46.141 | +42:04:28.37 | 0.77 | 166.6 | 0.45 | |||
| 41 | 13:15:48.505 | +42:04:32.15 | 1.01 | 166.9 | 0.59 | |||
| 42 | 13:15:37.359 | +42:03:32.19 | 1.21 | 170.4 | 0.71 | |||
| 43 | 13:15:34.029 | +42:02:26.31 | 0.61 | 174.8 | 0.29 |
a The columns are arranged as follows: (1) source number;
(2)-(3): right ascension and declination (J2000); (4) count rate and
its error; (5) projected distance d to the center of the
galaxy; (6) intrinsic X-ray luminosity , assuming that the source
is located at the distance of NGC 5055 and only subjected to the
Galactic absorption ( cm-2; Dickey &
Lockman 1990); (7)-(8): hardness ratios and the 1 errors (§4.3); and (9) notes.
= (M-S)/(M+S), = (H-S)/(H+S)
d Abbreviations are b: source in bulge; c: central source;
s: candidate of supersoft source; u: ultra luminous x-ray source;
and v: source shows temporal variability.
| Power-law Model | DBB Model | ||||||||
| Src. | / | / | |||||||
| No. | ( cm-2) | (erg s-1 cm-2) | ( cm-2) | (keV) | (erg s-1 cm-2) | ||||
| 1 | 0.013/fixed | 7.7/7 | 5.10 | 0.013/fixed | 3.5/7 | 3.62 | |||
| 5 | 0.013/fixed | 3.5/4 | 7.64 | ||||||
| 8 | 0.013/fixed | 1.2/3 | 3.95 | 0.013/fixed | 1.9/3 | 2.67 | |||
| 9 | 0.013/fixed | 5.0/5 | 4.29 | ||||||
| 16 | 0.013/fixed | 7.8/9 | 7.18 | 0.013/fixed | 7.9/9 | 5.18 | |||
| 18 | 0.013/fixed | 1.4/3 | 17.14 | 0.39/2 | 7.48 | ||||
| 22 | 0.013/fixed | 10.6/9 | 7.85 | 0.013/fixed | 8.5/10 | 5.00 | |||
| 25 | 1.5/5 | 5.02 | 2.9/5 | 4.34 | |||||
| 27 | 4.9/4 | 3.11 | 4.9/4 | 2.30 | |||||
| 35 | 19.6/22 | 10.75 | 17.4/22 | 8.96 | |||||
a Errors are quoted at the 90% confidence level.