High Resolution Imaging of Warm and Dense Molecular Gas in the Nuclear Region of the Luminous Infrared Galaxy NGC 6240
Abstract
We present resolution CO (3–2), HCO+(4–3) and continuum images of the luminous infrared galaxy NGC 6240 obtained at the Submillimeter Array. We find that the spatially resolved CO (3–2), HCO+(4–3) and the emission peaks between the two nuclear components that are both known to harbor AGNs. Our Large Velocity Gradient (LVG) analysis performed on each velocity channel suggests that the peak of the molecular gas emission traced in our observations is warm (T = 20 – 100 K), dense ( cm-3) and moderately optically thin ( – 2) in the central 1 kpc. We also find large column densities of cm-2. Such extreme conditions are observed over km s-1 centered around the CO derived systemic velocity. The derived molecular gas mass from the CO (3–2) emission and a CO-to-H2 conversion factor commonly used for ULIRGs is M⊙, and this is consistent with the mass derived from previous CO (2–1) observations. The gas is highly turbulent in the central kpc ( km s-1). Furthermore, possible inflow or outflow activity is suggested from the CO (3–2) velocity distribution. We tentatively state that M⊙ of isolated CO (3–2) emission seen west of the northern disk may be associated with outflows from starburst superwinds, but the gas outflow scenario from one of the central AGN is not completely ruled out. Piecing all of the information together, the central region of NGC 6240 harbors 2 AGNs, M⊙ of molecular gas mass, M⊙ of dust mass, and has possible evidence of inflow and outflow activity.
Subject headings:
galaxies: formation, galaxies: interaction, galaxies: starburst, galaxies: kinematics and dynamics, galaxies: individual (NGC 6240)1. Introduction
(Ultra) Luminous Infrared Galaxies [(U)LIRGs] are systems discovered in the local universe that emit extremely large luminosity in the far infrared (see Sanders & Mirabel, 1996; Lonsdale, Farrah & Smith, 2006, for review). Their disturbed optical/NIR morphologies (e.g. Armus, Heckman & Miley, 1987; Surace et al., 1998; Farrah et al., 2001; Bushouse et al., 2002) and the highly compact molecular gas emission (Downes & Solomon, 1998) suggest that collisions/mergers of gas rich galaxies and subsequent radial inflow of gas toward the central region is primarily responsible for triggering extensive bursts of nuclear star formation (Scoville et al., 2000), feeding the obscured central AGN (Imanishi, Dudley & Maloney, 2006), or most likely, both (Genzel et al., 1998). Such inflow activity was already predicted in early numerical simulation studies that involve collisions of two massive gas rich galaxies (Barnes & Hernquist, 1996; Mihos & Hernquist, 1996; Iono, Yun & Mihos, 2004). More recent simulation studies that include a more realistic set of gas physics and the evolution of a central black hole have tied the merger event with radial gas inflow, central starbursts, black hole feeding, and a powerful gas outflow (Springel, Di Matteo & Hernquist, 2005; Hopkins et al., 2005; Di Matteo, Springel & Hernquist, 2005; Narayanan et al., 2006). These simulations have predicted a self-consistent evolutionary scenario from mergers to ULIRGs with a brief optical QSO phase (Hopkins et al., 2006).
High resolution observations of molecular gas tracers in (U)LIRGs and have been limited to low transition CO emission obtained at mm interferometers. Past single dish measurements of dense gas tracers such as HCN (Gao & Solomon, 2004) have found that molecular gas in (U)LIRGs is highly compressed and dense. Thus, obtaining sensitive and high spatial resolution images of high excitation molecular gas emission will provide extremely valuable information regarding the star formation process during a merger and will further constrain the physics implemented in the evolution simulations. In addition, recent surveys of molecular gas traced in high transition CO in high- galaxies (Greve et al., 2005; Tacconi et al., 2006) will allow us to conduct a direct comparison of the gas properties with local counterparts.
Here we present interferometric CO (3–2), HCO+(4–3), and continuum observations of the luminous infrared galaxy (LIRG) NGC 6240 obtained at the SMA (Ho, Moran & Lo, 2004). Both molecular lines are known to trace warmer and denser molecular gas than the commonly observed mm lines such as CO (1–0) or CO (2–1). Past SMA observations toward infrared bright galaxies suggest that the distribution of the CO (3–2) emission is significantly different from the lower transition lines of CO (Iono et al., 2004; Wang et al., 2004).
1.1. Multi-Wavelength Properties of NGC 6240
NGC 6240 is an infrared luminous merger (L L⊙) (Yun & Carilli, 2002) at a distance of DL = 107 Mpc ( pc)111Adopting H0 = 70 km s-1 Mpc-1, = 0.3, = 0.7. Its disturbed optical morphology and the compact double nuclei suggest that NGC 6240 is a late stage merger. The presence of AGN and extended starbursts were already suggested from early X-ray observations using a variety of spaceborne instruments (i.e. Ikebe et al., 2000, and references therein). More recently, Chandra has resolved the central region into two AGNs separated by (Komossa et al., 2003), providing significant evidence that NGC 6240 is a merger of two AGN host galaxies. Recent XMM-Newton spectroscopy has revealed a significant contribution of starburst activity to the extended X-ray emission (Boller et al., 2003; Netzer et al., 2005).
Optical and infrared observations using ground based and spaceborne telescopes have also been used to study this galaxy intensively. HST and Keck imaging have resolved each nucleus into several distinct components (Gerssen et al., 2004; Max et al., 2005) with an apparently dusty central region. A large velocity gradient in ionized gas has been identified using optical spectroscopy (Gerssen et al., 2004). Near IR imaging has also shown the presence of two -band nuclei (Scoville et al., 2000; Bogdanovic et al., 2003). Signatures of starbursts appear to dominate the MIR spectrum (Lutz et al., 2003). Mid IR spectroscopy using IRS on the Spitzer Space Telescope suggest a minor ( – 20%) contribution of the AGN to the bolometric luminosity (Armus et al., 2006), but mid infrared spectra obtained at Keck suggest that the dominant power-source could be explained by starbursts or an AGN (Egami et al., 2006). Optical spectroscopy using Subaru has revealed significant H2 emission north of the southern nucleus, suggesting that the medium between the two nuclei is dominated by starburst super-winds from the southern nucleus (Ohyama et al., 2000). Finally, a star formation rate of M⊙ yr-1 is obtained from a fit to the FIR SED (Yun & Carilli, 2002) and using the Schmidt law derived in Kennicutt (1998) to covert to the Star Formation Rate (SFR).
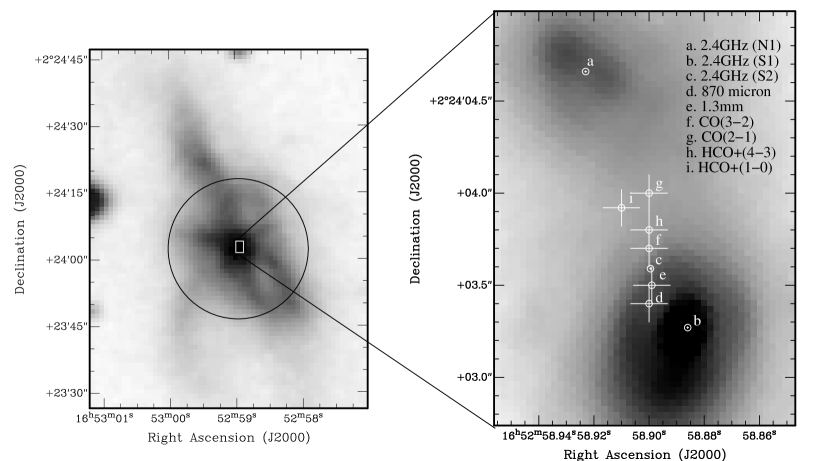
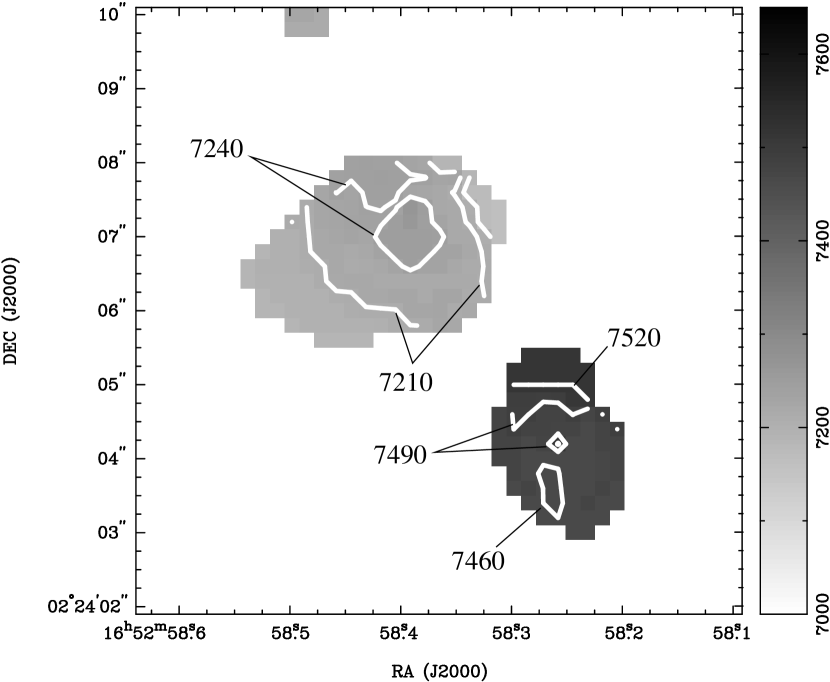
Interferometric millimeter studies have identified significant amounts of molecular gas in NGC 6240 (Bryant & Scoville, 1999; Tacconi et al., 1999; Nakanishi et al., 2005). The bulk of cold and dense gas peaks between the two optical/X-ray nuclei, close to the region where significant H2 emission (Ohyama et al., 2000) is found (Figure 1). Millimeter continuum emission also peaks in the same region. Molecular gas kinematics traced in CO (2–1) emission show a large velocity gradient between the two nuclei, suggesting that M⊙ of molecular gas is in the process of accumulating in the new dynamical center between the two nuclei.
MERLIN observations (Beswick et al., 2001) have detected both AGNs with highly disturbed H I gas in absorption. Further, high resolution VLBA observations (Gallimore & Beswick, 2004) have detected two compact radio sources (N1 and S1 in Figure 1) and an additional component (S2) north of the southern nucleus (S1). Gallimore & Beswick (2004) attribute N1 and S1 to compact radio emission associated with the AGNs, and S2 as a radio supernova or material ejected from S1. An H2O maser detected near S1 (Hagiwara, Diamond & Miyoshi, 2003) is attributable to either a jet associated with the southern AGN, or with shocks caused by the immense collision. From their low resolution VLA maps, Colbert et al. (1994) have found significant centimeter emission west of N1. This emission is resolved into four distinct components, and they suggest shell material from galactic super-wind as an origin of the emission.
This article is organized as follows. In §2, we present our observational method and the detailed calibration scheme adopted for the SMA observations. The CO (3–2) and HCO+(4–3) moment maps are presented in §3, along with the continuum image which was made by averaging the emission in the line free channels. §4 focuses on the physical properties of gas. We provide a discussion of our results in §5, and conclude this paper in §6.
2. Observations and Data Reduction
NGC 6240 was observed on October 9 and 14, 2005 using both the compact (unprojected baselines = 16 – 69 meters) and extended configurations (unprojected baselines = 50 – 182 meters) of the SMA. These data were taken in excellent atmospheric conditions ( = 0.05 – 0.06). The digital correlator was configured with 2048 channels for the entire 2 GHz bandwidth for each sideband. The receivers were tuned to the redshifted CO (3–2) ( GHz) emission line in the lower sideband (LSB), which allows us to simultaneously obtain the HCO+(4–3) ( GHz) line in the upper sideband (USB). The adopted tuning frequency was 337.533 GHz (LSB) using = 7339 km s-1. We used and (Laurent-Muehleisen et al., 1997) as our phase reference center. Initial data calibration were carried out in the IDL based SMA calibration package MIR, where 3C279, 3C454.3 and Uranus were used for bandpass calibration. Absolute flux calibration was performed using Uranus, and time dependent gain calibration was performed using the 1.6 Jy QSO 1743-038 (14 degrees away from NGC 6240) and the 1.4 Jy QSO 1549+026 (16 degrees away from NGC 6240) as references.
Synthesis imaging was performed in MIRIAD. Channel maps with 25 km s-1 velocity resolution were made for the CO (3–2) line. We further varied the visibility weighting from natural (i.e. maximum sensitivity) which gave a synthesized beam size of (position angle = 49 degrees; Figure 2 (left)) to uniform (i.e. maximum angular resolution) which gave a synthesized beam size of (position angle = 49 degrees; Figure 2 (right)). Unity weights are assigned for each visibility point in natural weighting, giving the best S/N and the coarsest angular resolution. On the other hand, uniform weighting gives the highest angular resolution at the cost of lower S/N. This is achieved by weighting each visibility point by the reciprocal of the number of data points found in a grid centered around each visibility point. The rms noise level was 22 mJy and 78 mJy for the natural and uniformly weighted maps respectively. In addition, in order to derive the peak coordinates of the CO (3–2) emission, we have constructed an image using only the longest baseline data which gave a synthesized beam size of (position angle = 41 degrees). For the natural weighted beam, the first sidelobes are significant at the 50% level north and south of the main synthesized beam. Sidelobes at 10% level are seen in various positions, the effect of which should be negligible with proper deconvolution. For the uniformly weighted beam, the first significant () sidelobes are located north-south of the main beam. CLEANing was performed down to 1.5 times the rms noise level of each channel map. For the deconvolution algorithm, we chose CLEAN instead of the Maximum Entropy Method (MEM) since the emission is strong and relatively compact with both the natural and uniformly weighted beams.
The HCO+(4–3) channel maps were made using natural weighting, which gave a (position angle = 42 degrees) beam. We note that the HCO+(4–3) emission occurs near the edge of the bandpass, and these observations may be missing flux at the low velocity end. Continuum subtraction was performed by removing a linear baseline in the visibilities in both sidebands. The 880 continuum image was made by adding all of the line free channels in the bandpass of both sidebands. The rms noise level for the continuum map was 6 mJy. From the S/N of the maps, we estimate the astrometric accuracy of the CO (3–2) maps presented here to be , and for the HCO+(4–3) and 880 maps.
3. Results
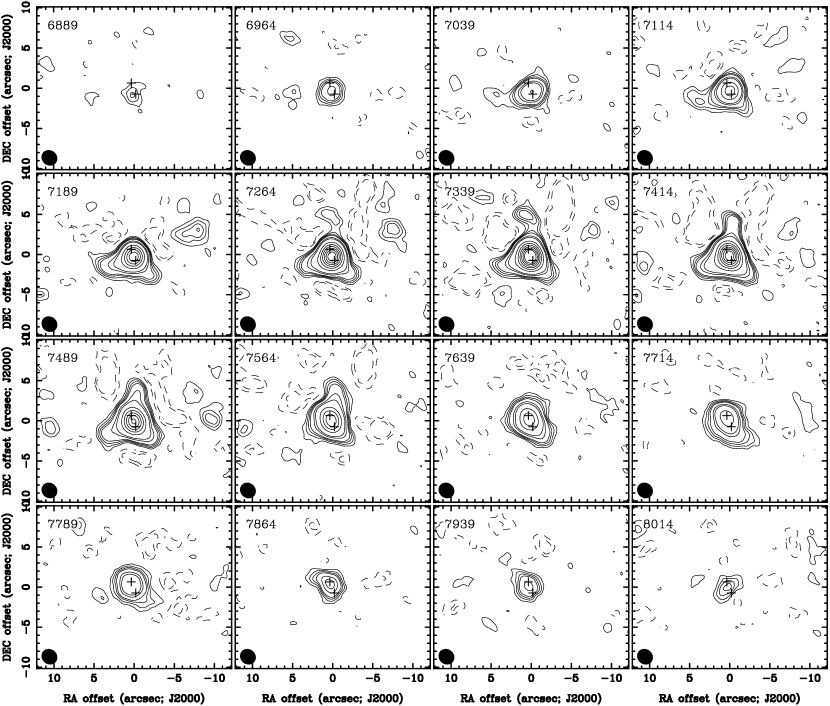
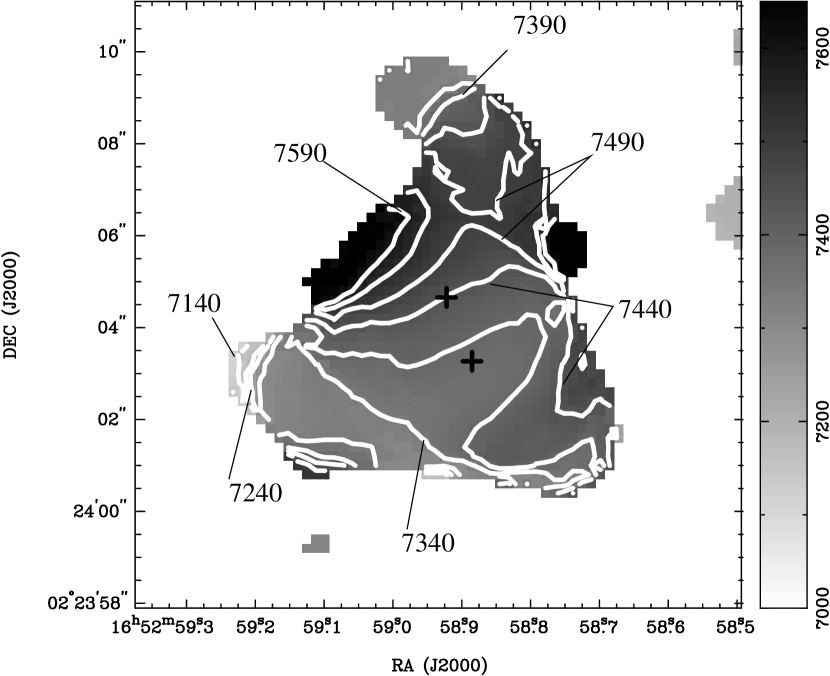
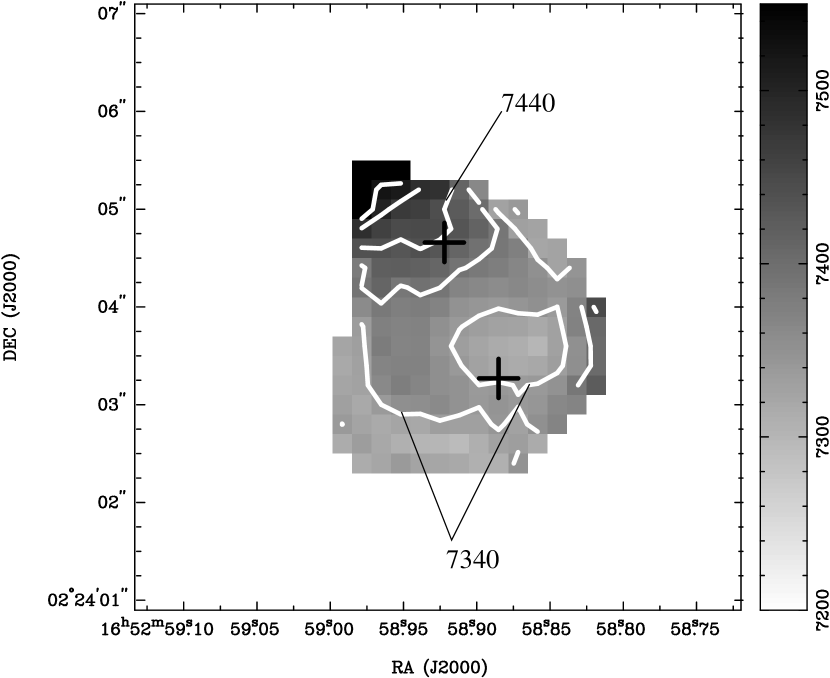
The channel maps of CO (3–2) emission are provided in Figure 3. Figure 4 (left) shows the integrated intensity map of the natural weighted CO (3–2) emission, and Figure 4 (right) shows the uniformly weighted image of the central . Figure 5 show the velocity distribution with the same angular resolution as in Figure 4. The velocity distribution of the western complex (WC hereafter; see below) alone is shown in Figure 6. The integrated intensity maps are clipped at 1.5 times the rms in each channel, whereas the velocity distribution maps are clipped at 3 times the rms. The position velocity maps obtained along the two AGNs are shown in Figure 7. Figure 8 shows the HCO+(4–3) and emission images of NGC 6240. A summary of the derived parameters is shown in Table 1.
3.1. CO (3–2) Emission
3.1.1 Distribution
The size of the CO (3–2) emission region in the integrated intensity map of Figure 4 () extends 4.4 kpc in both north-south and east-west directions. The coordinates of the peak determined from the highest resolution map obtained by just using data in the extended configuration are and . This is coincident with the radio component (S2) at and (error ) (Gallimore & Beswick, 2004) to within which is comparable to the astrometric accuracy of the SMA. While the inner region of the map shown in Figure 4 (left) is not spatially resolved with this map, there are several distinct kpc scale features that dominate the emission in the periphery; (1) the emission that extends to the east, (2) the emission that extends to the north, and (3) the isolated emission west of the main CO (3–2) concentration (WC).
The kpc eastern extension is significant in the velocity range of 6964 to 7489 km s-1 (see Figure 3), and appears to originate from the southeastern edge of the central emission region. On the other hand, the kpc northern extension is significant in the velocity range 7264 to 7564 km s-1, and appears to display a slight curve toward the east. The isolated component (WC) was detected (4.4 kpc) west of the main CO (3–2) peak, and this emission is significant in the velocity range 7114 to 7714 km s-1. No significant optical counterpart is associated with WC. In addition, none of the past interferometric CO observations have identified a similar feature (Bryant & Scoville, 1999; Tacconi et al., 1999; Nakanishi et al., 2005), but radio continuum observations have detected significant extension of synchrotron emission in the same region (Colbert et al., 1994).
The total integrated intensity from the full resolution map including WC is Jy km s-1, recovering 90% of the total flux measured using a single dish telescope ( Jy km s-1; Greve et al., 2006). Using the CO–H2 conversion factor appropriate for ULIRGs (i.e. = M⊙ (K km s-1)-1 pc2; Downes & Solomon, 1998), and assuming L = L, L K km s-1 pc2 translates to M M⊙. The peak of the CO (3–2) emission gives a peak H2 column density of N cm-2 using = 0.8 M⊙ (K km s-1)-1 pc2. The peak brightness temperature observed with the beam is 8.6 K. The integrated intensity of WC alone is Jy km s-1, which translates to M M⊙.
The higher resolution image afforded by adopting uniform weighting shown in Figure 4 () resolves out the extended structure, revealing the compact CO (3–2) emission that dominates the central 1.5 kpc. The integrated intensity derived from this map is Jy km s-1 and this is 65% of the total intensity derived from the full resolution image. The integrated intensity translates to M M⊙ assuming = M⊙ (K km s-1)-1 pc2. The CO (3–2) emission arises primarily in a compact structure centered between the two nuclei and slightly extended in the direction defined by the line connecting the two.
3.1.2 Kinematics
The total CO (3–2) FWZI linewidth of 1175 km s-1 is extremely large (see Figure 3). The large linewidth, particularly in the medium surrounding the two AGNs, suggests extremely turbulent gas. While it is possible that the bulk of the gas seen in Figure 5 () is dominated by turbulent gas stirred during the massive collision, the northeast-southwest velocity gradient centered around the northern nucleus (N1) may be suggestive of a disk rotation. The higher resolution image in Figure 5 () also shows this compact, rotation feature. Rapid changes in velocity of km s-1 are seen along the northern extended feature that appears to connect to this rotating disk, possibly suggesting collimated gas streaming toward the direction close to the line of sight. A steep velocity gradient like this is suggestive of gas inflow or outflow. The velocity gradient in the vicinity of the southern nucleus (S1) is less obvious, possibly due to the dominance of local non-circular motion, or a face-on orientation of a rotating disk. Although our current data does not have high enough angular resolution to distinguish the exact origin, if the southern nucleus has a face-on rotating disk, then the large shift in velocity of km s-1 that begins from the south of S1 and along the eastern extension may also suggest inflow or outflow activity. The velocity distribution (Figure 5 ()) shows that the systemic velocities of the two nuclei are offset by km s-1. The emission in WC is significant in the velocity range 7114 to 7564 km s-1 (see Figure 3), and does not show any significant evidence of a rotation in the moment map (Figure 6). An overall velocity shift from the northern part to the southern part of WC is evident.
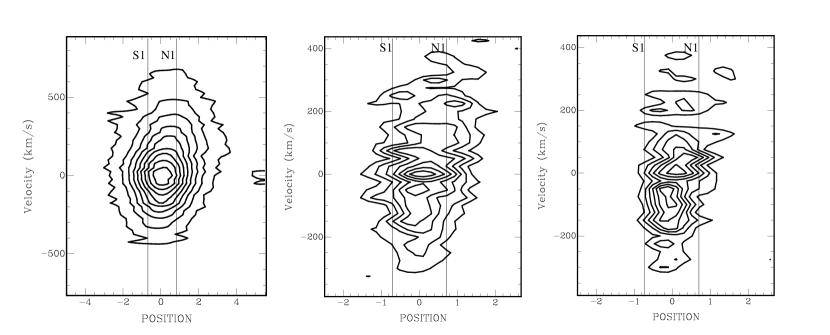
The position-velocity diagrams (PVD) sliced along the two AGNs (N1 and S1) and centered exactly halfway between the two AGNs are shown in Figure 7 for different resolution maps. Figure 7 () clearly shows that the linewidth near the two nuclei is extremely large, with emission slightly lopsided toward the redshifted velocities ( km s-1). The PVD obtained with the uniformly weighted map resolves out the extended emission in the velocity extrema, showing more details in the central km s-1 (Figure 7 ()). Similar to Figure 7 (), the peak of the emission is near the systemic velocity of 7339 km s-1. In contrast, the PVD obtained (Figure 7 ()) with the highest angular resolution map completely resolves the central emission into two distinct peaks separated by km s-1 and (100 pc). This double peaked morphology in the PVD suggests overlapping molecular cloud complexes in the medium between the two AGNs. The fact that these two peaks are nearly spatially coexistent, but separated in velocity further strengthens the argument that the gas kinematics in the central region is highly turbulent and non-circular.
3.2. HCO+(4–3) Emission
The distribution of the HCO+(4–3) emission (Figure 8 ()) is highly compact, and it is concentrated in the central region with a northeast-southwest elongation of ( kpc), with an additional slight extension toward the southeast. The peak of the HCO+(4–3) emission is and , and this is consistent with the peak of the CO (3–2) to within the astrometric accuracy of the SMA. The integrated intensity is () Jy km s-1, recovering 40% of the total flux measured using a single dish telescope ( Jy km s-1; Greve et al., 2006). The peak brightness temperature observed with the beam is 0.5 K. The highly compact and low S/N emission prevents us from constructing an interpretable velocity distribution map. The HCO+(1–0) emission obtained with a coarser synthesized beam also peaks at a similar location, although the emission is more extended in the northwest–southeast direction (Nakanishi et al., 2005).
3.3. Continuum Emission
Similar to the CO (3–2) and HCO+(4–3) emission, the emission also peaks between the two nuclei, near the radio continuum feature S2. The peak is also consistent with the 1.3 mm peak within the uncertainties of both measurements (Figure 1). The coordinates of the peak are and . The extension to the east is coincident with the similar extension seen in the CO (3–2) map, but the continuum is much shorter. The size of the emitting region is ( kpc). The total flux detected from the SMA observations is () mJy, and this is consistent with the true single dish continuum measurement of 96 mJy, which is calculated from the SCUBA flux (Klaas et al., 2001) and subtracting the contribution of the CO (3–2) emission using the formulae given in Seaquist et al. (2004). Assuming that all of the emission is associated with dust, the derived dust mass in the central 2 kpc is M⊙ using the formula described in Wilson et al. (2006 in prep). This yields a gas-to-dust mass ratio of in the central 2 kpc region (see §3.1 for the gas mass). Although uncertainties in both mass calculations are large, this is in agreement with the values typically observed in the Galaxy. The peak of the continuum suggests that the bulk of the dusty starburst activity occurs in this region. This is in contrast to previous optical/NIR imaging studies (e.g. Pasquali, Gallagher & de Grijs, 2004) where the visible starburst activity is concentrated near the two optical/X-ray nuclei, suggesting that the SFRs (2.8 – 412 M⊙ yr-1; Pasquali, Gallagher & de Grijs, 2004) derived using these measurements are likely underestimated.
4. Analysis of the Physical Properties
4.1. Large Velocity Gradient Modeling
Our new CO (3–2) and HCO+(4-3) data allow us to investigate the physical conditions of the gas by taking the line ratios with previously published CO (1–0) and HCO+(1–0) data (Nakanishi et al., 2005). Past multi-line studies toward galaxies have been limited to line ratios obtained from single dish data (e.g. Aalto et al., 1995; Petitpas & Wilson, 2000; Yao et al., 2003) or the ratios between the integrated intensities for nearby systems (e.g. Matsushita et al., 1999; Mao et al., 2000). Here we present line ratios obtained in each velocity channel, and investigate the gas properties by comparing the ratios with the theoretical predictions obtained from Large Velocity Gradient (LVG) models (Goldreich & Kwan, 1974; Takakuwa, Mikami & Saito, 1998). We assume here that both CO and HCO+ emission in the central kpc arise from the same molecular cloud. Although it is suggested that the filling factors of denser gas tracers may be smaller than the commonly observed CO (1–0) line (e.g. Aalto et al., 1995), here we assume for simplicity that the (beam and volume) filling factors between CO (3–2) and CO (1–0), as well as HCO+(4–3) and HCO+(1–0) are similar. We note that, although the HCO+(4–3) emission recovers only 40% of the total single dish flux (§3.2), the main focus of this analysis is to investigate the gas properties in the central where the missing flux should be negligible. By comparing the line ratios between CO (3–2) and CO (1–0), and also HCO+(4–3) and HCO+(1–0), these assumptions allow a direct comparison with LVG models that does not depend on the filling factor.
All data were convolved to the angular resolution of the CO (1–0) image (; lowest angular resolution among the four data cubes), regridded to the same velocity resolution of 56 km s-1, and two line ratio cubes, CO (3–2)/CO (1–0) () and HCO+(4–3)/HCO+(1–0) () were formed. The pixel-to-pixel correlation between the two ratio cubes were obtained and are shown as crosses in Figure 9. In order to show the regions with significant detection in all four transitions, only the data above two sigma in each channel are plotted. In brightness temperature, the two sigma cutoffs are 0.20 K, 0.80 K, 0.14 K, and 0.26 K, for CO (3–2), CO (1–0), HCO+(4–3), and HCO+(1–0) respectively. Since the HCO+(4–3) emission was only detected in the central -100 to 200 km s-1, only the densest gas in the central (1 kpc) is traced using this method.
In order to understand the correlations seen in Figure 9 better, a series of LVG calculations were performed. We adopt an LVG analysis that assumes a single cloud with spherical geometry, which requires three independent parameters as inputs: the H2 density (), kinetic temperature (TK), and the molecular abundance per unit velocity gradient (). The collision rates were obtained from Flower & Launay (1985) for CO and Flower (1999) for HCO+. The quantity , which is different for different species, is physically the most ambiguous parameter. In order to decrease the number of unknown parameters, we adopt a constraint to the relative abundance between CO and HCO+ (; Bergin & Langer, 1997) obtained from chemical evolution models. By varying the CO abundance per unit velocity gradient from to (km s-1 pc-1)-1, (km s-1 pc-1)-1 provides the most sensible explanation of the data. Changing to 10-6 (km s-1 pc-1)-1 will shift the temperature (vertical) contours leftward (see Figure 10), yielding most of the molecular gas with temperatures in the range 100 – 200 K. This is higher than the cold and warm dust temperatures predicted from a three component model by Armus et al. (2006) where they find cold (27 K), warm (81 K) and hot (680 K) dust components to coexist over the entire NGC 6240 system. Using (km s-1 pc-1)-1 will shift the temperature contours rightward, yielding most of the data points in T K. This is lower than the values predicted in the nearby starburst NGC 253 (Jackson et al., 1995), but consistent with the cold component dust in NGC 6240 suggested by Armus et al. (2006), assuming that the gas and dust are in thermal equilibrium.
Assuming that the gas temperature of 40 – 100 K is a reasonable representation of the molecular clouds in NGC 6240, then (km s-1 pc-1)-1 provides the most sensible abundance that explains the data in all channels with significant emission (Figure 9). A tight constraint to the H2 density of cm-3 is obtained. The derived opacities range from – 0.2 for the CO (1–0) line, – 2 for the CO (3–2) line, and – 1 for the HCO+(4–3) line. The model predicts that the relative population of the HCO+(1–0) line be inverted, thus giving negative opacities and excitation temperatures. The excitation temperatures (Tex) derived from these analyses show that both CO lines are nearly thermalized (i.e. Tex,CO(3-2) Tex,CO(1-0)).
Once these physical quantities are derived, it is now possible to constrain the beam filling factor of the CO emitting molecular gas. The observed line intensities are diluted by the (1 kpc) beam, and thus the true flux is obtained by scaling the observed flux by the reciprocal of the filling factor. Figure 11 and 12 show the correlation between T and T in each 21 km s-1 channel where the emission of each line is significant (i.e. the central -133 to 187 km s-1). The filling factors of the CO lines, which are assumed to be the same between CO (3–2) and CO (1–0) as well as in all velocity channels, are varied from 1 (no scaling; Figure 11) to 0.2 (multiply the observed brightness temperatures by 5; Figure 12). The lower limit to the filling factor of 0.2 is obtained by adjusting the filling factor until the highest observed points reach cm-3, a constraint given by the RCO – R plot in Figure 9. A CO filling factor of unity gives the bulk of the gas in the temperature range of 40 – 200 K and density of cm-3. In this case, while the range of temperature is consistent with our earlier analysis (see above), the H2 density is an order of magnitude lower. A CO filling factor of 0.2 also yields a temperature range of 20 – 100 K, and the range of H2 density is also comparable to our earlier analysis. These results suggest that the true CO filling factor is between 0.2 to 1, but probably closer to 0.2. A low value of the filling factor would be inconsistent with the previous studies by Downes & Solomon (1998) where they suggest that the diffuse inter-clump medium may dominate the CO emission in ULIRGs, yielding a filling factor of unity.
An estimate of the CO beam filling factor allows us to derive the volume filling factor of the CO emitting gas (see Equation 3 of Sakamoto et al., 1994). Assuming that the CO (3–2) emission arises from GMCs of order 50 pc each, and that the CO (3–2) emission region along the line of sight extends 4 kpc, the range of possible volume filling factor is 0.004 – 0.05 for filling factors 0.2 – 1. Changing the size of the GMC to 25 pc (10 pc) gives 0.002 – 0.03 (0.001 – 0.01) for the volume filling factor. Using the average density estimate from our LVG analysis (i.e. cm-3), the derived molecular gas mass is then M⊙ in the central 0.5 kpc (r=0.25 kpc) region. Our mass estimate is consistent with M⊙ derived using X=0.8 M⊙ (K km s-1)-1 pc2 (see §3.1), and with M⊙ derived in the central 0.5 kpc using CO (2–1) line emission (Tacconi et al., 1999). Assuming that the average density in the larger spatial extent is also cm-3 gives M⊙ in the central 1 kpc (r=0.5 kpc), and M⊙ in the central 2 kpc (r=1 kpc) region. The mass estimate given in a larger region (i.e. 2 kpc) is probably an overestimate since the molecular gas density in the periphery of the nucleus is likely lower than the central 0.5 kpc. Since the density derived from the LVG analysis only accounts for the densest gas in the central region, a proper mass estimate must consider the density variation of the cloud in the entire 1175 km s-1 velocity width, which is not possible here because of the varying mass sensitivities among the four data cubes.
The LVG calculation also provides an estimate of the H2 column density from the relation (XCO/(dv/dr)) NCO/dv. By adopting (km s-1 pc-1)-1 and cm-3, we find NCO/dv = cm-2[km s-1]-1. Using the standard abundance observed in galactic sources (XCO/X; Blake et al., 1987) and dv = FWZI = 1175 km s-1, we obtain N cm-2. This is in excellent agreement with our previous column density estimate derived using the peak CO (3–2) flux.
The peak brightness temperatures obtained in the CO (3–2) and observations (see §3.1 and §3.3) allow a confirmation of the properties derived above. In general, the brightness temperature and the true excitation temperature are related by TB = Tex (), where TB, , Tex and are the observed brightness temperature, beam filling factor, excitation temperature, and opacity respectively. Assuming the observed molecular clouds and the CO excitation are in thermal equilibrium coupled with dust (i.e. T T T 49 K), and using the range of filling factors of – 1 (see above), we obtain – 1.2, which is consistent with the opacities derived above. This is further evidence that the observed molecular clouds are moderately optically thin, and that they are close to thermal equilibrium. A similar analysis is performed on the dust continuum, and we derive the dust opacity – 0.01 using the same filling factors as CO, suggesting that the cold dust traced in 880 is indeed optically thin.
In summary, the important result obtained from these quantitative analyses is that the peak of the molecular gas in the central 1 kpc of NGC 6240 is warm, dense, and moderately optically thin. The derived temperatures and densities of NGC 6240 are consistent with the high values found in the nearby starburst galaxies M82 and NGC 253 (Wild et al., 1992; Jackson et al., 1995; Seaquist & Frayer, 2000). The low opacities predicted from these analyses are somewhat consistent with earlier results that investigate the opacities in M82 (; Mao et al., 2000), but our new results predict much lower opacities than previously suggested in ULIRGs (; Downes & Solomon, 1998). The low opacities found in the central region of NGC 6240 are possibly due to large velocity gradients caused by extremely turbulent gas, allowing emission in the core of the molecular cloud to escape efficiently. In addition, our predicted peak densities ( cm-3) are much higher than the range of values found in ULIRGs using low transition CO emission ( cm-3; Downes & Solomon, 1998). The disagreement is likely due to the difference in the excitation conditions of the observed molecular gas tracers; i.e. Downes & Solomon (1998) used cold (T K) and low density ( cm-3) tracers whereas our new observations trace much warmer (T K) and denser ( cm-3 for CO (3–2)) molecular gas. This study, therefore, demonstrates the importance of using high density submm line tracers such as CO (3–2) and HCO+ emission to study the physical conditions in the nuclear ISM in ULIRGs.
4.2. The Gas to Dust Mass Ratio
The gas-to-dust mass ratio (i.e. M/Md) provides an important measure of the relative abundance between gas and metallicity. An average M/Md over the entire galaxy is often derived in single dish work, where it is found that M/M for Galactic sources (Hildebrand, 1983), M/M – 300 for local LIRGs/ULIRGs (Contini & Contini, 2003; Yao et al., 2003; Seaquist et al., 2004), and M/Md = 15 – 231 in high- sources (Solomon & vanden Bout, 2005). Wilson et al. (2006 in prep) finds M/M from a sample of 13 LIRGs/ULIRGs observed in high resolution with the SMA. It is found that the global gas-to-dust mass ratio in NGC 6240 is M/M (see §3.3).
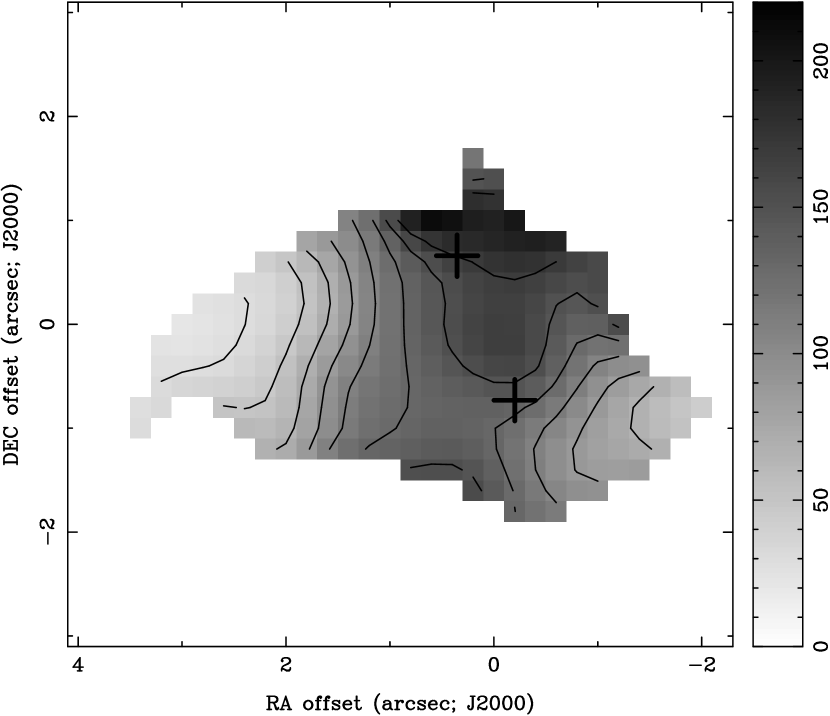
Our new high angular resolution CO (3–2) and maps allow us to study the spatial variation of M/Md. We have converted the CO (3–2) and maps to M and Md maps. The gas-to-dust mass ratio map is shown in Figure 13. The peak of M/Md occurs between the two AGNs, and near S2, suggesting an over abundance of dense gas relative to dust in these regions, assuming that most of the emission is tracing dust. The high ratios seen north of the northern AGN are due to low dust masses at the edge of the 3 cutoff. The peak ratio is . We note that the ratio map obtained here is only available in the central kpc where the dust emission is significant (). The CO (3–2) emission is much more extended than the dust emission and hence the average M/Md in Figure 13 is lower than the global M/Md (). Higher ratios are seen in the north-south direction (i.e. M/M 100 – 160) along the two AGNs than the east-west direction (i.e. M/M 30 – 100). The steep decline in the wings of dust emission may suggest substantial free-free emission associated with the starburst winds, or a local gradient in the metallicity.
4.3. The FIR to CO (3–2) Luminosity Ratio
It is empirically known that the ratio between FIR and CO (1–0) luminosities is higher for ULIRGs than for normal spiral galaxies (Solomon et al., 1997). Solomon et al. (1997) attribute this result to the presence of compact, optically thick dust emission, which in turn yields higher dust temperatures than in the optically thin limit. However, these measurements are performed using the CO (1–0) transition, and it is found that this value is different when the ratio between FIR and CO (3–2) is taken (i.e. compare log LFIR/log L with log LFIR/log L; Yao et al., 2003). The FIR–to–CO (3–2) luminosity ratio appears to be even lower in high- sources where the FIR luminosity is typically an order of magnitude larger (i.e. L L⊙). From the high- sources with a robust CO (3–2) detection, the ratio is found to be log LFIR/log L (Solomon & vanden Bout, 2005; Iono et al., 2006). Using the CO (3–2) integrated intensity from our full resolution map, and the IRAS measurement for the FIR luminosity, the ratio for NGC 6240 is found to be log LFIR/log LCO(3-2) = 1.16.
NGC 6240 thus contains much more molecular gas relative to the intensity of starburst activity than similarly FIR bright systems observed in the local universe. The ratio is even lower than the values derived in high- sources. The overwhelming amount of molecular gas available in the central region of NGC 6240 suggests that there is enough gas to support star formation for at least another years, assuming that all of the gas will eventually be converted to stars with a constant star formation rate of 60 M⊙ yr-1. The wealth of molecular gas may also suggest that the star formation in NGC 6240 will increase to a level comparable to that seen in Arp 220.
5. Discussion
5.1. The Nature of the Western Molecular Complex (WC)
Recent galaxy-galaxy collision simulations (e.g. Hopkins et al., 2005) that trace the evolution of the central AGN have shown that significant outflow activity may be observable in high CO transitions up to (Narayanan et al., 2006). While a massive ( M⊙) off-nuclear molecular complex such as WC is often explained by starburst superwinds (Heckman, Armus, & Miley, 1990), we investigate here the possibility that the origin of WC is gas entrained in outflow from the AGN of one of the progenitor galaxies. From an estimate of the cloud diameter of kpc from the CO (3–2) map and the velocity dispersion of km s-1 estimated from the FWHM of the CO (3–2) line in WC, we find a virial mass of M M⊙. The error in this virial mass estimate could be as large as a factor of (2–3) due to large uncertainties in the cloud size and velocity dispersion. By assuming the Galactic dynamical mass (Mdyn) to M ratio of 136 (Nakanishi & Sofue, 2006), we estimate a total mass of M M⊙ for WC. Although the uncertainties in these measurements are large, the derived virial mass is an order of magnitude larger than the total mass of WC. This suggests that WC is not bound by its own gravitational force and will likely disperse within years. The systemic velocity of WC is km s-1, which yields a relative velocity km s-1 assuming that WC is ejected from the northern nucleus. Using a projected distance between the northern nucleus and WC of 4.4 kpc, the timescale for WC to traverse to the current location is years.
Although all of these timescales contain significant uncertainties, the short dispersion time ( years) suggests that it is unlikely that the cloud would have survived the estimated transversal time of years to reach the current location. Simulations conducted by Narayanan et al. (2006) predict that the total gas mass of an ejected cloud could be as large as M⊙ with a cloud dispersion time of years (Narayanan et al., 2006). While the CO (3–2) derived gas mass is consistent with the ejected gas mass predicted from simulations, the derived dispersion timescale is a factor of 40 shorter. These results may suggest that the AGN outflow scenario is less appealing to explain WC, and other scenarios such as molecular outflow from starburst superwinds may be more appealing to explain the large and extended molecular gas. The starburst outflow scenario to explain the western extension of radio continuum emission in NGC 6240 was suggested by Colbert et al. (1994).
Possible scenarios to explain WC are not limited to starburst superwinds or to AGN outflows and both of the following are also possibilities; (1) molecular gas ejected from the violent arm-arm collision, (2) molecular gas complex formed locally as a result of gravitational instability. Ejection of molecular gas is possible as arm-arm collision could occur in each pericentric passage. However, ejecting a molecular gas mass of order M⊙ and diameter 1 – 2 kpc from the potential of a tidal arm may require a significant amount of energy. While it is possible that gravitational collapse could form a CO cloud from an ambient H I cloud, it is already demonstrated that the virial mass is an order of magnitude larger than the estimated total mass of WC. Hence these two scenarios are less appealing to explain the origin of WC than the starburst superwind or the AGN outflow scenarios. Our current data, however, is not sensitive enough to address the exact origin of WC, and future observations with higher angular resolution and sensitivity should provide us further understandings to the possibilities of these scenarios.
5.2. The Central 1 kpc of NGC 6240
Our new analysis presented in §4.1 shows that the molecular gas in the central 1 kpc of NGC 6240 is warm, dense and moderately optically thin. These results suggest that the excitation conditions of molecular gas surrounding the two AGNs is similar to the nuclear regions of nearby starbursting galaxies. The low opacity is likely caused by highly turbulent gas, which is also supported by the dominance of non-circular kinematics entangled with possible disk-like rotation around the northern nucleus (see §3.1.2). The southern nucleus shows little evidence of disk-like rotation possibly due to the dominance of non-circular motion, or due to a face-on orientation of a rotating disk. Although the projected nuclear separation is different, the double nucleus configuration is similar to that seen in Arp 220 where a merger of two counter-rotating disks is suggested from high resolution CO (2–1) observations (Sakamoto et al., 1999). Higher angular resolution observations should provide further insight to these possibilities.
In addition to the large amount of dense molecular gas, there is significant multi-wavelength evidence that the central 1 kpc also harbors substantial amounts of dust. While we caution here that emission traced in and 1.3 mm (Tacconi et al., 1999) are possibly more dominated by non-thermal emission, the ubiquitous presence of the optically thin dust emission in the medium between the two AGNs is a significant evidence of cold dust. Further, from comparison between star formation activity traced in optical and the AGN activity traced in X-ray, Gerssen et al. (2004) have shown that the two nuclear star forming regions in both progenitor disks are not coincident with the AGN positions but are offset by , suggesting that foreground dust extinction in the central region is significant. The dusty central 1 kpc also shows significant evidence of a coexistence of hot and shocked gas as seen in detections of maser emission (Hagiwara, Diamond & Miyoshi, 2003) and H2 emission (Ohyama et al., 2000). Both of these are detected near S1 and S2, providing evidence of shocked gas associated with either the AGN jet or the nuclear starburst activity. Summarizing the multi-wavelength properties, the central 1 kpc of NGC 6240 harbors two AGNs surrounded by a wealth of warm and dense molecular gas, as well as hot (T = K) gas and a large amount of dust, and the region is undergoing a high rate of star formation activity.
6. Summary
We present high resolution CO (3–2), HCO+(4–3) and imaging of the luminous infrared galaxy NGC 6240 obtained at the SMA. We provide our main findings below;
-
1.
The distribution of CO (3–2) is extended on a 4 kpc scale, but the HCO+(4–3) emission is more compact and concentrated in the central 1 kpc between the two nuclear AGNs. The CO (3–2), HCO+(4–3), and emission all peak between the two AGNs where the H2 emission was detected previously.
-
2.
The kinematical information provided by the CO (3–2) emission shows a rotating disk-like feature centered around the northern AGN, but the kinematics of gas between the two nuclei is extremely turbulent.
-
3.
Our LVG analysis shows that the gas near the peak of the continuum emission is warm (T = 20 – 100 K), dense ( cm-3) and moderately optically thin ( – 2) in the central 1 kpc of NGC 6240.
-
4.
We propose that the isolated molecular emission with M⊙ seen west of the main CO component may be associated with outflows from starburst superwinds, but the gas outflow scenario from one of the central AGN is not completely ruled out.
References
- Aalto et al. (1995) Aalto, S., Booth, S. R., Black, J. H., & Johansson, L. E. B. 1995, å, 300, 369
- Armus, Heckman & Miley (1987) Armus, L., Heckman, T., & Miley, G. 1987, AJ, 94, 831
- Armus et al. (2006) Armus et al., 2006, ApJ, 640, 204
- Barnes & Hernquist (1996) Barnes, J. E., & Hernquist, L. 1996, ApJ, 370, L65
- Bergin & Langer (1997) Bergin, E. A., & Langer, W. D. 1997, 486, 316
- Beswick et al. (2001) Beswick, R. J., Pedlar, A., Mundell, C. G., & Gallimore, J. F. 2001, MNRAS, 325, 151
- Blake et al. (1987) Blake, G. A., Sutton, E. C., Masson, C. R., & Phillips, T. G. 1987, ApJ, 315, 621
- Bryant & Scoville (1999) Bryant, P. M., & Scoville, N. Z. 1999, AJ, 117, 2632
- Bogdanovic et al. (2003) Bogdanovic, T., Ge, J., Max, C. E., & Raschke, L. M. 2003, AJ, 126, 2299
- Boller et al. (2003) Boller, Th., Keil, R., Costantini, E., Fujimoto, R., Anabuki, N., Lehmann, I., & Gallo, L. 2003, å, 411, 63
- Bushouse et al. (2002) Bushouse, H. A., Borne, K. D., Colina, L., Lucas, R. A., Rowan-Robinson, M., Baker, A. C., Clements, D. L., Lawrence, A., & Oliver, S. 2002, ApJS, 138, 1
- Colbert et al. (1994) Colbert, E. J. M., Wilson, A. S. & Bland-Hawthorn, J. 1994, ApJ, 436, 89
- Contini & Contini (2003) Contini, M., & Contini, T. 2003, MNRAS, 342, 299
- Di Matteo, Springel & Hernquist (2005) Di Matteo, T., Springel, V., & Hernquist, L. 2005, Nature, 433, 604
- Downes & Solomon (1998) Downes, D., & Solomon, P. M. 1998, ApJ, 507, 615
- Egami et al. (2006) Egami, E., Neugebauer, G., Soifer, B. T., Mathews, K., Becklin, E. E. & Ressler, M. E. 2006, AJ, 131, 1253
- Farrah et al. (2001) Farrah, D., Rowan-Robinson, M., Oliver, S., Serjeant, S., Borne, K., Lawrence, A., Lucas, R. A., Bushouse, & H., Colina, L. 2001, MNRAS, 326, 1333
- Flower & Launay (1985) Flower, D. R., & Launay, J. M. 1985, MNRAS, 214, 271
- Flower (1999) Flower, D. R. 1999, MNRAS, 305, 651
- Gallimore & Beswick (2004) Gallimore, J. F., & Beswick, R. 2004, AJ, 127, 239
- Gao & Solomon (2004) Gao, Y., & Solomon, P. M. 2004, ApJ, 152, 63
- Gerssen et al. (2004) Gerssen, J., van der Marel, P. V., Axon, D., Mihos, C. J., Hernquist, L., & Barnes, J. 2003, AJ, 127, 75
- Genzel et al. (1998) Genzel, R., et al., 1998, ApJ, 498, 579
- Goldreich & Kwan (1974) Goldreich, P. & Kwan, J. 1974, 189, 441
- Greve et al. (2005) Greve, T. R., et al. 2005, MNRAS, 359, 1165
- Greve et al. (2006) Greve, T. R., Papadopoulos, P. P., Gao, Y., & Radford, S. J. E. 2006, ApJ submitted (astro-ph/0610378)
- Ikebe et al. (2000) Ikebe, Y., Leighly, K., Tanaka, Y., Nakagawa, T., Terashima, Y., & Komossa, S. 2000 MNRAS, 316, 433
- Hagiwara, Diamond & Miyoshi (2003) Hagiwara, Y., Diamond, P. J., & Miyoshi, M. 2003, å, 400, 457
- Heckman, Armus, & Miley (1990) Heckman, T. M., Armus, L., & Miley, G. K. 1990, ApJS, 74, 833
- Hildebrand (1983) Hildebrand, R. H. 1983, QJRAS, 24, 267
- Ho, Moran & Lo (2004) Ho, P. T. P., Moran, J. M., & Lo, K. Y. 2004, ApJ, 616, L1
- Hopkins et al. (2005) Hopkins, P. F., Hernquist, L., Cox, T. J., Di Matteo, T., Martini, P., Robertson, B., & Springel, V. 2005, ApJ, 630, 705
- Hopkins et al. (2006) Hopkins, P. F., Hernquist, L., Cox, T. J., Di Matteo, T., Robertson, B., & Springel, V. 2006, ApJS, 163, 1
- Imanishi, Dudley & Maloney (2006) Imanishi, M., Dudley, C. C., & Maloney, P. R. 2006, ApJ, 637, 114
- Iono, Yun & Mihos (2004) Iono, D., Yun, M. S., & Mihos, C. J. 2004, ApJ, 616, 199
- Iono et al. (2004) Iono, D., Ho, P. T. P., Yun, M. S., Matsushita, S., Peck, A. B., & Sakamoto, K. 2004, ApJ, 616, L63
- Iono et al. (2006) Iono, D., Tamura, Y., Nakanishi, K., Kawabe, R., Kohno, K., Okuda, T., Yamada, K., Hatsukade, B., & Sameshima, M. 2006, PASJ, 58, 6 in press
- Jackson et al. (1995) Jackson, J. M., Paglione, T. A. D., CArlstrom, J. E. & Ngueyn, Q. R. 1995, ApJ, 438, 695
- Kennicutt (1998) Kennicutt, R. C. 1998, ApJ, 498, 541
- Klaas et al. (2001) Klaas, U., Haas, M., Muller, S. A. H., Chini, R., Schulz, B., Coulson, I., Hippelein, H., Wilke, K., Albrecht, M., & Lemke, D. 2001, å, 379, 823
- Komossa et al. (2003) Komossa, S., Burwitz, V., Hasinger, G., Predehl, P., Kaastra, J. S., & Ikebe, Y. 2003, ApJ, 582, L15
- Laurent-Muehleisen et al. (1997) Laurent-Muehleisen, S. A., Kollgaard, R. I., Ryan, P. J., Feigelson, E. D., Brinkmann, W., & Siebert, J. 1997, A&A, 122, 235
- Lonsdale, Farrah & Smith (2006) Lonsdale, C. J., Farrah, D. & Smith, H. E., 2006, ”Astrophysics Update 2 - topical and timely reviews on astronomy and astrophysics”. Ed. John W. Mason. Springer/Praxis books.
- Lutz et al. (2003) Lutz, D., Sturm, E., Genzel, R., Spoon, H. W. W., Moorwood, A. F. M., Netzer, H., & Sternberg, A. 2003, å, 409, 867
- Matsushita et al. (1999) Matsushita, S., Kohno, K., Vila-Vilaro, B., Tosaki, T., & Kawabe, R. 1998, ApJ, 495, 267
- Mao et al. (2000) Mao, R. Q., Henkel, C., Schulz, A., Zielinsky, M., Mauersberger, R., Storzer, H., Wilson, T. L., & Gensheimer, P. 2000, å, 358, 433
- Max et al. (2005) Max, C. E., Canalizo, G., Macintosh, B. A., Raschke, L., Whysong, D., Antonucci, R., & Schneider, G. 2005, ApJ, 621, 738
- Mihos & Hernquist (1996) Mihos, C. J., & Hernquist, L. 1996, ApJ, 464, 641
- Nakanishi et al. (2005) Nakanishi, K., Okumura, S. K., Kohno, K., Kawabe, R., & Nakagawa, T. 2005, PASJ, 57, 575
- Nakanishi & Sofue (2006) Nakanishi, H., & Sofue, Y. 2006, PASJ, 58, 847
- Narayanan et al. (2006) Narayanan, D., Cox, T. J., Robertsonm, B., Dave, R., Di Matteo, T., Hernquist, L., Hopkins, P., Kulesa, C., Walker, C. ApJin press (astro-ph/060474)
- Netzer et al. (2005) Netzer, H., Lemze, D., Kaspi, S., George, I. M., Turner, T. J., Lutz, D., Boller, T., & Chelouche, D. 2005, ApJ, 629, 739
- Ohyama, Yoshida, & Takata (2003) Ohyama, Y., Yoshida, M., & Takata, T. 2003, AJ, 126, 229
- Ohyama et al. (2000) Ohyama, Y. et al., 2000, PASJ, 52, 563
- Pasquali, Gallagher & de Grijs (2004) Pasquali, A., Gallagher, J. S., & de Grijs, R. 2004, å, 415, 103
- Petitpas & Wilson (2000) Petitpas, G. R., & Wilson, C. D. 2000, ApJ, 538, 117
- Sakamoto et al. (1994) Sakamoto, S., Hayashi, M., Hasegawa, T., Handa, T., & Oka, T. 1994, ApJ, 425, 641
- Sakamoto et al. (1999) Sakamoto, K., Scoville, N. Z., Yun, M. S., Crosas, M., Genzel, R., & Tacconi, L. J. 1999, ApJ, 514, 68
- Sanders & Mirabel (1996) Sanders, D. B., & Mirabel, I. F. 1996, ARA&A, 34, 749
- Scoville & Sanders (1987) Scoville, N. Z., & Sanders, D. B. 1987, in Interstellar Processes (Dordrecht: Reidel), 21
- Scoville et al. (2000) Scoville, N. Z., et al. 2000, AJ, 119, 991
- Seaquist & Frayer (2000) Seaquist, E. R. & Frayer, D. T. 2000, ApJ, 540, 765
- Seaquist et al. (2004) Seaquist, E. R., Yao, L., Dunne, L. Cameron, H. 2004, MNRAS, 349, 1428
- Solomon et al. (1997) Solomon, P. M., Downes, D., Radford, S. J. E., & Barrett, J. W. 1997, ApJ, 478, 144
- Solomon & vanden Bout (2005) Solomon, P. M., & vanden Bout, P. A. 2005, ARA&A, 478, 144
- Springel, Di Matteo & Hernquist (2005) Springel, V., Di Matteo, T., & Hernquist, L. 2005, MNRAS, 361, 776
- Surace et al. (1998) Surace, J. A., Sanders, D. B., Vacca, W. D., Veilleux, S., & Mazzarella, J. M. 1998, ApJ, 492, 116
- Tacconi et al. (1999) Tacconi, L. J., Genzel, R., Tecza, M., Gallimore, J. F., Downes, D., & Scoville, N. Z. 1999, ApJ, 524, 732
- Tacconi et al. (2006) Tacconi, L. J., et al. 2006, ApJ, 640, 228
- Takakuwa, Mikami & Saito (1998) Takakuwa, S., Mikami, H., & Saito, M. 1998, ApJ, 501, 723
- Wang et al. (2004) Wang, J., Zhang, Q., Zhong, W., Ho, P. T. P., Fazio, G., & Wu, Y. 2004, ApJ, 616, L67
- Wild et al. (1992) Wild, W., et al., 1992, A&A, 265, 447
- Yao et al. (2003) Yao, L., Seaquist, E. R., Kuno, N., & Dunne, L. 2003, ApJ, 588, 771
- Young et al. (1986) Young, J. S., Kenney, J. D., Tacconi, L., Claussen, M. J., Huang, Y. -L., Tacconi-Garman, L., Shuding, X., & Schloerb, F. P. 1986, ApJ, 311, L17
- Yun & Carilli (2002) Yun, M. S., & Carilli, C. 2002, ApJ, 568, 88
| Observation | Property | Value |
|---|---|---|
| CO (3–2) | ||
| (km s-1) | ||
| FWZI (km s-1) | ||
| Sνd (Jy km s-1) | ||
| peak R.A. | ||
| peak Decl. | ||
| peak TB (K) | 8.6 | |
| HCO+(4–3) | ||
| (km s-1) | ||
| FWZI11The FWZI and Sνd of the HCO+(4–3) emission may be underestimated since the emission occurs near the edge of the bandpass (see text). (km s-1) | ||
| Sνd11The FWZI and Sνd of the HCO+(4–3) emission may be underestimated since the emission occurs near the edge of the bandpass (see text). (Jy km s-1) | ||
| peak R.A. | ||
| peak Decl. | ||
| peak TB (K) | 0.5 | |
| continuum | ||
| S880 (mJy) | ||
| peak R.A. | ||
| peak Decl. | ||
| peak TB (K) | 0.1 |