Resolved Galaxies in the Hubble Ultra Deep Field: Star Formation in Disks at High Redshift
Abstract
The photometric redshift distributions, spectral types, Sérsic indices, and sizes of all resolved galaxies in the Hubble Space Telescope Ultra Deep Field (UDF) are studied in order to understand the environment and nature of star formation in the early Universe. Clumpy disk galaxies that are bright at short wavelengths (restframe Å) dominate the UDF out to . Their uniformity in and co-moving volume density suggest they go even further, spanning a total time more than an order of magnitude larger than their instantaneous star formation times. They precede as well as accompany the formation epoch of distant red galaxies and extreme red objects. Those preceding could be the pre-merger objects that combined to make red spheroidal types at . Clumpy disks that do not undergo mergers are likely to evolve into spirals. The morphology of clumpy disks, the size and separation of the clumps, and the prevalence of this type of structure in the early Universe suggests that most star formation occurs by self-gravitational collapse of disk gas.
1 Introduction
Star formation in galaxies today occurs in disks where molecular clouds contain the densest gas and random motions are much slower than the rotation speed. In contrast, monolithic collapse models (Eggen, Lynden-Bell & Sandage 1962; Larson 1975) for the formation of galaxies assume that stars form in three-dimensional geometries which flatten over time as the gas cools. The formation of stars in molecular clouds that occupy the full height of a spheroid has not been directly observed, though, even at high redshifts. Spheroidal systems do form stars (e.g. Ravindranath et al. 2006; Teplitz et al. 2006), but the youngest stars and the clouds that form them could be in disks and scattered pieces of disks that were formerly inside flatter galaxies that merged. Ellipticals with blue clumps (Menanteau, Abraham, & Ellis 2001; Menanteau et al. 2005; Pasquali et al. 2006) could have either formed these clumps in gas disks or accreted them as smaller galaxies with gas disks. For example, UDF 900 is an elliptical galaxy that reveals nuclear spiral arms in what appears to be a disk in unsharp masked images (Elmegreen, Elmegreen, & Ferguson 2005). Blue ellipticals out to (Franceschini et al. 2006) could be aging merger remnants and not three-dimensional star formation. When star formation sites are observed either locally or at high redshift, they usually lie in the disks of galaxies (Driver et al. 2006; Genzel et al. 2003). This is also the case for both isolated and merging galaxies that are close enough to have their disks resolved (e.g., the Antennae). Old globular clusters could have formed in disks too (Kravtsov & Gnedin 2005), like their modern-day counterparts. The spheroids themselves apparently formed during mergers by the scattering of disk stars (Toomre 1977; Barnes & Hernquist 1992; Schweizer 1996); they also grew during mergers of other spheroids (e.g., Khochfar & Burkert 2003; Bundy et al. 2004; van Dokkum 2005; Bell et al. 2006; Robertson et al. 2006; Trujillo et al. 2006b).
Here we are interested in the structure and redshift distribution of star-forming galaxies that are observed in the Hubble Ultra Deep Field (UDF). We consider all the resolvable galaxies in the UDF and compare their photometric redshift distribution with the sequence of galaxy assembly emerging from recent observations. In this sequence, giant elliptical galaxies assembled at from smaller progenitors whose stars formed at (van Dokkum et al. 2003; Daddi et al. 2004a, 2005; Fontana et al. 2004; Stanford et al. 2004; Bundy et al. 2005; Labbé et al. 2005; Saracco et al. 2005; Longhetti, et al. 2005; Cimatti et al 2006; De Lucia & Blaizot 2006; Franceschini et al. 2006; Fritz von Alvensleben & Bicker 2006; Homeier et al. 2006; Huang et al. 2005; Rigopoulou et al. 2006; Roche et al. 2006; Rudnick et al. 2006). Slightly earlier assembly and star formation occurred in denser clusters (e.g., di Serego Alighieri, Lanzoni, & J rgensen 2006; Clemens et al. 2006; Sheth et al. 2006) and for more massive galaxies (e.g., van der Wel et al. 2004; Treu et al. 2005; Feulner et al. 2005; Bundy et al. 2006, Kajisawa & Yamada 2006; Franceschini et al. 2006), but even most low-mass ellipticals appear to have assembled before (Andreon 2006).
Also in the observed sequence, galaxies with regular disks appear mostly at (Dawson et al. 2003; Cassata et al. 2005; Conselice et al. 2005a, 2006; Genzel et al. 2006; Ravindranath et al. 2006; Trujillo et al. 2006a). Some regular disk galaxies are old even at (Iye et al. 2003; Stockton, Canalizo, & Maihara 2004; Fu, Stockton, & Liu 2005; Stockton, McGrath, & Canalizo 2006; Toft et al. 2005), indicating their stars formed at (Roche et al. 2006). Sub-mm galaxies at could also be disks with active star formation (Almaini et al. 2006; Tacconi et al. 2006; Swinbank et al. 2006). Peculiar galaxies dominate galaxy morphologies at (Abraham et al. 1996a,b; Conselice, Blackburne, & Papovich 2005a; Conselice et al. 2005a). Peculiar and compact types also dominate star formation at (Menanteau et al. 2006; de Mello 2006). When the peculiar types are resolved, they are usually clumpy and distorted disks (Elmegreen, et al. 2005a; hereafter EERS).
These redshift distributions for ellipticals, spirals, and peculiars are consistent with the redshift distributions of major and minor mergers. According to Conselice et al. (2003), Treu et al. (2005) and others, the epoch of major mergers ended around and produced most of the giant ellipticals. After this time, mergers continued to form smaller ellipticals (e.g., Bundy et al. 2005) and the relatively isolated spirals survived, growing primarily by dark matter plus gas accretion and minor mergers (e.g., Conselice et al. 2005b; Brook et al. 2006). Recent numerical studies indicate a general agreement between the epochs of elliptical galaxy formation, nuclear black hole activity, and major mergers (Hopkins et al. 2006).
A key component in this standard model is the physical nature of star formation in young galaxies. One way to understand this star formation is by studying its morphology in the context of the overall galaxy. Galaxies at high redshift can have morphologies and spectral properties that are different from those of local galaxies, as shown by recent studies of the Hubble Deep Fields (HDF-N, Williams et al. 1996; HDF-S, Volonteri et al. 2000), the Ultra Deep Field (UDF; Beckwith et al. 2006), GOODS (Giavalisco et al. 2004), and other surveys. Some of this difference results from bandshifting of the UV emission from hotspots into the optical range (Toft et al. 2005; Cassata et al. 2005), some from a greater clumpy structure at high redshift, and some from intrinsically different galaxy shapes. The high resolution of the Advanced Camera for Surveys (ACS) has enabled morphological studies of galaxies in the UDF out to a redshift of z5, beyond the primary assembly epoch of most modern spirals and giant ellipticals. The physical resolution of the UDF corresponds to pc per pixel () for , so we expect to resolve the disks and see directly the star formation properties of the most common progenitor galaxies.
There are many methods for studying the overall morphology of galaxies, but comparatively few for the morphology of star forming regions within them. For overall morphology, visual inspection provided the initial basis for the main galaxy classifications (Sandage 2005; de Vaucouleurs et al. 1991; van den Bergh 1960) and it is still the most useful method if there are highly resolved structures such as rings, bars, and spiral arms. High redshift galaxies typically have less resolved structure and they also include peculiar clumpy types that are not found locally (Abraham et al. 1996a,b; Cowie, Hu, & Songaila 1995; van den Bergh 2002; van den Bergh et al. 1996). Thus the Hubble class and other standard systems have limited value at high redshift.
New systems have been developed for galaxy classification at high redshift that rely on automated measures of certain simple properties. These properties include concentration, asymmetry, and clumpiness in the CAS system (Conselice 2003, Conselice et al. 2004 and references therein; Pasquali et al. 2006), the Sérsic index for the surface brightness profile (Sérsic 1968; see, e.g., Trujillo et al. 2004; Ravindranath et al. 2006), the restframe spectral energy distribution (Benítez 2000; Coe et al. 2006), and the Gini coefficient, which measures the relative distribution of brightness from pixel to pixel (Abraham et al. 2003; Lotz et al. 2006). These systems are interrelated. Conselice (2003), Menanteau et al. (2006) and others show there is a correlation between the asymmetry and concentration value of a galaxy and the Hubble classification as a spiral, elliptical/S0, or Irr/peculiar. However Franceschini et al. [2006] found that 30% of galaxies classified as spheroids by CAS look more like late Hubble types visually, although only 5% of the reverse was true. Sérsic indices, , also correlate with Hubble type, but has a wide range of values among high redshift elliptical and spiral galaxies (e.g., Hatziminaoglou et al. 2005) unlike local galaxies where generally corresponds to an elliptical and is typically seen for a spiral.
The star formation morphologies of galaxies are not included in these classification systems. One has to rely instead on visual inspection of images, aided by color maps and contrast enhancement techniques. These images suggest that star-forming regions in most high redshift galaxies are larger and more massive than in galaxies today (see review in Elmegreen 2007). Star-forming galaxies are also disk-like, ranging from edge-on clumpy disks that can probably be identified with chain galaxies (Reshetnikov, Dettmar, & Combes 2003; Elmegreen, Elmegreen & Hirst 2004a) to face-on clumpy disks that have been referenced by various names in the literature, including spirals, protospirals (van den Bergh 2002), luminous diffuse objects (Conselice et al. 2004), and clump clusters (Elmegreen, Elmegreen, & Sheets 2004). Clump clusters contain no bulges or exponential light profiles, unlike spirals at the same redshifts, and % of their light is in clumps, compared to % for spirals (Elmegreen et al. 2005b).
The clumps in high redshift galaxies are usually kpc in diameter in the restframe UV images, and they are bright with star formation ages of My and masses of M⊙ (Elmegreen & Elmegreen 2005; hereafter EE05). A typical clump cluster galaxy may contain only of these giant clumps at any one time, making its surface brightness extremely irregular, yet the mean radial profile of the clumps is an exponential like the smooth profiles in high redshift spirals (Elmegreen et al. 2005b). Clump sizes at high redshift are also about the same as edge-on galaxy thicknesses, kpc for a sech2 scale height, and the clump centers are highly confined to the midplanes (Elmegreen & Elmegreen 2006; hereafter EE06). These morphologies make the clumps look like they continuously form in a thick disk gas layer, probably by gravitational instabilities considering their length and mass scales (EE05; EE06). As they dissolve they build up the stellar exponential disks. For example, some giant clumps in clump cluster galaxies have head-tail structures that suggest tidal forces are hastening their dissolution (EE05).
In this paper, we are interested in the redshift distribution of clumpy star-forming galaxies in the UDF. Similar studies for spirals and ellipticals in various HST deep fields have been available for several years (e.g., Roche et al. 1998; van den Bergh 2002; Kajisawa & Yamada 2001; Conselice, Blackburne, & Papovich 2005a; Stanford et al. 2004; Cassata et al. 2005; Franceschini et al. 2006). Consistent with these other studies, we find a wide range of Sérsic indices and star formation rates for the spirals and ellipticals in the UDF, indicating a broad range of structures and formation redshifts, and we find that the more irregular morphologies dominate at higher redshift.
What is new here is the observation that extremely young disks extend back to redshifts that are as early as the first main star formation phases in high mass elliptical galaxies. This implies that the elliptical and proto-elliptical galaxies observed at intermediate redshifts (e.g., the distant red galaxies; Franx et al. 2003; Förster Schreiber et al. 2004) could have formed by mergers of clumpy disk systems like those observed here out to . A test suggests we have not even reached the surface brightness limit of these clumpy disks, but only the bandshifting limit from the redshift of restframe UV light out of the ACS optical bands. These observations reinforce the idea that most star formation occurs in disks and that clumpy disks may host even the earliest Population II stars.
In what follows, the data are presented in Section 2, the results and analysis are in Section 3, and a discussion of the implications is in Section 4. We assume a CDM model with , , and km s-1 Mpc-1 (Spergel et al. 2003).
2 Data and Analysis
The Hubble UDF images were used for this study (Beckwith et al. 2006). The images consist of exposures in 4 filters: F435W (hereafter ; 134880 s exposure), F606W (; 135320 s), F775W (; 347110 s), and F850LP (; 346620 s). The images have a size of 10500 x 10500 pixels with a scale of 0.03 arcsec per px (315 arcsec x 315 arcsec); they were obtained from the STScI public archive.
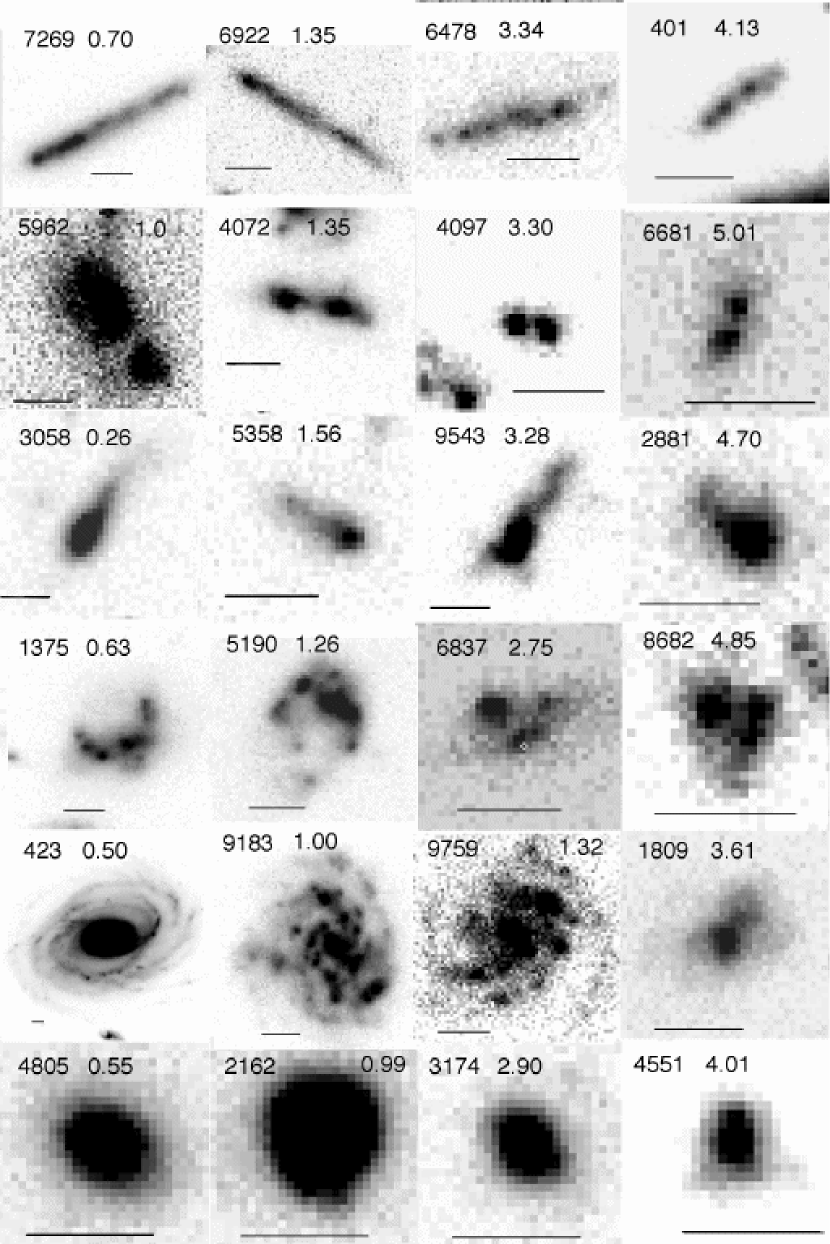
In the UDF, all galaxies (884) larger than 10 pixels in diameter were classified by visual inspection from the images into one of 6 main types: chains, with prominent clumps in a straight row; doubles, with two prominent, apparently connected clumps; clump clusters, with several apparently connected clumps in a 3-D or disk arrangement; tadpoles, with one prominent clump and a tail of smaller clumps or diffuse emission; spirals, with a nucleus, spiral arm-like structure and an exponential-like disk profile; and ellipticals, with a spheroidal central light concentration based on concentric elliptical light contours. The resulting catalog (EERS) provides the basis for what will subsequently be referred to as the morphological class for each galaxy. For the present paper, we re-examined all the entries for positional accuracy, removed any entry that had clumps with highly discrepant photometric redshifts (suggesting line of sight alignments), and expanded the list to include more galaxies at the 10 px limit. The current revised catalog includes 1003 galaxies (121 chains, 134 doubles, 192 clump clusters, 114 tadpoles, 313 spirals, and 129 ellipticals). Examples of each type over a range of photometric redshifts are shown in Figure 1 in the -band. Note that the highest spiral does not have a well-defined spiral structure; it is classified as a spiral because of its central clump and exponential light distribution.
The primary selection limits are in size (2- isophotal contour along the major axis greater than 10 px) and surface brightness (brighter than mag arcsec-2 at the 2- contour in band). On a plot of magnitude versus size (e.g., Ravindranath et al. 2004), our selection corresponds approximately to galaxies brighter than a certain magnitude limit for each size, with brighter apparent magnitude limits corresponding to larger sizes. This limit has a broad spread, however, because linear galaxies (chains, tadpoles, doubles, and edge-on spirals) have fainter magnitudes than circular galaxies for a given size and surface brightness.
Redshifts were determined using the Bayesian Photometric Redshift (BPZ) method (Benítez 2000; Coe et al. 2006), based on the ACS and NICMOS photometric data for the catalogued galaxies. New segmentation maps were made for most of the galaxies in our catalog, starting with central coordinates and estimated sizes. They were needed for the clumpy galaxies, which SExtractor often subdivided into separate objects. Some of the galaxies listed in the online UDF catalog consist of more than one object or clump at the same redshift. Because they share a 2- intensity envelope, we consider them to be single galaxies, as in EERS. The BPZ method yields a probability for the redshift of each galaxy, and a spectral type () from 1 to 8 that is based on restframe colors. The error in photometric redshift is not large enough to affect any of the discussion here; it is estimated to be (Coe et al. 2006).
The Sérsic index, , classifies galaxies by their light distributions with intensity . A Sérsic index of 1 corresponds to an exponential light distribution while a 4 corresponds to the de Vaucouleurs (1948) law for ellipticals. Spheroid-dominated galaxies are generally considered to be those with , while disk-dominated galaxies normally have (e.g., Ravindranath et al. 2006; Aceves, Velazquez, & Cruz 2006). Sérsic fits have been made to a large sample of galaxies in the GOODS field (Ravindranath et al. 2004, 2006; Cassata et al. 2005).
Galaxies in the present study were fit with the 2-dimensional routine GALFIT (Peng et al. 2002) to determine a Sérsic index and effective radius, , defined as the half-light radius based on the total integrated flux of the best-fit model for the surface brightness distribution. For galaxies with , the fits were done on the restframe B data. This means that for , the -band data were used to make the fits. For in the range from 0.24 to 0.56, -band data were used because the restframe band is centered on the observed band for . For =0.56 to 0.61, an interpolation between and was used to give the result in the restframe . For =0.61 to 0.93, band data alone were used. For the small range between to 0.94, an interpolation between and was done. Finally, for =0.94 to 1.31, band data was used. Galaxies with do not have restframe B data, so the fits were all done for in those cases. The resulting restframe UV intensity profile could differ from the restframe B-band profile if there is a red bulge or other old component in the disk that is not prominent in the restframe UV (Giavalisco et al. 1996; Kuchinski et al. 2000; Lotz et al. 2006).
UDF simulations by Coe et al. (2006) reveal the accuracy to which the Sérsic index can be measured. They find is retrieved to within for bright and large galaxies ( mag arcsec-2; pixels) and to within for faint and small galaxies ( mag arcsec-2; pixels). For UDF galaxies with relative uncertainties , 80%-95% will be correctly classified as late () or early (). Here the percentage should be towards the high end of this range because we include mostly bright UDF galaxies.
3 Results
In the following sections, we present and discuss the properties of UDF galaxies that are derived from BPZ redshifts and GALFIT profile fitting. These properties reveal that clumpy disk galaxies, the chains and clump clusters, extend to as strong starburst systems, going far beyond the optically observable range for most spirals and ellipticals, and also farther than the epoch of major mergers at when present-day large galaxies were assembled. The implications are that the most primitive galaxies are small disks, and the earliest star formation occurs in disks. The results are discussed in Sect. 4.
3.1 Redshift Distributions
Figure 2 shows the probability distribution function (pdf) for photometric redshift in each morphological type. Each pdf is constructed from the sum of the pdfs for the galaxies of that type that have the most reliable BPZ fits. Here and throughout this paper, we consider only these most reliable BPZ fits, which have and SExtractor stellarity . The resolution in is 0.01 and the redshift error, as noted above, (Coe et al. 2006). The distribution of the most-probable redshift (one value per galaxy) looks virtually identical to the plotted distribution of redshift probabilities.
The average redshift for the spirals is about 1, although there are a few at higher . This local bias is partly the result of a selection effect against face-on spirals at large resulting from surface brightness dimming (EERS). Small galaxies are also missing because our catalog has a minimum diameter of 10 pixels, which corresponds to 2.6 kpc at . Bandshifting causes spirals to drop out of the band beyond if their disks are not intrinsically bright in the UV. Thus Figure 2 indicates that large UV-bright spirals are relatively rare at , compared to the more irregular types, which are UV-bright. The redshift distribution for ellipticals is about the same as for spirals.
The linear and clumpy morphologies (chain, clump cluster, tadpole and double) can be observed to . These four types dominate at faint magnitudes too, out to 28 AB mag on the images (EERS). The large redshift range suggests they either form at high redshift and evolve slowly or they form continuously over a range of redshifts. Star formation rates estimated previously (EERS) and in other studies (e.g., Daddi et al. 2004a,b; Greve et al. 2005) suggest that galaxies with intermediate to high masses end their star formation relatively quickly, in Gyr or less (e.g., Feulner et al. 2005). In that case the disks we are observing out to probably form or light up over a wide range of redshift. This is consistent with observations by Reddy et al. (2006a) who found a wide range of star formation ages for galaxies of various sizes at , with van Dokkum et al. (2006), who found the same for massive galaxies, and with Shapley et al. (2005) who considered episodic star formation in galaxies.
Figure 3 shows the same distribution functions as in Figure 2 but plotted versus the age of the Universe at the redshift of the galaxy, with for the beginning of the Universe. The values are equal to those plotted previously, but multiplied by for in Gyr and the redshift versus age function from the CMD cosmology. The linear and clumpy morphologies form quickly and remain common in the Universe for 6 to 8 Gyr. There are apparently no local galaxies like chains or clump clusters (e.g., Smith et al. 2001).
3.2 Magnitude Distributions with Redshift
Figure 4 shows the apparent magnitude distribution as a function of redshift for our sample, sorted by morphological type. The brightest ellipticals and spirals with to 22 mag tend to be brighter than the brightest clumpy galaxies at low redshift, by 2 to 4 mag. At high redshift, all the galaxy types have about the same magnitude, 25 to 27 mag, although the spirals, ellipticals and clump clusters are still slightly brighter than the other three types, by about 1 mag on average. Presumably clump clusters are brighter than chains because the clump clusters are face-on versions of chains (see radiative transfer models for these inclination effects in Elmegreen, Elmegreen, & Hirst 2004a).
Adelberger et al. (2005) studied the clustering properties of optically selected star-forming galaxies at and found that they are likely progenitors of intermediate-mass elliptical galaxies by the time . Their sample consisted of galaxies with apparent R-band magnitudes of 23 to 25. For Bruzual & Charlot (2003) rest-frame population colors at 0.1 Gyr and at 1 Gyr, which is the appropriate color conversion for , the Adelberger et al. sample in R-band is significantly brighter than our color-corrected sample in R-band for all but the brightest low redshift spirals and irregulars. This suggests that the clumpy types in our survey are not as massive as the galaxies in the Adelberger et al. survey and should not have the same strong clustering properties.
3.3 Spectral Type Distributions with Redshift
Figure 5 shows the redshift distribution of spectral type, , for each morphological type. The redshift for each galaxy is taken to be the peak in the distribution used for Figure 2. The spectral types correspond to local equivalent types of elliptical, spiral, Irregular-Magellanic, starburst (SB3, SB2, Myr evolved from the burst, Myr evolved; Coe et al. 2006). For clarity in plotting, the spectral type index has been given a random scatter of .
The chain, double, tadpole, and clump cluster morphologies all show concentrations around , indicating they are starbursts. Very few have spectral types like local early-type spiral and elliptical galaxies. The spiral and elliptical galaxies span a wider range of than the more clumpy morphologies. There are many old population types among the low-redshift ellipticals, as expected, but there also are starburst ellipticals at all redshifts. About half of the UDF ellipticals in this starburst range have blue clumps (Elmegreen, Elmegreen, & Ferguson 2005), although other clumpy ellipticals have smaller . The most prominent elliptical galaxy concentration is at , signifying colors equivalent to late-type spirals or irregulars. A similar conclusion was made by Menanteau et al. (2004; 2006), who found blue irregularities in 30% to 50% of the ellipticals in the Tadpole galaxy field and the parallel NICMOS fields of the UDF, respectively, up to . Cross et al. (2004) also found 30% of the E/S0 types at to be blue in a wide-area deep ACS survey, and Franceschini et al. (2006) found that 30% of spheroidals and bulge-dominated disks at in have relatively blue colors. The spirals also have a concentration at and a broad extension into the starburst range. Only one spiral is as red as the reddest ellipticals.
Beyond , most galaxies in our survey are starbursting, but this is partly the result of band shifting where intrinsically red galaxies move out of the ACS spectral range. Near-IR surveys show a population of massive red galaxies at (Labbé et al. 2005) that are barely visible in optical surveys (Franx et al. 2003; Rudnick et al. 2006). Kriek et al. (2006) found red galaxies without emission lines at and consistent with no star formation. Still, Reddy et al. (2005) noted a 70%-80% overlap in the identification of star-forming galaxies selected by visible and near-IR surveys at , so our ACS survey should not miss a high fraction of the high- luminous galaxies at that redshift. Even in the IRAC bands of the Spitzer Space Telescope, massive spheroidal galaxies begin to decrease in number at , as do spirals (Franceschini et al. 2006). Daddi et al. (2005) and Cassata et al. (2005) found the same decrease in a K-band survey. This decrease is about the same as we see in the ACS, so most of our drop in elliptical and spiral numbers at is probably from a lack of galaxies and not just bandshifting.
The most massive galaxies at all redshifts tend to have the oldest stellar populations (Feulner et al. 2005; Drory et al. 2005; Franceschini et al. 2006; Kajisawa & Yamada 2006), but there are still massive galaxies at and beyond that have large star formation rates, on the order of 100 M⊙ yr-1 or more (e.g., van Dokkum et al. 2004; Fontana et al. 2004; Feulner et al. 2005; Förster Schreiber et al. 2004; Huang et al. 2005; Kong et al. 2006; Reddy et al. 2006b; Rigopoulou et al. 2006; Webb et al. 2006). This is consistent with the presence of high galaxies out to in Figure 5.
3.4 Redshift Distribution of Comoving Density
The comoving density of each morphological type with starburst spectra, , is plotted versus redshift in Figure 6. We restrict ourselves to this starburst range for so that bandshifting out to does not systematically remove galaxies from the ACS images. Ferreras et al. (2005b) considered comoving density for all early type galaxies in the UDF and found a decrease from to 1.2.
The basic equations for the co-moving volume per unit solid angle and per unit redshift were obtained from Carroll, Press & Turner (1992). We used a solid angle corresponding to 11.97 arcmin2, which is the part of the UDF that has at least half of the average depth of the whole image (Coe et al. 2006). Then the comoving volume per unit redshift, , was determined from the basic equations, and the integrated volume was found from the integral over : . To find the density, we counted the number of galaxies of each morphological type with using equal intervals of (, , etc.), and divided by the comoving volume sampled by this interval (, , etc., respectively). The resulting densities are typically several times Mpc-3. Note that the vertical scale in Figure 6 is larger for spirals and clump clusters, which are more abundant than the other types in the UDF.
The comoving densities systematically decrease to higher , but the decrease is much faster for spirals and ellipticals than it is for clumpy irregulars. This is not a bandshifting effect because we have plotted only galaxies that are bright in the restframe uv (). The observed decrease for spirals and ellipticals is a combination of other selection effects and a real decrease in these types.
Our primary selection effect is the surface brightness limit of the UDF survey. The angular size limit (10 px) is not severe because galaxy angular sizes for a given physical size do not change significantly for in the range from 1 to 5. On the other hand, the observed surface brightness gets faint quickly for a given intrinsic surface brightness, as in magnitudes arcsec-2. Figure 7 shows the absolute magnitudes of all our galaxies, obtained from Figure 4 by applying the distance modulus for the standard cosmology (Spergel et al. 2003) to the observed magnitude (which is in the restframe UV). The rapid rise in absolute magnitude at high indicates that we are selecting only the brightest galaxies at high , and it also reflects the SED shape of a young galaxy or starburst. For a starburst SED, the high redshift emission in the z850 band, which corresponds to the restframe uv, is intrinsically brighter than the low redshift emission in the z850 band, which corresponds to a restframe visible or red.
Cosmic variance in our sample can be estimated from Somerville et al. (2004). Considering chain galaxy counts as representative, we derive cosmic variance fluctuations ranging from counts at to counts at . These variations are not large enough to affect the overall trends in Figure 6.
Other selection effects should be considered. Highly clumped galaxies are easier to see than smooth galaxies when there is surface brightness dimming because the clumps stand out as local islands of brightness. Surface brightness dimming makes the interclump emission fainter while the clumps remain visible, although at low intensity. If these clumps are smoothed over into a region like a spiral galaxy disk with the same average surface brightness, then this average will fall below the survey limit before the individual clump brightness does. We noticed this same effect in the distribution of axial ratios (EERS): face-on spiral galaxies are relatively rare compared to edge-on spirals in the UDF, but face-on clumpy galaxies (the clump clusters) have their expected abundance compared to the edge-on clumpy galaxies (the chains). The reason for this difference is that face-on spirals have lower surface brightness than edge-on spirals, so they disappear from the UDF survey where the a surface brightness limit is close to the average. The clumps are nearly always visible in the clumpy galaxies, however, regardless of the orientation of the surrounding disk. This difference in surface brightness dimming for clumpy and smooth galaxies could partly explain why the comoving densities of the four clumpy types with do not decrease as fast as the comoving densities of spirals and ellipticals with .
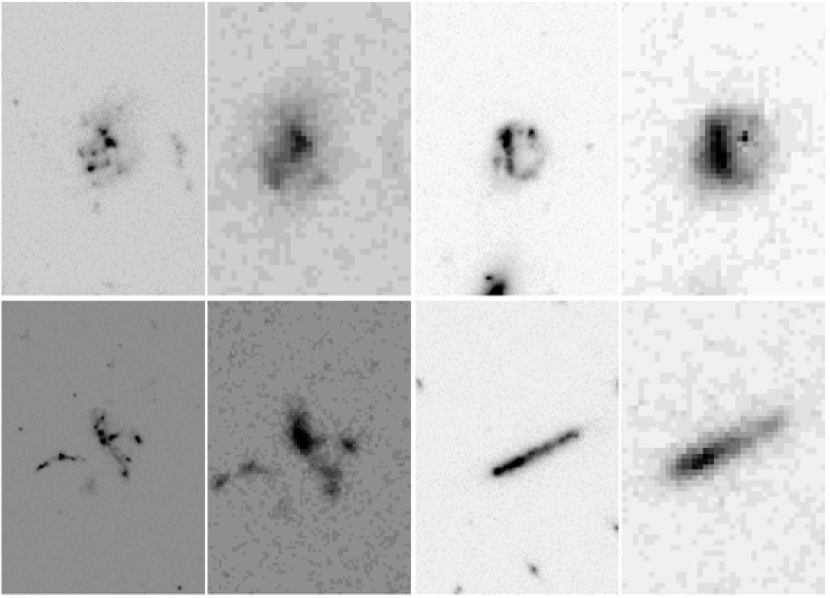
A third effect to consider for Figure 6 is that some of the highest- clump clusters and chain galaxies could be the star-forming parts of spirals (e.g., Toft et al 2005; Cassata et al. 2005). The red bulges and underlying red disks of these spirals could be invisible in the ACS. Such a change in morphological type with redshift would flatten the comoving density distribution of the clump clusters and chains, while steepening it for the spirals. We checked for this possibility by viewing the NICMOS J-band images of clump cluster galaxies. The NICMOS images are not high enough resolution to see the details of star formation (0.09 arcsec px-1), but they should resolve bulges and see the underlying smooth red disks. We found that clump cluster and chain galaxies look about the same in the NICMOS and ACS images. Figure 8 shows four examples with the ACS band on the left and the J band from NICMOS on the right. The impression of a disk dominated by irregular clumps remains even in the near-IR; there are no surprising central bulges and the smooth disk component has about the same contrast to the clumps in both passbands.
These considerations add to the results of Daddi et al. (2005), Cassata et al. (2005), and Franceschini et al. (2006), who found a real decrease in spiral and elliptical galaxy co-moving densities at , even for early spectral types. Considering only the starbursting types here, Figure 6 suggests again that spirals and ellipticals decrease in co-moving density relatively quickly, but it also shows that intense star formation in giant clumps causes the irregular types to decrease with more slowly. In both cases, the spirals and ellipticals that have smooth surface brightness distributions like modern spirals and ellipticals are replaced by extremely clumpy galaxies of all types, including clumpy spirals and ellipticals, at . A similar conclusion was reached by Conselice et al. (2005a) who referred to the clumpy types as peculiar galaxies. We believe it is important that they are clumpy and not just peculiar in overall shape.
According to Figure 6, the dominant morphology for to 2 is a clump cluster. At higher , the combined clumpy types outnumber the combined starburst spiral and elliptical types by about a factor of 2. The starbursting spirals dominate only at , and then they become only as abundant as the sum of the clump clusters and chains. We have previously noted that spiral galaxies look like smoothed versions of clump clusters and chains (Elmegreen et al. 2005b), so there should be an evolutionary effect at work: clump clusters and chains turn into spiral galaxies if they avoid major mergers.
3.5 The Distribution
The uniformity of a sample of galaxies along a line of sight can be determined from the distribution function of the ratio of the survey volume to each object, , divided by the survey volume to the maximum distance where that object would be included, (Schmidt 1968). If is uniformly distributed with an average of around 0.5, then the sample is uniform on the line of sight. For our sample, is given by the redshift where the object either becomes smaller than our size cutoff of 10 pixels, or becomes fainter than our surface brightness limit, which is assumed to be 26.5 mag arcsec-2 at band, considering that twice the noise rms dispersion is 26 mag arcsec-2. We find that the surface brightness limit dominates .
Figure 9 shows histograms for the distributions of all spectral types , and shows crosses for the distribution of starbursting types, . For the clumpy types, the two distributions are about the same because most have ; they show that there is an approximately uniform distribution of these types out to the limit of the survey, . For the spirals and ellipticals, for all spectral types peaks at low values, indicating that most of these types are at low redshift, as also seen in Figure 2. For the starbursting spirals and ellipticals, the distribution is more uniform with a drop finally at . These results are consistent with the results in the previous section which suggested that we are seeing most of the clumpy galaxies out to the redshift () where the optical restframe is bandshifted beyond the ACS survey. We are also seeing most of the starbursting spirals and ellipticals in this survey, except for those at highest redshift.
3.6 Sérsic Index Distributions
Figure 10 shows the redshift distribution of the Sérsic index . Our selection of galaxies with px diameter ensures that they are resolved well enough to give reliable Sérsic parameters. Moth & Elston (2002) suggest that when the effective radius drops below px for an elliptical galaxy, the Sérsic index drops from to as a result of poor resolution. All our galaxies have effective radii comparable to or larger than 5 px (see Fig. 12).
In Figure 10, the chain, clump cluster, and double galaxies have a relatively large concentrations with . These galaxies are dominated by clumps without much variation in the underlying light (Elmegreen, et al. 2004b), so their Sérsic indices are close to zero, which corresponds to a flat profile inside the half-light radius and a steep profile beyond. Ravindranath et al. (2006) also found low for multicore objects. Cassata et al. (2005) found low for what they call perturbed spirals and irregulars/mergers. The tadpole distribution is similar to the chain and clump cluster distribution, but it spreads to higher . The high- tadpoles could have de Vaucouleurs profiles in the bright clumps that define their comet-like heads.
The spirals concentrate around with standard exponential disks. A few spirals with higher are probably dominated by a bulge. The ellipticals have a similar concentration around , but also extend to higher , indicating more centrally concentrated inner radial profiles and flatter outer radial profiles. There is no particular tendency for ellipticals to have the de Vaucouleurs profile, , even at small . It is surprising that many galaxies with the appearance of ellipticals have near-exponential light profiles. A few of these could be early type structureless disks (S0’s), but not the majority of them because the distribution of axial ratios for galaxies classified as ellipticals in the UDF is the same as it is locally (EERS).
Cassata et al. (2005) found that 40% of what they call normal spirals with have Sérsic indices larger than 2, and 10% of their ellipticals with have Sérsic indices less than 2. Our spiral fraction at is much lower than 40%. This is not a selection effect in the classification of spirals because any galaxy with a bulge, spiral arms, and a decreasing radial light profile was considered to be a spiral. This would include disks if there were any with bulges and spirals, but there are evidently not many of these. Our fraction for ellipticals is higher than that of Cassata et al., especially at . Hatziminaoglou et al. (2005) found that 30% of both spirals and ellipticals are mis-classified by the Sérsic index (with as the boundary). They suggested some low- ellipticals are S0 types and others are too small to get a good value; they also reported that large- spirals have either dominant bulges or are too small to measure. Our measurements should not suffer from size effects (see above). di Serego Alighieri et al. (2005) studied 18 early type galaxies in clusters at and found a wide range of (% have ), but they also pointed out a correlation, present in the Coma cluster too, where lower luminosity galaxies have lower , even as low as 1. A similar -luminosity correlation was noted by Cross et al. (2004) for E/S0 galaxies from . Simulations of galaxy mergers that make ellipticals, and observational studies of mergers, show there should be a wide range of Sérsic indices for these types (Aceves, Velazquez, & Cruz 2006).
The Sérsic index is plotted versus the spectral type in Figure 11. For clarity in plotting, the points are offset randomly around their index values (). There is wide range of Sérsic indices for each . The indices for ellipticals range from less than 1 up to 8 in our sample, independent of spectral type. The spirals typically have , as do local spirals, also independent of spectral type. The chain, double, tadpole, and clump cluster galaxies generally have and , as noted above. Evidently, spectral energy distributions of resolved galaxies in the UDF are not uniquely linked to their morphology, and neither property correlates well with the form of the radial light profile. The reason for this is that ellipticals are not well distinguished by their Sérsic profiles, and both modern types, spirals and ellipticals, have a wide range of star formation rates.
3.7 Size Evolution
Galaxy growth over redshift is expected to be significant in the context of hierarchical galaxy formation, although current observations show that for the size remains fairly constant. Ravindranath et al. (2004) found that disk galaxies in the GOODS-S field at do not show significant size evolution when selection effects are considered. Barden et al. (2005) got a similar result for disk galaxies in GEMS and concluded that size has to increase with mass to keep the mass-radius relation constant over redshift. Trujillo & Pohlen (2005) observed a 25% growth in the outer disk truncation radius of UDF spirals over this redshift range, while Pirzkal et al. (2006) found essentially no evolution in size from to 0 for small, blue UDF galaxies. Stockton et al. (2006), on the other hand, found two red spiral galaxies at that are about half the size of local spirals.
Many studies have shown that a factor of 2 in growth is typical for longer redshift intervals. Roche et al. (1998) found that size evolution begins to appear at but primarily for the star-forming galaxies. Cassata et al. (2005) observed the opposite: ellipticals are a factor of smaller at than but irregulars have a constant size. Daddi et al. (2005) obtained the same growth factor since in his sample of 7 early type galaxies, one of which could be a spiral. Trujillo et al. (2006a) examined galaxies at in the SDSS, GEMS, and FIRES surveys and found that Sérsic galaxies are smaller than they are today for a given luminosity by more than a factor of 2 at ; galaxies were nearly 3 times smaller at than equal luminosity galaxies today. Trujillo et al. (2006a) got a factor of variation for a given mass since for both low and high- galaxies. Other evidence for growth from to 1.5 was seen in a sample of galaxies of all types from the HDF-N and CDF-S fields (Ferguson et al. 2004) and for a sample of disk galaxies from the HDF-S (Tamm & Tenjes 2006). Bouwens et al. (2003) found a 1.7 times increase in size for a mixture of morphological types from to based on HDF data, and Bouwens et al. (2004a; 2006) observed size evolution from to for a mixture of types in the UDF data. Conselice et al. (2003) also found a factor of 2 variation in size for the largest galaxies with a mixture of morphologies in the HDF between and 4.
Some of this size evolution could be the result of restframe surface brightness evolution because galaxies at high redshift are starbursting for all (see above). This makes their surface brightnesses high, and then intrinsically small galaxies can have the same luminosities as present-day large galaxies, even if there is no growth over time. Some of the apparent size evolution could be from size-of-sample effects considering that the size distribution function favors small galaxies. Then a limited sample of galaxies would have a smaller average size and a smaller largest galaxy size than a big sample of galaxies.
We are interested in the size evolution for each morphological type. We previously measured the distribution of exponential scale lengths for all resolved spiral galaxies in the UDF, without separation into redshift intervals, and found the average length to be about half that for local spirals (Elmegreen et al. 2005b); this is consistent with the other results mentioned above because spirals concentrate at (Fig. 2). Here we consider galaxy size as a function of both morphological type and redshift. The clumpy morphological types require special definitions of size because Sérsic fits and the associated effective radii may not be appropriate for such irregular structures. We also want sizes that are independent of surface brightness dimming. For spiral and elliptical galaxies, this means the total light profile has to be extrapolated to infinity, beyond the visible edge, in order to find the half radius of the total, extrapolated light. This is the standard procedure in GALFIT, which was used here. However, the light profile is neither regular nor predictable beyond the last clump in a highly clumpy galaxy, so again, is not a good measure for these types.
Figures 12 and 13 show size distributions versus for each type, with sizes measured differently in the two figures. The solid curve in each is the size of a M⊙ galaxy at 200 times the average density of the Universe, from Mo, Mau & White (1998). The dashed curve is the size of 5 pixels, the minimum 2- major-axis contour radius for our survey.
In Figure 12, the sizes for the chains, tadpoles, and doubles are defined to be half the separations between the main clumps at the ends of the linear structures. For clump clusters, the sizes are defined to be the deprojected rms separations between the clumps (deprojection assumes circular galaxies and uses the measured major and minor axis lengths). The elliptical sizes were measured in the usual way, using the half-light effective radii defined by GALFIT. The spiral sizes were measured in a somewhat standard way, using their exponential disk scale lengths (from Elmegreen et al. 2005b). Because these sizes are measured in different ways for the different morphologies, the distributions should not be directly compared to each other in Figure 12.
In Figure 13, the sizes are taken to be from GALFIT. Even in this case, comparisons between the different morphologies should be done with care. For example, for a double galaxy, each part of which looks spheroidal, is proportional to the separation between the clumps and nearly independent of the size of each one.
The relative size distributions are about the same in both figures. The chains, spirals, and clump clusters show a decrease in size by about a factor of 3 from to 4, roughly following the solid line. The doubles and ellipticals show a factor of 2 size decrease from to 5. The tadpoles have widely scattered size distributions with no obvious trend. This lack of evolution for tadpoles may not be surprising if tadpoles are interacting galaxies with long tidal tails; the sizes we measure are essentially the lengths of the tails. For all types, the lowest redshift galaxies () are among the smallest, but this is probably a selection effect for the choice of UDF field (which avoided galaxies that are large in angular size).
The average size distributions for galaxies cannot be determined from these figures because of the constant lower limit from our sample criterion. The trends in the upper limits are not good indications either because of possible size-of-sample effects. That is, there are more low- galaxies than high- galaxies, and for the galaxy size distribution function, which has more smaller galaxies than larger galaxies, the size of the largest galaxy in a big sample (the low-z sample) is likely to be larger than the size of the largest galaxy in a small sample (the high-z sample). This could explain our observed size-redshift trend even if the intrinsic size distribution at each redshift is constant. Still, the trends in the figure suggest that, aside from the tadpoles, the observed UDF galaxies increase in size by factors of 2 to 3 from to .
4 Discussion
The redshift distributions of the spectral types, Sérsic indices, and sizes of galaxies in the ACS image of the UDF have been shown for 6 galaxy types, which are the usual spiral and elliptical types plus four peculiar types that are characterized by their clumpy structures. The UDF spirals and ellipticals have a relatively small range of redshifts, centered on , while the clumpy galaxies have a broad range, from to 5. Most of the clumpy types have starburst spectra, and all of the spirals and ellipticals in our sample are starbursts.
Starburst galaxies in the UDF in every redshift interval are dominated by the four clumpy types, which are the chains, clump clusters, tadpoles and doubles. The comoving density (Fig. 6) of clump clusters and chains exceeds the comoving density of spirals and ellipticals in every redshift bin beyond by an average factor of . The comoving density of all clumpy types exceeds that of spirals and ellipticals by a factor of 3.2 for . For , spirals dominate all other starburst types, but the combination of the clumpy types exceeds the combined spirals and ellipticals by a factor of 1.2.
These observations indicate that star formation occurs in giant clumps in the disk-like UDF galaxies that have no bulges or exponential light profiles. These clumpy disks span the full range of observable redshifts, out to at least , and presumably form, merge, and evolve into spirals and ellipticals continuously over this time. Considering the sizes and separations of the clumps, the most likely mechanism for clump formation is a gravitational instability in the gaseous component of the disk or in the shock between interacting disks. This scenario follows from our previous observations (EE05, EE06), which showed that clumps have sizes and masses consistent with the Jeans length and mass in a gas layer with a turbulent speed of km s-1 or more. For dominant unstable wavenumber in a disk with mass column density and velocity dispersion , the Jeans mass is . Taking M⊙ pc-2, as observed for chains and edge-on spirals in the UDF and for modern thick disks, and km s-1 to explain the disk thicknesses at high redshift (see EE06 for both measurements), we get M⊙, in good agreement with the observed clump masses (EE05).
Clump masses in clump cluster and chain galaxies are a factor of larger than cluster and star complex masses in modern disk galaxies, indicating that star formation was more violent at high redshift than it is today. The clumpiest disks also extend to higher redshifts than the smooth disks, so the clumpy disks are probably the most primitive. Most likely, the clumps in clumpy disks dispersed and mixed to make the smooth disks (see also Elmegreen et al. 2005b). This would presumably happen even at the highest redshifts in our survey, , thereby accounting for the giant red spirals at , and following mergers, the giant red ellipticals as well. This scenario is consistent with the stellar evolution models by Fritz von Alvensleben & Bicker (2006) and the observations by Bundy et al. (2005, 2006) where spirals turn into ellipticals after ending their star formation some 1-2 Gyr earlier. We note that during mergers, star formation can occur in spheroidal geometries if the original disk components warp and scatter their giant clouds into new orbits that fill the volume of the spheroid. Still, the main star formation mechanism is likely to be one preferential to disks because that is where the dense gas is.
The constancy of the comoving density and the ratio for tadpoles and doubles suggests that galaxy interactions and mergers were common back to . The tadpoles are presumably interacting galaxies with long tidal tails (e.g., Straughn et al. 2006) and the doubles are presumably near-neighbor spheroidals in the process of merging (Tran et al. 2005; van Dokkum 2005; Mei et al. 2006; Bell et al. 2006).
Clump cluster and chain galaxies are only moderately luminous and should therefore not cluster as strongly as the massive galaxies of this epoch (Sect. 3.2). According to cosmological simulations, galaxy brightness at high redshift correlates with dark matter mass, and this mass increases as the the scale length increases for 2-point correlations with other bright galaxies. For this reason, bright galaxies at high redshift should end up as massive ellipticals in rich clusters where interactions have been strong (see Adelberger et al. 2005). Without strong clustering, the clump cluster and chain galaxies at low and intermediate redshifts could evolve in relative isolation, possibly forming modern spirals after continued growth through accretion and minor mergers. They would seem to make only late-type spirals, however, because they have no bulges. Bulges could result from clump coalescence (Noguchi 1999; Immeli et al. 2004a,b), or bar dissolution (Hasan & Norman 1990), but then there is no clear way to make nuclear black holes unless they are already inside the disk clumps and merge or they grow in the nuclei over extended periods of time from accreted disk gas. The giant clumps do not appear dense enough to make black holes, however (e.g., see Ebisuzaki et al. 2001). Their average densities correspond to only a few tens of atoms cm-3 (EE05). The second possibility, slow growth of black holes, would not obviously account for the bulge-black hole mass correlation. If, having no bulges, clump clusters and chains form only late-type spirals, then where are the predecessors of early-type spirals at ? Early-type spiral progenitors would seem to be our clumpy disks at the highest redshifts, because these would convert their gas into stars and fade relatively early. They are still lacking bulges, though.
It is conceivable that most of the clump cluster and chain galaxies at in the UDF do not survive in relative isolation, dissolving and blending their clumps over time to make smooth exponential disks. Instead, they could undergo major mergers that either form spheroids or, in the case of in-plane orbital motions, force the gas and stars into the nuclear regions to make black holes and bulges surrounded by a residual disk (e.g., Hopkins et al. 2006). If this is the case, then these peculiar types are temporary states that give us a snapshot of what star formation in isolated galaxies was like in the early Universe.
5 Conclusions
Spectral energy distributions, , Sérsic indices, galaxy morphologies, and galaxy sizes were studied as functions of redshift for galaxies in the UDF. Galaxies that appear to be elliptical have the full range of Sérsic indices with a concentration around for all . The ellipticals also have a wide range of spectral types at low . At high , all observed galaxy types have starburst spectra because our selection in ACS optical bands corresponds to the restframe UV wavelength. The spiral galaxies have Sérsic indices around and a redshift distribution of spectral types similar to that of ellipticals: a broad range at low and only starbursts at high . The comoving volume density of starbursting spirals and ellipticals falls off rapidly with redshift. The fall-off is slower for the clumpy morphologies, which are generally starbursting and which dominate every redshift interval in the UDF. The distribution shows the same trends. Red spiral and elliptical galaxies at are not observed in the ACS because of bandshifting. The sizes of all galaxies except for tadpoles increase by a factor of from to 1. Size-of-sample effects and the minimum size cutoff prevent definite conclusions about galaxy growth rates at this time.
The observations here and in our previous papers (EE05, EE06) support a model in which star formation occurs primarily in disks by gravitational instabilities having a Jeans mass of M⊙ and a Jeans length of several kpc. The disks extend back to at least . Clump clusters and chains are examples of star-forming disks at their earliest stage. The comoving density of these two types combined exceeds that of starbursting spirals and ellipticals at by a factor of 1.8. Clump clusters and chains appear to be the initial conditions for spiral galaxies and ultimately, through successive mergers, for spheroids as well. There is no evidence for a star formation mode like what is usually assumed for isolated monolithic collapse; i.e., dispersed and spheroidal primary sites with a gradual settling of the associated clouds to a disk. Instead, star formation appears to begin in disks at high redshifts and then become spheroidal later, if it does at all, by three-dimensional scattering and shocking of the disk clouds during major mergers.
The lack of bulges in clump cluster and chain galaxies is a mystery. Either these types form bulges late, after the primitive disk stage we see in the UDF but before they become modern spirals, or they get significantly reorganized by mergers into ellipticals and spiral galaxies with bulges.
References
- (1) Abraham, R., Tanvir, N., Santiago, B., Ellis, R., Glazebrook, K., & van den Bergh, S. 1996a, MNRAS, 279, L47
- (2) Abraham, R., van den Bergh, S., Glazebrook, K., Ellis, R., Santiago, B., Surma, P., & Griffiths, R. 1996b, ApJS, 107, 1
- (3) Abraham, R., van den Bergh, S., & Nair, P. 2003, ApJ, 588, 218
- (4) Aceves, H., Velazquez, H., & Cruz, F. 2006, MNRAS, in press, astro-ph/0601412
- (5) Adelberger, K.L., Steidel, C.C., Pettini, M., Shapley, A.E., Reddy, N.A., & Erb, D.K. 2005, ApJ, 619, 697
- (6) Almaini, O., Dunlop, J.S., Conselice, C.J., Targett, T.A., & McLure, R.J. 2006, astroph/0511009
- (7) Andreon, S. 2006, MNRAS, 369, 969
- (8) Barnes, J.E., & Hernquist, L. 1992, ARAA, 30, 705
- (9) Barden, M. et al. 2005, ApJ, 635, 959
- (10) Beckwith, S.V.W., et al. 2006, AJ, 132, 1729
- (11) Bell, E.F. et al. 2006, ApJ, 640, 241
- (12) Benítez, N. 2000, ApJ, 536, 571
- (13) Bouwens, R., Broadhurst, T., & Illingworth, G. 2003, ApJ, 593, 640
- (14) Bouwens, R., Illingworth, G., Blakeslee, J., Broadhurst, T., & Franx, M. 2004a, ApJ, 611, L1
- (15) Bouwens, R. J., Illingworth, G. D., Blakeslee, J. P., & Franx, M. 2006, astroph/0509641
- (16) Brook, C., Kawata, D., Martel, H., Gibson, B., & Bailin, J. 2006, ApJ, 639, 126
- (17) Bruzual, G. & Charlot, S. 2003, MNRAS, 344, 1000
- (18) Bundy, K., Fukugita, M., Ellis, R.S., Kodama, T., & Conselice, C.J. 2004, ApJ, 601, L123
- (19) Bundy, K. et al. 2006, ApJ, 651, 120
- (20) Bundy, K., Ellis, R.S., & Conselice, C.J. 2005, ApJ, 625, 621
- (21) Carroll, S.M., Press, W.H., & Turner, E.L. 1992, ARAA, 30, 499
- (22) Cassata, P. et al. 2005, MNRAS, 357, 903
- (23) Cimatti, A., Daddi, E., & Renzini, A. 2006, A&A, 453, L29
- (24) Clemens, M.S., Bressan, A., Nikolic, B., Alexander, P., Annibali, F., & Rampazzo, R. 2006, MNRAS, 370, 702
- (25) Conselice, C.J. 2003, ApJS, 147, 1
- (26) Conselice, C. J., Bershady, M.A., Dickinson, M., & Papovich, C. 2003, AJ, 126, 1183
- (27) Conselice, C.J., Bershady, M.A., Dickinson, M., & Papovich, C. 2003, AJ, 126, 1183
- (28) Conselice, C. J., Blackburne, J. A., & Papovich, C. 2005a, ApJ, 620, 564
- (29) Conselice, C.J., Bundy, K., Ellis, R.S., Brichmann, J., Vogt, N.P., & Phillips, A.C. 2005b, ApJ, 628, 160
- (30) Conselice, C.J., et al. 2006, astroph/0607242
- (31) Conselice, C., Grogin, N.A., Jogee, S., Lucas, R.A., Dahlen, T., de Mello, D., Gardner, J.P., Mobasher, B., Ravindranath, S. 2004, ApJ, 600, L139
- (32) Coe, D., Benítez, N., Sanchez, F., Jee, M., Bouwens, R., & Ford, H. 2006, AJ, 132, 926
- (33) Cowie, L., Hu, E., & Songaila, A. 1995, AJ, 110, 1576
- (34) Cross, N.J.G., et al. 2004, AJ, 128, 1990
- (35) Daddi, E., Cimatti, A., Renzini, A., Fontana, A., Mignoli, M., Pozzetti, L., Tozzi, P., & Zamorani, G. 2004a, ApJ, 617, 746
- (36) Daddi, E., et al. 2004b, ApJ, 600, L127
- (37) Daddi, E., et al. 2005, ApJ, 626, 680
- (38) Dawson, S., McCrady, N., Stern, D., Eckart, M.E., Spinrad, H., Liu, M.C., & Graham, J.R. 2003, AJ, 125, 1236
- (39) De Lucia, G., & Blaizot, J. 2006, astroph/0606519
- (40) de Mello, D., Wadadekar, Y., Dahlen, T., Casertano, S., & Gardner, J.P. 2006, AJ, 131, 216
- (41) de Vaucouleurs, G. 1948, Ann. d’Astrophys, 11, 247
- (42) de Vaucouleurs, G., de Vaucouleurs, A., Corwin, H., Buta, R., Paturel, G., Fouque, P. 1991, Third Reference Catalogue of Bright Galaxies, (New York: Springer-Verlag)
- (43) di Serego Alighieri, S. et al. 2005, A&A, 442, 125
- (44) di Serego Alighieri, S., Lanzoni, B., & J rgensen, I. 2006, ApJ, 647, L99
- (45) Driver, S.P., et al. 2006, MNRAS, 368, 414
- (46) Drory, N., Salvato, M., Gabasch, A., Bender, R., Hopp, U., Feulner, G., & Pannella, M. 2005, ApJ, 619, L131
- (47) Ebisuzaki, T. et al. 2001, ApJ, 562, L19
- (48) Eggen, O.J., Lynden-Bell, D., & Sandage, A.R. 1962, ApJ, 136, 748
- (49) Elmegreen, B.G., Elmegreen, D.M., & Hirst, A.C. 2004a, ApJ, 604, L21
- (50) Elmegreen, D.M., Elmegreen, B.G., & Sheets, C. 2004b, ApJ, 603, 74
- (51) Elmegreen, B.G., & Elmegreen, D.M. 2005, ApJ, 627, 632
- (52) Elmegreen, B.G., & Elmegreen, D.M. 2006, ApJ, 650, 644
- (53) Elmegreen, D.M., Elmegreen, B.G., & Ferguson, T.E. 2005, ApJ, 623, L71
- (54) Elmegreen, D.M., Elmegreen, B.G., Rubin, D.S., & Schaffer, M.A. 2005a, ApJ, 631, 85 (EERS)
- (55) Elmegreen, B.G., Elmegreen, D.M., Vollbach, D., Foster, E., & Ferguson, T. 2005b, ApJ, 634, 101
- (56) Elmegreen, D.M. 2007, IAU Symosium 235, ed. F. Combes & J. Palous, Cambridge: Cambridge Univ. Press, in press.
- (57) Ferguson, H.C. et al. 2004, ApJ, 600, L107
- (58) Ferreras, I., Lisker, T., Pasquali, A., Carollo, C. M., Lilly, S. J., Mobasher, B. 2005a, astroph/0509526
- (59) Ferreras, I., Lisker, T., Carollo, C. M., Lilly, S. J., & Mobasher, B. 2005b, ApJ, 635, 243
- (60) Feulner, G., Gabasch, A., Salvato, M., Drory, N., Hopp, U., & Bender, R. 2005, ApJ, 633, L9
- (61) Fontana, A., et al. 2004, A&A, 424, 23
- (62) Förster Schreiber, et al. 2004, ApJ, 616, 40
- (63) Franceschini, A., et al. 2006, A&A, 453, 397
- (64) Franx, M., et al. 2003, ApJ, 587, L79
- (65) Fritze von Alvensleben, & Bicker, J. 2006, A&A, 454, 67
- (66) Fu, H., Stockton, A., & Liu, M. 2005, ApJ, 632, 831
- (67) Genzel, R., Baker, A.J., Tacconi, L.J., Lutz, D., Cox, P., Guilloteau, S., & Omont, A. 2003, ApJ, 584, 633
- (68) Genzel, et al. 2006, Nature, 442, 786
- (69) Giavalisco, M., Steidel, C. & Macchetto, F.D. 1996, ApJ, 470, 189
- (70) Giavalisco, M., et al. 2004, ApJ, 600, L103
- (71) Greve, T.R., et al. 2005, MNRAS, 359, 1165
- (72) Hasan, H. & Norman, C. 1990, ApJ, 361, 69
- (73) Hatziminaoglou, E., et al. 2005, MNRAS, 364, 47
- (74) Homeier, N.L. et al. 2006, ApJ, 647, 256
- (75) Hopkins, P.F., Bundy, K., Hernquist, L., & Ellis, R.S. 2006, astroph/0601621
- (76) Huang, J.-S., et al. 2005, ApJ, 634, 137
- (77) Immeli, A., Samland, M., Gerhard, O., & Westera, P. 2004a, A&A, 413, 547
- (78) Immeli, A., Samland, M., Westera, P., & Gerhard, O. 2004b, ApJ, 611, 20
- (79) Iye, M. et al. 2003, ApJ, 590, 770
- (80) Kajisawa, M., & Yamada, T. 2001, PASJ, 53, 833
- (81) Kajisawa, M., & Yamada, T. 2006, ApJ, 650, 12
- (82) Khochfar, S., & Burkert, A. 2003, ApJ, 597, L117
- (83) Kong, X., et al. 2006, ApJ, 638, 72
- (84) Kravtsov, A.V., & Gnedin, O.Y. 2005, ApJ, 623, 650
- (85) Kriek, M., et al. 2006, ApJ, 649, L71
- (86) Kuchinski, L.E. et al. 2000, ApJS, 131, 441
- (87) Labbé, I., et al. 2005, ApJ, 624, L81
- (88) Larson, R.B. 1975, MNRAS, 173, 671
- (89) Longhetti, M., et al. 2005, MNRAS, 361, 897
- (90) Lotz, J., Madau, P., Giavalisco, M., Primack, J., & Ferguson, H. 2006,ApJ, 636, 592
- (91) Mei, S. et al. 2006, ApJ, 639, 81
- (92) Menanteau, F., Abraham, R.G., & Ellis, R.S. 2001, MNRAS, 322, 1
- (93) Menanteau, F., et al. 2004, ApJ, 612, 202
- (94) Menanteau, F., Ford, H.C., Motta, V., Benítez, N., Martel, A., Blakeslee, J.P., & Infante, L. 2006, ApJ, 131, 208
- (95) Menanteau, F., et al. 2005, ApJ, 620, 697
- (96) Mo, H.J., Mao, S., & White, S.D.M. 1998, MNRAS, 295, 319
- (97) Moth, P., & Elston, R.J. 2002, AJ, 124, 1886
- (98) Noguchi, M. 1999, ApJ, 514, 77
- (99) Pasquali, A., et al. 2006, ApJ, 636, 115
- (100) Peng, C.Y., Ho, L.C., Impey, C.D., & Rix, H.-W. 2002, AJ, 124, 266
- (101) Pirzkal, N. et al. 2006, ApJ, 636, 582
- (102) Ravindranath, S. et al. 2006, ApJ, 652, 963
- (103) Ravindranath, S., et al. 2004, ApJ, 604, L9
- (104) Reddy, N.A., Erb, D.K., Steidel, C.C., Shapley, A.E., Adelberger, K.L., & Pettini, M. 2005, ApJ, 633, 748
- (105) Reddy, N.A., Steidel, C.C., Erb, D.K., Shapley, A.E., & Pettini, M. 2006b, astroph/0609296
- (106) Reddy, N.A., Steidel, C.C., Fadda, D., Yan, L., Pettini, M., Shapley, A., Erb, D.K., & Adelberger, K.L. 2006a, ApJ, 644, 792
- (107) Reshetnikov, V., Dettmar, R.-J., & Combes, F. 2003, A&A, 399, 879
- (108) Rigopoulou, D., et al. 2006, ApJ, 648, 81
- (109) Robertson, B., Cox, T.J., Hernquist, L., Franx, M., Hopins, P.F., Martini, P., & Springel, V. 2006, ApJ, 641, 21
- (110) Roche, M., Ratnatunga, K., Griffiths, R.E., Im, M., & Naim, A. 1998, MNRAS, 293, 157
- (111) Roche, N.D., Dunlop, J., Caputi, K.I., McLure, R., Willott, C.J., & Crampton, D. 2006, MNRAS, 370, 74
- (112) Rudnick, G., et al. 2006, ApJ, 650, 624
- (113) Sandage, A. 2005, ARAA, 43, 581
- (114) Saracco, P., et al. 2005, MNRAS, 357, L40
- (115) Schmidt, M. 1968, ApJ, 151, 393
- (116) Schweizer, F. 1996, AJ, 111, 109
- (117) Sérsic, J.L. 1968, Atlas de Galaxias Australes, (Cordoba, Argentina: Observatorio Astronomico)
- (118) Shapley, A.E., Steidel, C.C., Erb, D.K., Reddy, N.A., Adelberger, K.L., Pettini, M., Barmby, P., & Huang, J. 2005, ApJ, 626, 698
- (119) Sheth, R.K., Jimenez, R., Panter, B., & Heavens, A.F. 2006, ApJ, 650, L25
- (120) Smail, I., Chapman, S. C., Blain, A. W., & Ivison, R. J. 2004, ApJ, 616, 71
- (121) Smith, A.M., et al. 2001, ApJ, 546, 829
- (122) Somerville, R.S., Lee, K., Ferguson, H.C., Gardner, J.P., Moustakas, L.A., & Giavalisco, M. 2004, ApJ, 600, L171
- (123) Spergel, D.N., et al. 2003, ApJS, 148, 175
- (124) Stanford, S.A., Dickinson, M., Postman, M., Ferguson, H.C., Lucas, R.A., Conselice, C.J., Budavári, T., & Somerville, R. 2004, AJ, 127, 131
- (125) Stockton, A., McGrath, E., & Canalizo, G. 2006, ApJ, 650, 706
- (126) Stockton, A., Canalizo, G., & Maihara, T. 2004, ApJ, 605, 37
- (127) Straughn, A. N., Cohen, S. H., Ryan, R. E., Hathi, N. P., Windhorst, R. A., & Jansen, R. A. 2006, ApJ, 639, 724
- (128) Swinbank, A.M., Chapman, S.C., Smail, I., Lindner, C., Borys, C., Blain, A.W., Ivison, R.J., & Lewis, G.F. 2006, MNRAS, 371, 465
- (129) Tacconi, L.J., et al. 2006, ApJ, 640, 228
- (130) Tamm, A., & Tenjes, P. 2006, A&A, 449, 67
- (131) Teplitz, H.I., et al. 2006, AJ, 132, 853
- (132) Toft et al. 2005, ApJ, 624, L9
- (133) Toomre, A. 1977, ARAA, 15, 437
- (134) Tran, K.-V.H., van Dokkum, P., Franx, M., Illingworth, G.D., Kelson, D.D., & Förster Schreiber, N.M. 2005, ApJ, 627, L25
- (135) Treu, T., Ellis, R.S., Liao, T.X., & van Dokkum, P.G. 2005, ApJ, 622, L5
- (136) Trujillo, I., Erwin, P., Ramos, A., & Graham, A. 2004, AJ, 127, 1917
- (137) Trujillo, I., Forster Schreiber, N.M., Rudnick, G., et al. 2006a, ApJ, 650, 18
- (138) Trujillo, I., et al. 2006b, MNRAS, 373, L36
- (139) Trujillo, I., & Pohlen, M. 2005, ApJ, 630, L17
- (140) van den Bergh, S. 1960, ApJ, 131, 215
- (141) van den Bergh, S. 2002, PASP, 114, 797
- (142) van den Bergh, S., Abraham, R.G., Ellis, R.S., Tanvir, N.R.,Santiago, B.X., & Glazebrook, K.G. 1996, AJ 112, 359
- (143) van der Wel, A., Franx, M., van Dokkum, P.G., & Rix, H.-W. 2004, ApJ, 601, L5
- (144) van Dokkum, P.G., et al. 2003, ApJ, 587, L83
- (145) van Dokkum, P.G., et al. 2004, ApJ, 611, 703
- (146) van Dokkum, P.G. 2005, AJ, 130, 2647
- (147) van Dokkum, P., et al. 2006, ApJ, 638, L59
- (148) Volonteri, M., Saracco, P., & Chincarini, G. 2000, A&AS, 145, 111
- (149) Webb, T.M.A., et al. 2006, ApJ, 636, L17
- (150) Williams, R., et al. 1996, AJ, 112, 1335