The Dynamical Distinction between Elliptical and Lenticular Galaxies in Distant Clusters: Further Evidence for the Recent Origin of S0 Galaxies
Abstract
We examine resolved spectroscopic data obtained with the Keck II telescope for 44 spheroidal galaxies in the fields of two rich clusters, Cl0024+16 (=0.40) and MS0451-03 (=0.54), and contrast this with similar data for 23 galaxies within the redshift interval 0.30.65 in the GOODS northern field. For each galaxy we examine the case for systemic rotation, derive central stellar velocity dispersions and photometric ellipticities, . Using morphological classifications obtained via Hubble Space Telescope imaging as the basis, we explore the utility of our kinematic quantities in distinguishing between pressure-supported ellipticals and rotationally-supported lenticulars (S0s). We demonstrate the reliability of using the vs and vs distributions as discriminators, finding that the two criteria correctly identify and 80 of S0s at , respectively, along with and 79 of ellipticals. We test these diagnostics using equivalent local data in the Coma cluster, and find that the diagnostics are similarly accurate at . Our measured accuracies are comparable to the accuracy of visual classification of morphologies, but avoid the band-shifting and surface brightness effects that hinder visual classification at high redshifts. As an example application of our kinematic discriminators, we then examine the morphology-density relation for elliptical and S0 galaxies separately at 0.5. We confirm, from kinematic data alone, the recent growth of rotationally-supported spheroidals. We discuss the feasibility of extending the method to a more comprehensive study of cluster and field galaxies to 1, in order to verify in detail the recent density-dependent growth of S0 galaxies.
Subject headings:
galaxies: clusters: — galaxies: spiral, elliptical, lenticular — galaxies: evolution — galaxies: stellar content1. INTRODUCTION
Understanding the origin of the Hubble sequence remains a fundamental goal in extragalactic astronomy. The lasting utility of Hubble’s classification scheme lies in its ability to distinguish between both the dynamics and stellar populations of disk and spheroidal galaxies. However, despite considerable progress in unraveling the time evolution of elliptical and spiral galaxies (see Ellis 2007 for a recent review), there is still some disagreement concerning the origin of lenticular (or S0) galaxies - a hybrid class with kinematic characteristics of disk galaxies but whose present-day stellar populations resemble those seen in ellipticals (Es). Were S0s created ab initio or do they represent spirals whose gas supply was more recently exhausted? Understanding the origin of this intriguing population is important in resolving the extent to which galaxies are morphologically influenced by their environment.
The idea that infalling cluster spirals have somehow been converted into S0s has received much support because of the presence of a local morphology-density relation (Dressler, 1980) and evidence of its evolution (Dressler et al., 1997; Treu et al., 2003). However, detailed studies of local S0s have failed to resolve the question of whether they are faded remnants of early spirals (c.f. Poggianti et al. 2001 vs. Burstein et al. 2005), or if they instead have similar formation histories to ellipticals, but with different bulge-to-disk ratios. The most direct approach to resolving this debate would be to track directly the evolution in the S0 and elliptical fractions with lookback time, thus tracing the formation histories of the two classes independently.
Considerable progress has been made in tracking the evolving fraction of spheroidals, , as a function of environmental density (Smith et al., 2005; Postman et al., 2005; Capak et al., 2007). Although the morphology-density relation was apparently in place at 1, it has evolved quite substantially at later times, mostly in regions of high projected density. One suggestion is that only ellipticals were present in abundance at z1 (0.1), with subsequent growth in arising primarily via a density-dependent transformation of spirals into S0s (c.f. Smith et al., 2005). This simple hypothesis could be tested by separating S0s from ellipticals, so that their fraction, , could be determined independently of that of ellipticals as a function of both and . If spiral transformations occurred, there should be fewer S0s in all over-dense environments at z1.
Morphologically distinguishing distant S0s from their elliptical counterparts via Hubble Space Telescope (HST) imaging has proved difficult because of surface brightness dimming, loss of resolution, band-shifting and inclination effects, each of which might be redshift-dependent thereby introducing biases. Postman et al. (2005) attempted to measure the S0 fraction morphologically at 1, but the scatter in their S0 classifications, as determined in various ways, implies uncertainties of 0.15. Although they find drops with redshift, the residual fraction at 1 could be 0–30%, consistent with a range of hypotheses. Recently, Desai et al. (2007) have found similarly low S0 fractions for clusters across the range , but uncertainties and cluster to cluster variation remain equivalent to that of Postman et al. (2005).
The purpose of this paper is to explore the use of kinematic data to improve the separation of distant Es and S0s. Luminous ellipticals are pressure-supported whereas S0s have circularly rotating disks. The necessary ingredients to enable this distinction are the rotational velocity , the central stellar velocity dispersion, , and the photometric ellipticity, . The combination of these three quantities has been famously used locally to demonstrate that, for a given , ellipticals have ratios less than that for a rotationally-supported spheroid (Binney, 1982). Tying morphological classifications to physical quantities (pressure, mass and angular momentum) across all epochs should reduce redshift-dependent biases and facilitate comparison to numerical models which incorporate environmental effects (e.g. de Lucia et al., 2006).
As a result of a campaign in two intermediate redshift (0.5) clusters, we have secured Keck spectroscopic data for a large sample of galaxies spanning a wide range of environments. Morphological classifications are available as a training set in these samples. We utilize these data to test the conjecture that a kinematic classifier can be reliably used to isolate S0s from ellipticals at 0.5. After verifying that the classifiers robustly isolate S0s from ellipticals in a local cluster sample, we then use them to determine the S0 fraction as a function of environmental density, , at this epoch. We show this is a promising approach and discuss the prospects for extending it to higher redshift samples so that the S0 fraction might be completely mapped as a function of since 1. Throughout this paper we adopt a standard cosmology with km s-1 Mpc-1, , and .
2. OBSERVATIONS
The primary dataset for this paper is a comprehensive Keck spectroscopic and HST imaging (F814W) survey of morphologically-selected spheroidals in two clusters, Cl0024+16 (=0.40) and MS0451-03 (=0.54) (Treu et al., 2003; Moran et al., 2005). We contrast this with equivalent data taken in the northern GOODS field (Treu et al., 2005a, b). The above cited articles give full details of the morphological selection and spectroscopic campaigns. Here we give a brief synopsis of the salient points.
The cluster data comprises 44 member spheroidals spanning a wide range of cluster-centric radius to rest-frame -19.9, corresponding approximately to the luminosity limit adopted by Dressler et al. (1997) for the local and morphology-density relations. To derive rest-frame absolute magnitudes (), we apply k–corrections to the observed F814W photometry as in (Moran et al., 2007a).
Morphological classification is discussed by Treu et al. (2003) for Cl0024+16 and in Moran et al. (2007b, in preparation) for MS0451-03, and has been deemed reliable to at least . In cases where the distinction between Es and S0s was ambiguous, we assigned the class E/S0. To the adopted magnitude limit, successful morphological distinction between Es and S0s was possible in 95% of cases, with only 5% classed E/S0. The original 22.5 GOODS-N sample was classified in the same visual manner by one of us (RSE), albeit from deeper HST data (Bundy et al., 2005; Treu et al., 2005a, b). For this study, the sample has been restricted to the redshift range 0.30.65 and cut at -19.9 to provide a comparison sample of 23 field spheroidals.
All spectroscopic data were taken with the DEIMOS spectrograph (Faber et al., 2003) on Keck II. The cluster sample was observed with a 900 line grating (Cl0024) or 600 line grating (MS0451) in the 4500–8000 Å region offering a resolution of 30–50 km s-1. Typical exposure times were 2.5 hrs in Cl0024 and 4 hrs in MS0451. The field survey was designed to sample higher redshift spheroidals in the OH forest and a 1200 line grating was used in the 6700–9300 Å region providing a resolution of 20–30 km s-1; exposure times for the brighter objects considered here were typically 4 hrs. In planning the spectroscopic observations, it was not always possible to align the slit along the major axis. We discarded galaxies where the orientational mismatch was greater than 45 degrees, and for those with a smaller misalignment we apply a correction to the measured velocities in our analysis below (§3).
3. KINEMATIC MEASUREMENTS
All spectra were reduced using the DEEP2 pipeline (Davis et al., 2003) using procedures described by Moran et al. (2005) and Treu et al. (2005b). Central stellar velocity dispersions for both field and cluster spheroidals come from these analyses. Comprehensive tests were undertaken to evaluate both instrumental and algorithmic uncertainties, with the results indicating that the dispersions are accurate to .
Resolved (rotational) velocity data was secured via an extension of the cross-correlation technique used to determine velocity dispersions. Our resolved 2D spectra consist of a number of individual spectra, one for each pixel across the spatial dimension of the slit. To ensure reliable measurements, every 2D spectrum was re-binned along the spatial dimension to secure a minimum average signal to noise () of 3 () per bin. Galaxies with less than three spatial bins of sufficient were removed; for our typical seeing of , this defines the minimum extent where a velocity gradient can be resolved.
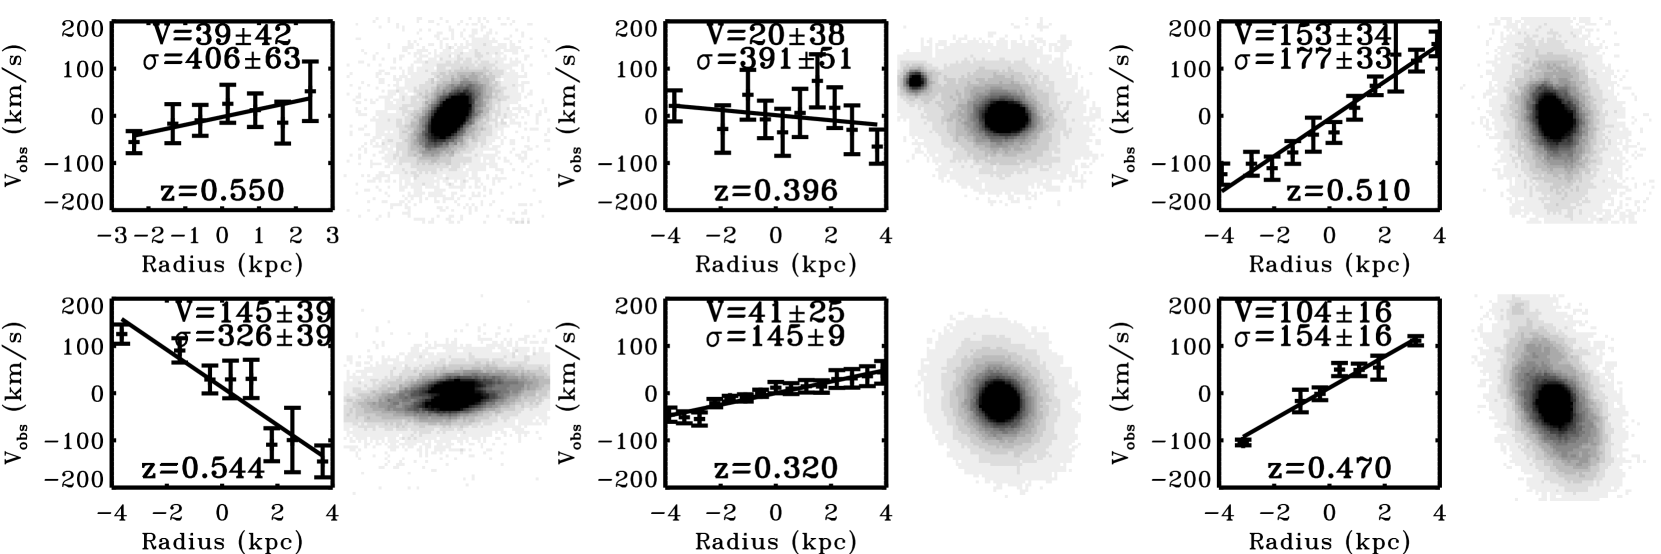
For each of these spatial bins (with one spectrum for each), we independently determine the best-fitting velocity relative to the galaxy’s mean redshift, via a cross-correlation with spectra of eight template G/K stars, shifted to the redshift of the galaxy. The resulting rotation curves were averaged across all eight template fits. We then perform a linear least squares fit to the data points, and define the rotational velocity, , as half the velocity range of the fitted line from end to end of the measured curve. A simple fit is justified because, unlike emission-line data, our absorption line curves rarely extend far enough to reach the characteristic ‘turnover’, , of a disk rotation curve. The uncertainty in was taken to be the larger of the RMS deviation of each data point from the fitted line and the RMS deviation of each velocity measurement across template fits.
The allowed misalignment between the galaxy major axis and the spectroscopic slit can reduce the measured by up to . We make a first-order correction to the measured velocities by dividing by a factor of , where is the angle between the galaxy major axis and the long axis of the spectroscopic slit. Such a correction is generally only valid under the assumption that each galaxy is a thin disk (Kapferer et al., 2006), yet our sample contains both disk and spheroidal galaxies. In practice, however, the magnitude of the correction is negligible for slowly rotating or non-rotating spheroidals, and so only truly-rotating disks will have their measured velocities altered significantly.
Figure 1 displays a sample of images alongside the respective rotation curves. To measure photometric parameters of each galaxy, we make use of the GALFIT software (Peng et al., 2002), fitting each galaxy to a 2D model following the Sérsic profile (see, e.g. Moran et al. 2005). In each model, the Sérsic parameter n, position angle (PA), ellipticity (), and effective radius () are allowed to vary freely, and the each model is convolved with a PSF derived from a star observed in the same HST mosaic. For the analysis discussed below, we adopt the fitted values of and . Typically our measured absorption line rotation curves extend to about . Measured rotation velocities, velocity dispersions, ellipticities and other basic info for all 67 galaxies in our combined cluster and field sample are listed in Table 1.
4. KINEMATIC CLASSIFIERS
In identifying pressure-supported ellipticals from kinematic parameters, we began by considering the distribution originally proposed by Binney (1982), where indicates a rotationally supported spheroid. Unfortunately, our rotation curves do not extend to large enough radius to reliably measure the maximum rotation, . Also, in the case of S0s, the central velocity dispersion arises partly from the prominent spheroidal component, rather than the disk. This mixing of bulge and disk information illuminates a more fundamental problem: since the (Binney, 1982) criterion is meant to measure the degree of rotational support for a single spheroid, it is not a sensible test to apply to a two-component bulge-plus-disk S0. Consequently, we deemed the ratio to be ineffective for our purposes.
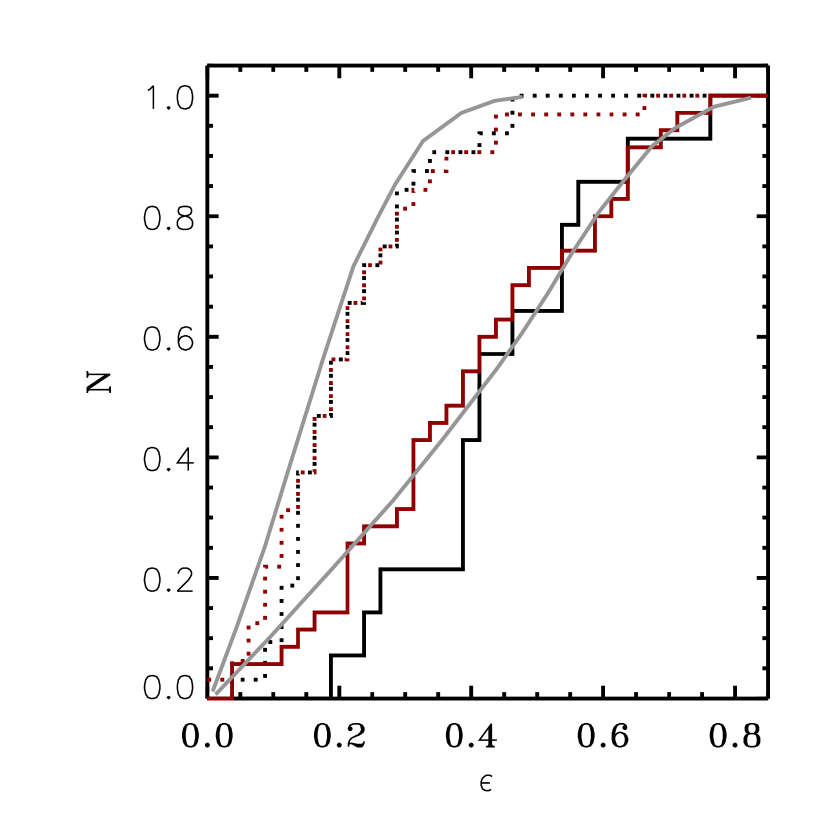
Instead, we approached the problem by minimizing a figure of merit for various classifiers. Here is a proposed kinematic classifier based on some combination of the three key variables, , and , and is the HST-based type, E (T), E/S0 (T) or S0 (T). In order to use the visual morphologies to calibrate our kinematic classifiers in this way, we must ensure that our visual classification is unbiased. In some local samples, a deficit of face-on S0s seems to indicate that many are misidentified as ellipticals (Jørgensen & Franx, 1994). In Figure 2, we display cumulative histograms of ellipticity for Es and S0s in our combined cluster and field sample of 67 sources (in red). It is clear from the figure that the distributions of ellipticities in our sample are consistent with the grey model curves overplotted, which indicate a Gaussian distribution of ellipticities with randomly distributed inclinations. As such, our sample is an appropriately unbiased calibrator for our kinematic classifiers. After minimizing for several candidate indicators, we found that the combinations vs and vs were the most successful, both yielding a higher success rate than the canonical .
The former criterion yields optimal separation of Es and S0s when we classify galaxies with km s-1 as S0s. We note that this choice of kinematic classifier does not strictly require a measurement of , and so can be applied to observations where is unavailable. Overall, the criterion recovers of the 35 S0s and of the 29 Es in our sample (Figure 3, bottom). Given there is inevitably some morphological misclassification at the 10-20% level (Ellis et al., 1997; Treu et al., 2003), this seems an adequate success rate. Specifically, all but two of the morphological S0s below the 85 km s-1 limit display no rotation, i.e. they are consistent with 30 km s-1, and those morphological Es above the limit are mostly rotating with 60-180 km s-1. Of course, the most critical test of this discriminator is not its success rate at identifying individual galaxies, but rather how well it estimates the overall fraction of S0s. Morphologically, our sample contains 43 ellipticals and 52 S0s, with the remaining 5 ambiguous E/S0s; note that we do not yet include any accounting for spiral galaxies. The discriminator yields an S0 fraction of 43, which is consistent within the errors of the visually classified proportion.
We then considered a criterion that exploits as well. While the previous criterion was practical and effective, it was solely concerned with detection of rotation for a given shape. The addition of introduces a measure of pressure support, and thus should be a more robust indicator of the presence of a bulge. Specifically, if we define ellipticals to have 0.50 0.03 and 0.3, a somewhat higher degree of success is revealed: we correctly identify 80 and 79 of S0s and ellipticals, respectively (Figure 3, top). Likewise, the predicted overall fraction of S0s–51–is in excellent agreement with its morphological equivalent.
Naturally, once we calibrate our kinematic classifiers against our sample, it is essential that we validate its performance against an independent set of data. As our goal is to develop a morphological discriminator that is more redshift-invariant than visual classification, it makes sense to choose a comparison sample at a much different redshift. Accordingly, we independently applied both kinematic classifiers to a local sample of 35 Es and S0s in the Coma cluster (Mehlert et al., 2000), supplemented by an additional 11 mostly elliptical galaxies from Bender & Nieto (1990). The distribution of ellipticities of S0s in this sample does appear to suffer from the bias identified by Jørgensen & Franx (1994) (Figure 2). However, since we are not directly calibrating our kinematic indicators on this local comparison sample, the bias in the sample will not prevent us from evaluating the performance of our indicators at low redshift. With our small sample size, we calculate that the bias reflected in Figure 2 implies that only 1–2 additional galaxies with incorrect visual morphologies are present in the sample, which is small compared to other sources of uncertainty.
Importantly, Mehlert et al. published full rotation curves for their galaxies, allowing us to re-measure velocities in a manner similar to that adopted in 3. For each of their galaxies, we fit a straight line to data points within radius , thus simulating the radial extent of our curves. Such a truncated fit generally yields velocities about 40 of the velocity revealed by the full rotation curves of the local galaxies, and we expect that our sample similarly underestimates rotation. Such underestimated velocities may contribute to our misidentification rate, suggesting that deeper observations at may improve the accuracy of our kinematic classification.
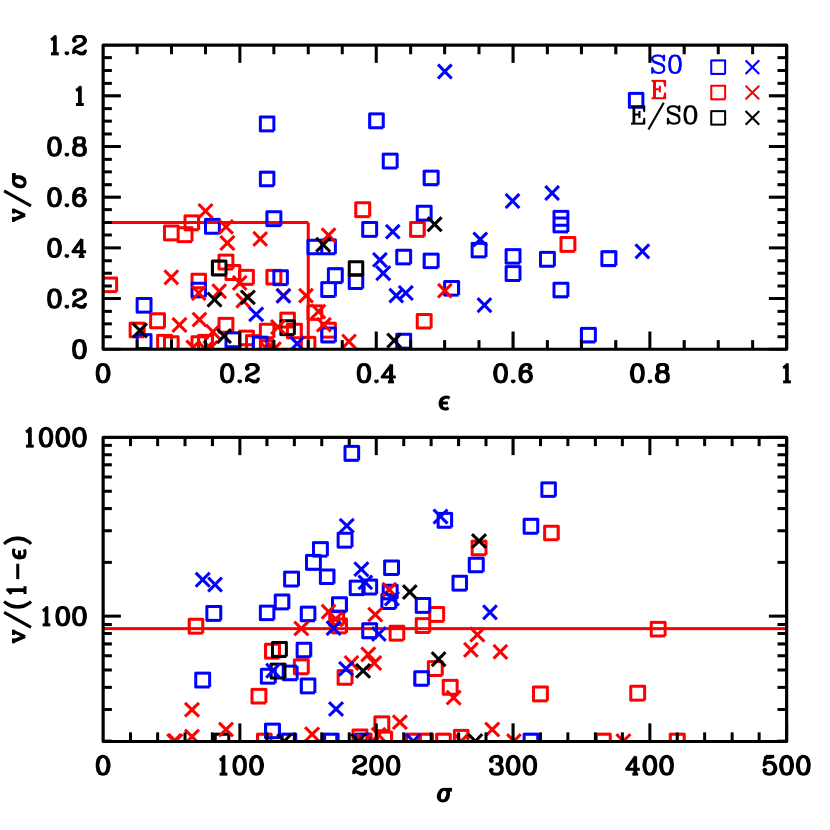
As shown in Figure 3, the recovery is equally successful (65-80% accuracy for individual galaxies) for both kinematic classifiers. They likewise reliably recover the correct morphological mix. The discriminator predicts that the local sample consists of S0s, identical to the visually-determined fraction, while the other discriminator predicts . This demonstrates no obvious redshift dependence in the classification, at least within the errors of the small available samples. In Table 2, we list the success rates achieved for each classifier on both local ans data, as well as the calculated S0 fractions from each method.
| Sample | vs | vs | Visual Class. | |||||
|---|---|---|---|---|---|---|---|---|
| E | S0 | E | S0 | |||||
| z | ||||||||
| z | ||||||||
Note. — For each kinematic discriminator, we list under heading E (S0) the fraction of visually-determined Es (S0s) where the kinematic discriminator yields the same class. Under , we indicate the overall fraction of S0s predicted by applying each kinematic classifier, in comparison to the visually-determined at right.
Locally, it has been shown that a simple cut at effectively identifies of S0s and an even higher fraction of Es (Jørgensen & Franx, 1994), and in our sample the success rate is only slightly worse ( of both Es and S0s). So what, then, have we gained by adding kinematic information to this mix? The advantages are two-fold. First, while may be an accurate predictor of morphology locally, such a relation is known to break down toward higher redshift, where elongated galaxies do not necessarily reflect ordered rotation (Erb et al., 2004). Velocities and dispersions therefore become essential in separating rotating from non-rotating galaxies as we extend our current method of E–S0 discrimination to higher redshift. Being sensitive to the dynamical structure, we can also hope to be less influenced by band-shifting or recent star formation, which could influence the measurement of ellipticity. Second, applying two different kinematic indicators, such as those presented here, adds confidence to the determination of the morphological mix, so long as the two indicators yield consistent measures of the S0 fraction. Overall, then, ellipticity is most usefully combined with measures of rotation and velocity dispersion in order to assess of the morphologies of galaxies, while minimizing redshift-dependent effects.
5. EVOLUTION OF KINEMATICALLY-DEFINED S0S
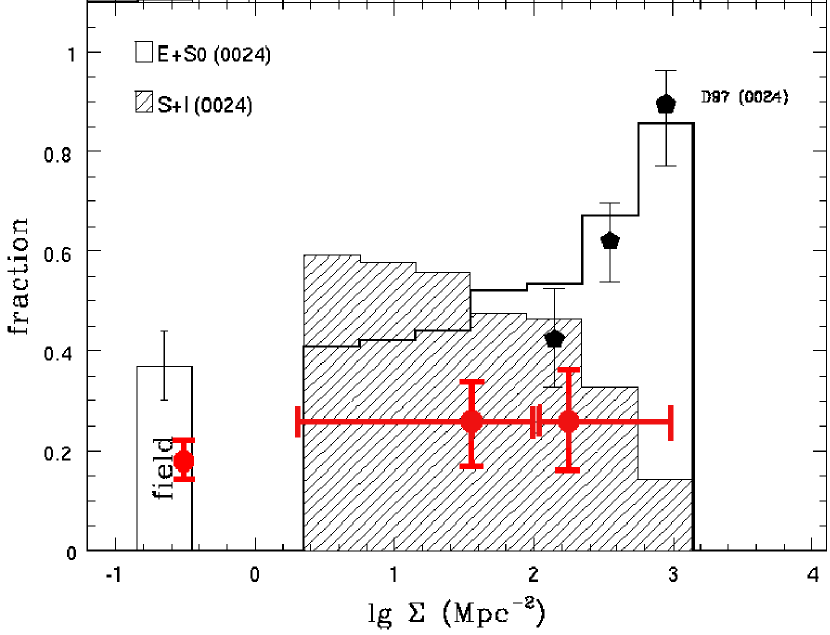
To demonstrate the utility of kinematic information in studying the evolution in the abundance of S0s, we now apply the kinematic classifiers to re-visit the evolving morphology-density relation, tagging each galaxy according to its local environmental density, , as defined in Treu et al. (2003). In constructing the fraction of S0s, , at , we assume we have representatively sampled the available population. To improve statistics in this preliminary comparison, we combine data from both clusters and contrast this with estimates in the field, for which estimates have been determined following the procedures discussed in Treu et al. (2005a). To estimate , we first recalculate the robust visual determination of from Treu et al. (2003) into two density bins across the cluster fields, and also adopt the field value from that paper. We then calculate by counting the number of kinematically-determined ellipticals () and S0s () in each density bin and the field, such that .
Figure 4 illustrates the result. We find a fairly low fraction of S0s (286%) at all cluster densities, except that our sample is not yet sufficiently large to reliably probe the core regions. The local S0 fraction at comparable densities is about =50% (Dressler, 1980) so the kinematic data strongly support earlier contentions (Dressler et al., 1997; Postman et al., 2005) that there is a substantial decline in the S0 fraction in clusters. Interestingly, the fraction in the field is even lower, , although clearly non-zero. Larger samples would confirm these trends.
Recently, van der Marel & van Dokkum (2006) have also considered the utility of resolved kinematic data of distant cluster galaxies. Their analysis is more concerned with establishing the fraction of rotating spheroidals rather than in separating Es and S0s. Based on a much smaller sample, they find a slightly larger fraction of rotating Es than observed locally. We note they use the quantity which we found to be ineffective for reasons discussed earlier.
Given the efficiency of multi-object spectrographs such as DEIMOS, it is interesting to consider the prospects of our method for tracing the full evolutionary history of S0s in various density regimes over 01, for example in order to verify or otherwise the scenario put forward by Smith et al. (2005) and Postman et al. (2005). Visual discrimination between early and late-type galaxies is more reliable than E–S0 separation, even up to (Postman et al., 2005), and so our reliance on the visually-determined poses no barrier to extending this method up to .
The key challenge to extending our method to higher redshift is the loss of spatial resolution that occurs as one observes galaxies at smaller apparent sizes, with a relatively fixed ground-based seeing limit. At , our typical seeing of FWHM corresponds to 4.3 kpc, compared to a 6–8 kpc typical extent of our rotation curves. At , the same seeing disk covers a physical diameter of 5.6 kpc, 30% larger. Considering our requirement to have at least three independent spatial bins, and assuming similar signal to noise spectra, a similar study at may be limited to galaxies with spatial extent kpc; only about 25% of the sample meet this requirement.
In fact, the situation is not so dire, as we are most interested in detecting only whether a galaxy is rotating or not, and so blurring of the velocity gradient due to seeing is only important if the velocity is smeared toward zero. To test our ability to measure rotation curves, we have convolved our curves with a Gaussian kernel to simulate the seeing at . Remeasuring velocities on these blurred curves, we find that our kinematic classification scheme predicts the same morphology as the unblurred curve in 96 of the objects. We thus conclude that kinematic discrimination between Es and S0s can be a powerful tool for tracing the presumed buildup of S0 galaxies even up to , and will provide an additional and more fundamental discriminator at these high redshift.
6. Conclusions
We examine the potential of using resolved kinematics of distant galaxies to separate, independently of morphological data, elliptical and lenticular galaxies. Applying various criteria to a sample of 44 cluster galaxies and 23 field galaxies at 0.5, we find promising prospects. Using the morphological classification as a starting point, we recover the morphological mix to within 10% accuracy using various combinations of the stellar rotational velocity, velocity dispersion and ellipticity. We test the utility of our classifiers on local data and use them to establish the first kinematically-based evidence for a declining fraction of S0s with redshift across a wide range of densities.
References
- Bender & Nieto (1990) Bender, R. & Nieto, J-L. 1990, A& A, 239, 97
- Binney (1982) Binney, J. 1982, ARA& A, 20, 399
- Bundy et al. (2005) Bundy, K., Ellis, R.S. & Conselice, C. 2005, ApJ, 625, 621
- Burstein et al. (2005) Burstein, D., Ho., L., Huchra, J. et al. 2005, ApJ, 621, 246
- Capak et al. (2007) Capak, P. et al. 2007, ApJ, submitted
- Davis et al. (2003) Davis, M., Faber, S. M., Newman, J. et al. 2003, SPIE, 4834, 161
- de Lucia et al. (2006) De Lucia, G., Springer, V., White, S.D.M. et al. 2006, MNRAS, 366, 499
- Desai et al. (2007) Desai, V., Dalcanton, J. J. Aragon-Salamanca, A. et al. 2007, ApJ, in press
- Dressler (1980) Dressler, A., 1980, ApJ, 236, 351
- Dressler et al. (1997) Dressler, A., Oemler, A., Jr., Couch, W. J. et al. 1997, ApJ, 490, 577
- Ellis (2007) Ellis, R.S. in First Light in the Universe, Saas Fee Lectures, (Springer-Verlag) in press
- Ellis et al. (1997) Ellis, R. S., Smail, I., Dressler, A., et al., 1997, ApJ, 483, 582
- Faber et al. (2003) Faber, S. M., Phillips, A.C., Kibrick, R.I. et al. 2003, Proc. SPIE, 4841, 1657
- Jørgensen & Franx (1994) Jorgensen, I. & Franx, M., 1994, ApJ, 433, 553
- Kapferer et al. (2006) Kapferer, W., Kronberger, T., Schindler, S., B hm, A. & Ziegler, B. L. 2006, A& A, 446, 847
- Erb et al. (2004) Erb, D., Steidel, C. C., Shapley, A. E., Pettini, M. & Adelberger, K. L. 2004, ApJ, 612, 122
- Mehlert et al. (2000) Mehlert, D., Saglia, R. P., Bender, R. & Wegner, G. 2000, A& AS, 141, 449
- Moran et al. (2005) Moran, S. M., Ellis, R. S., Treu, T. et al. 2005, ApJ, 634, 977
- Moran et al. (2007a) Moran, S. M., N. Miller, T. Treu, R. S. Ellis & G. P. Smith 2007a, ApJ, 660, (in press)
- Peng et al. (2002) Peng, C. Y., Ho, L., Impey, C. & Rix, H.-W., 2002, AJ, 124, 266
- Poggianti et al. (2001) Poggianti, B. M., Bridges, T., Carter, D. et al. 2001, ApJ, 563, 118
- Postman et al. (2005) Postman, M., Franx, M., Cross, N. et al. 2005, ApJ, 623, 721
- Smith et al. (2005) Smith, G. P., Treu, T., Ellis, R.S. et al. 2005, ApJ, 620, 78
- Treu et al. (2003) Treu, T., Ellis, R.S., Kneib, J-P. et al. 2003 ApJ, 591, 53.
- Treu et al. (2005a) Treu, T., Ellis, R. S., Liao, T.X. et al., 2005a, ApJ, 622, 5
- Treu et al. (2005b) Treu, T., Ellis, R. S., Liao, T.X. et al., 2005b, ApJ, 633, 174
- van der Marel & van Dokkum (2006) van der Marel, R. & van Dokkum, P. 2006, ApJsubmitted (astro-ph/0611571)
| ID | RA | DEC | z | v | Visual | |||
|---|---|---|---|---|---|---|---|---|
| (∘) | (∘) | (km s-1) | ( km s-1) | Morph | ||||
| C1 | 6.682304 | 17.138241 | 0.397 | 0.24 | S0 | 15 | ||
| C2 | 6.726579 | 17.140829 | 0.393 | 0.25 | E | 12 | ||
| C3 | 6.536877 | 17.165190 | 0.397 | 0.39 | S0 | 12 | ||
| C4 | 6.649991 | 17.162821 | 0.391 | 0.05 | E | 26 | ||
| C5 | 6.643103 | 17.172791 | 0.386 | 0.19 | E | 42 | ||
| C6 | 6.782351 | 17.180410 | 0.397 | 0.16 | S0 | 5 | ||
| C7 | 6.631488 | 17.286880 | 0.393 | 0.78 | S0 | 38 | ||
| C8 | 6.514315 | 17.317190 | 0.395 | 0.21 | E | 9 | ||
| C9 | 6.631382 | 17.101040 | 0.398 | 0.17 | E/S0 | 2 | ||
| C10 | 6.640234 | 17.158600 | 0.392 | 0.60 | S0 | 25 | ||
| C11 | 6.660044 | 17.166290 | 0.398 | 0.37 | E/S0 | 4 | ||
| C12 | 6.645772 | 17.172569 | 0.388 | 0.10 | E | 39 | ||
| C13 | 6.630862 | 17.174200 | 0.395 | 0.33 | S0 | 44 | ||
| C14 | 6.630893 | 17.182131 | 0.396 | 0.24 | E | 45 | ||
| C15 | 6.613021 | 17.207199 | 0.398 | 0.08 | E | 3 | ||
| C16 | 6.595411 | 17.208710 | 0.397 | 0.14 | S0 | 20 | ||
| C17 | 6.589549 | 17.236601 | 0.396 | 0.25 | S0 | 35 | ||
| C18 | 6.741905 | 17.266029 | 0.390 | 0.27 | E/S0 | 20 | ||
| C19 | 6.629107 | 17.285839 | 0.396 | 0.55 | S0 | 12 | ||
| C20 | 6.499555 | 17.336269 | 0.395 | 0.60 | S0 | 36 | ||
| C21 | 73.520592 | -3.096000 | 0.510 | 0.40 | S0 | 16 | ||
| C22 | 73.520485 | -3.000458 | 0.542 | 0.18 | E | 6 | ||
| C23 | 73.523880 | -3.011362 | 0.539 | 0.31 | E | 14 | ||
| C24 | 73.552063 | -3.018945 | 0.532 | 0.46 | E | 0 | ||
| C25 | 73.566452 | -3.101381 | 0.550 | 0.47 | E | 30 | ||
| C26 | 73.439285 | -3.137721 | 0.545 | 0.30 | E | 31 | ||
| C27 | 73.442268 | -2.900079 | 0.552 | 0.27 | E | 41 | ||
| C28 | 73.530807 | -3.091694 | 0.546 | 0.65 | S0 | 33 | ||
| C29 | 73.496529 | -2.947528 | 0.548 | 0.22 | E | 1 | ||
| C30 | 73.512939 | -2.932262 | 0.544 | 0.67 | S0 | 30 | ||
| C31 | 73.501221 | -2.982960 | 0.533 | 0.51 | S0 | 25 | ||
| C32 | 73.559761 | -3.025668 | 0.540 | 0.23 | S0 | 6 | ||
| C33 | 73.545235 | -3.014432 | 0.539 | 0.24 | E | 16 | ||
| C34 | 73.540581 | -3.004315 | 0.545 | 0.33 | E | 9 | ||
| C35 | 73.545334 | -3.026837 | 0.535 | 0.33 | S0 | 23 | ||
| C36 | 73.541374 | -3.024953 | 0.539 | 0.44 | S0 | 30 | ||
| C37 | 73.558983 | -2.991541 | 0.532 | 0.10 | E | 26 | ||
| C38 | 73.579918 | -2.990385 | 0.531 | 0.68 | E | 41 | ||
| C39 | 73.601814 | -3.064165 | 0.546 | 0.74 | S0 | 29 | ||
| C40 | 73.600838 | -3.060720 | 0.536 | 0.01 | E | 21 | ||
| C41 | 73.690582 | -3.034126 | 0.543 | 0.38 | E | 33 | ||
| C42 | 73.664803 | -3.084279 | 0.540 | 0.67 | S0 | 27 | ||
| C43 | 73.555710 | -3.012476 | 0.532 | 46 | 0.71 | S0 | 0 | |
| C44 | 73.535393 | -3.009354 | 0.526 | 20 | 0.67 | S0 | 0 | |
| F1 | 189.339612 | 62.226372 | 0.48 | 0.18 | E | 15 | ||
| F2 | 189.374580 | 62.216985 | 0.51 | 0.14 | E | 17 | ||
| F3 | 189.488759 | 62.263352 | 0.46 | 0.15 | E | 40 | ||
| F4 | 189.220348 | 62.245666 | 0.32 | 0.21 | E | 6 | ||
| F5 | 189.200321 | 62.219268 | 0.47 | 0.12 | E | 2 | ||
| F6 | 189.252330 | 62.209726 | 0.56 | 0.09 | E | 27 | ||
| F7 | 189.013560 | 62.186461 | 0.64 | 0.14 | E | 39 | ||
| F8 | 189.073642 | 62.229072 | 0.53 | 0.13 | E | 5 | ||
| F9 | 189.308295 | 62.343580 | 0.53 | 0.28 | E | 19 | ||
| F10 | 189.359264 | 62.229837 | 0.47 | 0.48 | S0 | 2 | ||
| F11 | 189.359027 | 62.234295 | 0.48 | 0.44 | S0 | 2 | ||
| F12 | 189.434130 | 62.232987 | 0.51 | 0.33 | S0 | 32 | ||
| F13 | 189.472041 | 62.248390 | 0.51 | 0.24 | S0 | 22 | ||
| F14 | 189.469027 | 62.247062 | 0.51 | 0.47 | S0 | 1 | ||
| F15 | 189.477354 | 62.257551 | 0.46 | 0.26 | S0 | 25 | ||
| F16 | 189.262189 | 62.239978 | 0.51 | 0.34 | S0 | 11 | ||
| F17 | 189.172782 | 62.234202 | 0.56 | 0.19 | S0 | 13 | ||
| F18 | 189.360790 | 62.287180 | 0.56 | 0.06 | S0 | 11 | ||
| F19 | 189.142570 | 62.242571 | 0.52 | 0.37 | S0 | 5 | ||
| F20 | 189.095001 | 62.216703 | 0.47 | 0.48 | S0 | 16 | ||
| F21 | 189.063660 | 62.206127 | 0.32 | 0.42 | S0 | 40 | ||
| F22 | 189.158314 | 62.291520 | 0.56 | 0.31 | S0 | 45 | ||
| F23 | 189.147118 | 62.186147 | 0.41 | 0.06 | S0 | 12 |
Note. — Galaxy IDs are designated with C for cluster members and F for field galaxies. Velocities are listed uncorrected for slit misalignment. Upper limits on velocities are 1.