Lost and Found: A New Position and Infrared Counterpart for the X-ray Binary Scutum X-111affiliation: This paper includes data gathered with the 6.5 meter Magellan Telescopes located at Las Campanas Observatory, Chile. 22affiliation: Partially based on data obtained at the W. M. Keck Observatory, which is operated as a scientific partnership among the California Institute of Technology, the University of California, and NASA, and was made possible by the generous financial support of the W. M. Keck Foundation.
Abstract
Using archival X-ray data, we find that the catalog location of the X-ray binary Scutum X-1 (Sct X-1) is incorrect, and that the correct location is that of the X-ray source AX J1835280737, which is to the west. Our identification is made on the basis of the 112-s pulse period for this object detected in an XMM-Newton observation, as well as spatial coincidence between AX J1835280737 and previous X-ray observations. Based on the XMM-Newton data and archival RXTE data, we confirm secular spin-down over 17 years with period derivative , but do not detect a previously reported X-ray iron fluorescence line. We identify a bright (), red (), optical and infrared counterpart to AX J1835280737 from 2MASS, a number of mid-IR surveys, and deep optical observations, which we use to constrain the extinction to and distance of Sct X-1. From these data, as well as limited near-IR spectroscopy, we conclude that Sct X-1 is most likely a binary system comprised of a late-type giant or supergiant and a neutron star.
Subject headings:
infrared: stars — pulsars — stars: individual (Sct X-1) — X-rays: binaries1. Introduction
By scanning the Galactic plane with an X-ray payload on a sounding rocket, Hill et al. (1974) discovered an unusual X-ray source in the constellation Scutum, which they named Scutum X-1 (catalog X Sct X-1) (hereafter Sct X-1). Sct X-1 was subsequently detected using X-ray instruments on the Copernicus, Ariel V, HEAO 1, and Ginga satellites (Charles, Mason, & Davison 1975; Marshall et al. 1979; Reid et al. 1980; Cooke et al. 1984; Koyama et al. 1991; Yamauchi & Koyama 1993); in contrast, it was not detected, at least unambiguously, in surveys done using the Uhuru and EXOSAT satellites (Forman et al., 1978; Warwick et al., 1988, Fourth Uhuru Catalog). In summary, these observations determined that (i) the X-ray flux varies over a range as wide as mCrab to 20 mCrab, and this variability occurs on a variety of timescales (Charles et al., 1975; Marshall et al., 1979; Reid et al., 1980; Cooke et al., 1984; Warwick et al., 1988; Koyama et al., 1991; Yamauchi & Koyama, 1993); (ii) the emission has a hard spectrum with a significant low-energy cutoff that implies an interstellar absorption column density of ; (iii) the source is an X-ray pulsar with a 111-s pulsation period (Makino, 1988); and (iv) the X-ray spectrum may show line emission at 6.4 keV, presumably from iron K fluorescence (Koyama et al., 1991). Based on its similarity to other sources at the same Galactic longitude, Koyama et al. (1990) concluded that Sct X-1 is likely an X-ray binary in the Scutum arm of the Galaxy at about 10 kpc distance.
The most accurate information on the celestial location of Sct X-1 comes from Reid et al. (1980), who presented positions of X-ray sources measured with the modulation collimator (MC) on the HEAO 1 satellite (HEAO 1 A3). They derived a grid of diamond-shaped error boxes, but concluded that only two of the diamonds were consistent with earlier observations (Hill et al., 1974; Charles et al., 1975; Marshall et al., 1979), viz., those centered at , and , (both B1950; the corresponding J2000 positions are , and , ). Each error diamond was approximately in Right Ascension by in Declination.
In this paper we present the results of our analysis of archival X-ray observations of Sct X-1 with ASCA, XMM-Newton, and RXTE111After submission of this manuscript, we were made aware of a similar analysis performed by another group (see Helfand et al. 2004 and http://www.astro.columbia.edu/{-0.7ex}{$~{ }$}}jules/axj1835.4-0737/). Their conclusions are largely the same as our own.. We find that the source is not in either of the two error boxes chosen by Reid et al. (1980), but is instead in the next box to the west. The presence of a 112-s period pulsation (having evolved from the 111-s period that was found previously) and the coincidence in position with one of the HEAO 1 error boxes make us confident of our identification. We describe the X-ray analysis in § 2, and identify a near-IR counterpart from the Two-Micron All-Sky Survey (2MASS; Skrutskie et al. 2006) and mid-IR surveys in § 3. Finally, we give our discussion in § 4 and conclusions in § 5.
2. Archival X-ray Data Analysis
We found that the X-ray source AX J1835280737 (catalog AX J1834.4-0737), discovered by Sugizaki et al. (2001) in their survey of the Galactic plane with ASCA (this specific observation is from 1997 October 13), was close to but not consistent with the published positions of Sct X-1 (Reid et al., 1980). However, there were too few counts in the ASCA data to perform a reasonably sensitive search for periodicities and thereby uniquely identify AX J1835280737: Sugizaki et al. (2001) measured a 0.7–7 keV count rate of in an observation with 4 ksec of good exposure, so there are only counts (summed over the two GIS detectors).
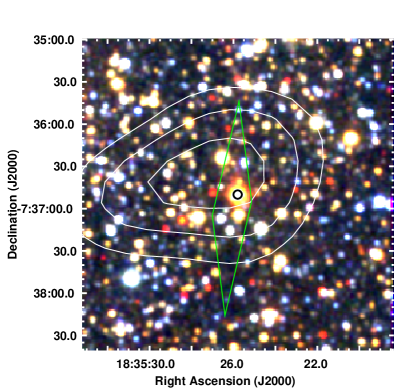
A 17-ks XMM-Newton observation of AX J1835280737 (observation 0203850201) was performed on 2004 September 18/MJD 53266.26. There is one bright source detected in the EPIC-pn and EPIC-MOS images (the source is not detected in the RGS data). This source, which is located at (J2000) , with statistical position uncertainties of (and absolute uncertainties of ), is fully consistent with the position of AX J1835280737 (see Fig. 1). It has a background-subtracted EPIC-pn count rate of in the 0.5–8 keV band, and is consistent with a point source given the angular resolution of XMM-Newton. Figure 1 also shows that the positions of AX J1835280737 determined from both the ASCA and XMM-Newton observations are fully consistent with one of the error boxes of Sct X-1 that was derived from the much earlier HEAO 1 observations although it does not happen to be one of the two error boxes selected as prime candidates for the source location by Reid et al. (1980).
| ObsID | Epoch | Exposure | Trans.aaAverage collimator transmission of Sct X-1. | CRbbMean count rate including background. | Ampl.ccAmplitude of fitted sinusoid. | Signif.ddSignificance of period detection, in units of . |
|---|---|---|---|---|---|---|
| (MJD) | (sec) | (%) | (s-1) | (s-1) | ||
| 20143-08-01-00 | 50619.835381(14) | 10361 | 74 | 81.98 | 9.5(2) | 222 |
| 20143-08-01-01 | 50620.757608(13) | 11579 | 74 | 82.55 | 7.5(2) | 259 |
| 20142-02-01-00 | 50688.532073(30) | 7840 | 68 | 59.44 | 1.6(2) | 46 |
| 20142-02-03-00 | 50765.147085(46) | 8148 | 70 | 71.82 | 0.7(2) | 19 |
2.1. Timing Analysis
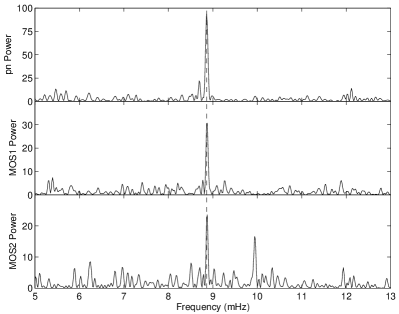
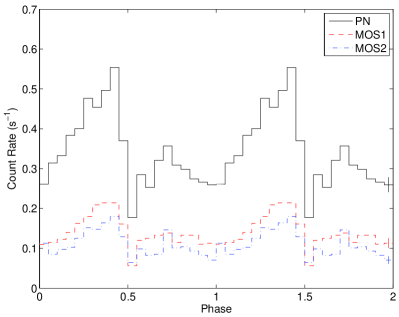
To see whether or not this source is Sct X-1, we searched for evidence of the 111-s period detected by Makino (1988) and Koyama et al. (1991). We extracted events (using XMMSAS release 20050815) from the pn and MOS data with PATTERN (singles and doubles) and energies between 2 and 8 keV within a radius of 500 pixels (). We barycentered the event arrival times and constructed power spectra (Buccheri et al., 1983). Searching the power spectrum of the EPIC-pn data for periods from 75–210 s (all much longer than the frame time of 73 ms), we find a very significant peak ( amplitude of 93.6, which gives a probability of in a single trial) at mHz ( s; see Fig. 2), and the power spectra made from the MOS data also have peaks at s (MOS1) and s (MOS2), where the uncertainties have been calculated according to Ransom (2001). There is a small peak at a power of 22 in the EPIC-pn power spectrum, but this is likely a sidelobe of the main peak. No other strong peaks were found in the EPIC-pn or MOS1 spectra, while in the MOS2 spectrum there is a peak at a period of 100.6 s which reaches a power about that of the peak at s. However, given the much lower amplitude of the main MOS2 peak (23.6, compared to 93.6 for the pn) the secondary peak is not very strong overall (single trial probability of ). Based on this, we conclude that a s pulse period was detected, and that the 100.6 s period is likely either a noise spike or an instrumental effect in the MOS2 data. Folding the data on the 112-s period, we see (Fig. 3) strong, asymmetric pulsations with a pronounced interpulse, not unlike the pulse profiles shown in Koyama et al. (1991). The pn data have an rms pulsed fraction of 29%.
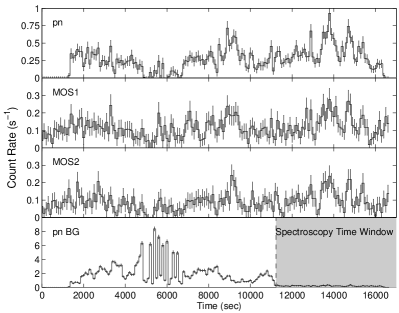
To examine the variability of the X-ray source during the XMM-Newton exposure and to search for background flares, we binned the EPIC event data in 200-s bins to construct lightcurves, which we show in Figure 4. In all three EPIC detectors the background is high with episodes of strong flaring for the first of the observation. This flaring is likely responsible (through telemetry saturation) for the dips in the source lightcurves at s, as the unfiltered EPIC-pn count rate exceeds the limit of and therefore the cameras entered “counting mode”222See http://xmm.vilspa.esa.es/external/xmm_user_support/documentation/uhb/node95.html. (note that excluding the saturated regions has no effect on the period determination). However, even away from the times of strong flaring in the background, the source strength appears to vary by a factor of ; see the small increases near 9000 s and especially the variations in count rate after the background dies out near 11000 s. These variations are similar to those seen by Koyama et al. (1991). We also find that the spectral hardness stays relatively constant while the overall count rate varies.
| MJD | Instrument | Period |
|---|---|---|
| (UT) | (sec) | |
| 47479.6 | Ginga/LAC | 111.001(4) |
| 48142.7 | Ginga/LAC | 111.194(3) |
| 50619.8 | RXTE/PCA | 112.23(4) |
| 50620.8 | RXTE/PCA | 112.22(4) |
| 50688.5 | RXTE/PCA | 112.28(6) |
| 50765.1 | RXTE/PCA | 112.37(7) |
| 53266.4 | XMM-Newton/EPIC-pn | 112.86(8) |
| 53266.4 | XMM-Newton/EPIC-MOS1 | 112.69(16) |
| 53266.4 | XMM-Newton/EPIC-MOS2 | 112.69(19) |
Note. — Quantities in parentheses are 1 uncertainties on the last digit. Ginga/LAC data are rom Yamauchi & Koyama (1993).
Sct X-1 has also been observed on a few occasions by the Rossi X-ray Timing Explorer (RXTE) satellite. We have analyzed portions of the observations in which the Proportional Counter Array (PCA) was steadily pointed at the target location; other portions of the observations included short pointed observations or scans over regions around the target location in vain attempts to precisely determine the position of the source. The longer pointed observations comprise data from two observations in 1997 June, one in 1997 August, and one in 1997 November, and have exposure times ranging from 4 to 12 ks (see Tab. 1). Data from all 5 proportional counter units (PCUs) in the energy range 4–10 keV were binned into 1 s time bins. The resulting light curves were fit with a sinusoid plus 3 harmonics over trial periods between 110 and 115 s. In all the observations a clear dip in is seen near 112.3 s, although the amplitude of the fitted sinusoid varied over a wide range. For each of the four observations, the error on the period was determined from the range of trial periods with where was the full range of variation of found in a comparable region of period space with no signal. We list the final period measurements in Table 2.
2.2. Spectral Analysis
| Parameter | Fit TypeaaFit types are absorbed power-law with (PL+Fe) and without (PL) an iron line at 6.4 keV and thermal bremsstrahlung (TB). In the first PL+Fe fit, the PL parameters are held fixed at the best-fit values from the PL fit. | |||
|---|---|---|---|---|
| PL | TB | PL+Fe | PL+Fe | |
| () | 8.1(6) | 7.8(5) | 8.1 | 8.1(6) |
| / (keV) | 1.48(13) | 1.48 | 1.49(14) | |
| NormbbEither power-law normalization, in units of at 1 keV, or thermal bremsstrahlung normalization, in units of , where is the distance to the source, and are the electron and ion number densities, and the integral is over the source volume (based on the XSpec bremss model). | 1.6(3) | 2.19(8) | 1.6 | 1.6(4) |
| EWFe (eV)ccEquivalent width of a putative unresolved Fe line at 6.4 keV. | 20(38) | 23(40) | ||
| DOF | 84.5/118 | 83.6/118 | 84.2/120 | 84.2/117 |
| ddModel flux in the 0.5–10 keV band, corrected for absorption. | 1.2 | 1.2 | 1.3 | 1.3 |
Note. — Quantities in parentheses on the fit parameters (excluding the flux) are 1 uncertainties in the last digit; quantities without uncertainties were held fixed for the fit.
We fit spectra to the EPIC data. After filtering for single and double events (as above), we excised the data taken when the background was high, i.e., prior to 11 ks from the start of the observation (Fig. 4) and were left with exposure times of 4.5, 5.3, and 5.3 ksec for the EPIC-pn, MOS1, and MOS2 respectively, out of initial exposures of 16 ksec for pn and 17 ksec for the MOSs.
We extracted source events from the same 500-pixel radii regions that we used for timing. For the background, we selected pn events from a circle 2500 pixels () in radius located near but not containing AX J1835280737, as the source was close to a CCD boundary and we could not define a proper background annulus that would be on the same CCD. For the MOS data, where AX J1835280737 was located in the middle of a CCD, we used a background annulus extending from 500 to 5000 pixels () in radius. We binned the data so that each bin has counts, and then we generated ancillary response files (ARFs) and redistribution matrix files (RMFs) for each instrument and fit the data in Sherpa333Part of the Chandra Interactive Analysis of Observations (CIAO), http://cxc.harvard.edu/ciao/.
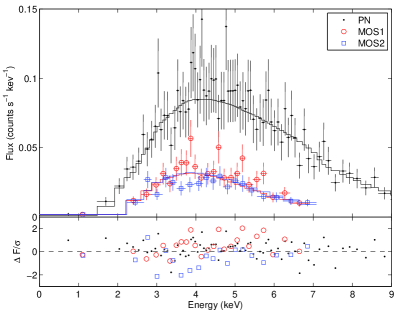
The data from all three instruments are jointly well-fit by an absorbed power-law; we give basic fit parameters in Table 3 and show the fit in Figure 5. Attenuation factors were calculated using the phabs model (which uses cross sections from Balucinska-Church & McCammon 1992 and solar abundances). The quality of the fit is good, as indicated by a low reduced (0.7), and the residuals do not show any significant systematic deviations. The data could also be fit with a very hot ( keV) thermal bremsstrahlung model, but the implied absorption was quite similar and at these temperatures the thermal model is essentially a power-law444More complicated models of thermal X-ray emission from optically thin hot plasmas, such as those of Raymond & Smith (1977), give similar results if the abundances of metals are low..
Interestingly, Koyama et al. (1991) found evidence in the spectrum of Sct X-1 for an iron emission line at 6.4 keV with an equivalent width of 0.2–0.3 keV. While not required to achieve a good fit to our data, we examined whether the addition of such a line to the spectral model would improve the fit. To test this, we fit the EPIC data with two models: the power-law model frozen to its best-fit values with the addition of a line at 6.4 keV (third column in Tab. 3), and an absorbed power-law plus iron line where all parameters are free (fourth column in Tab. 3). The iron line was assumed to be unresolved for both fits. In neither case did the addition of the iron line improve the fit significantly. There was a small reduction in from 84.5 to 84.2, but this is not significant. The best-fit values of the power-law parameters in the fourth fit did not change appreciably from those in the first fit. Overall, we find no evidence for a line at 6.4 keV, and can set a 90%-confidence upper limit to the equivalent width of 96 eV. This is formally inconsistent with the results of Koyama et al. (1991). They discussed the difficulty in properly subtracting the strong Galactic ridge emission, and this could be the cause of the discrepancy, although the source could also be variable as we discuss below.
3. Optical/Infrared Counterpart
3.1. Archival Data
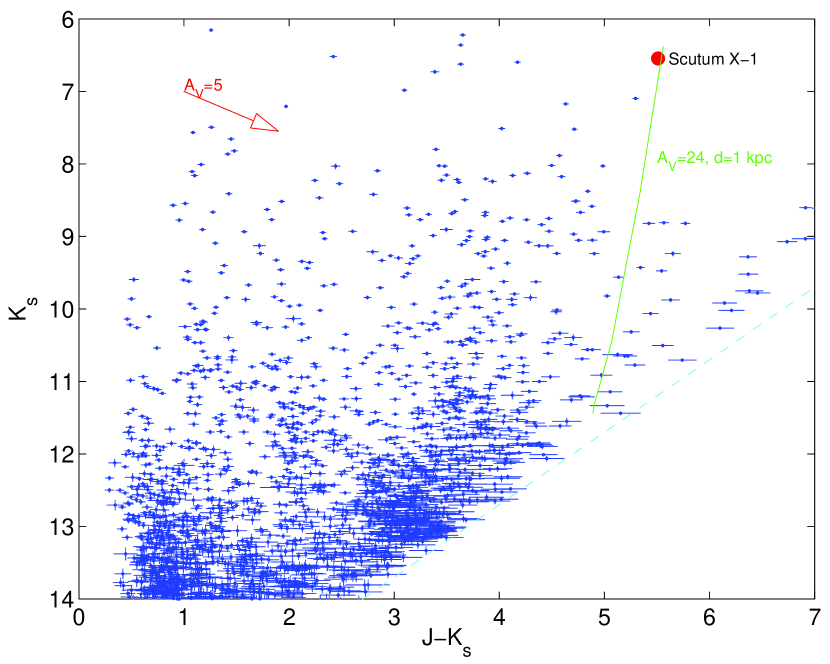
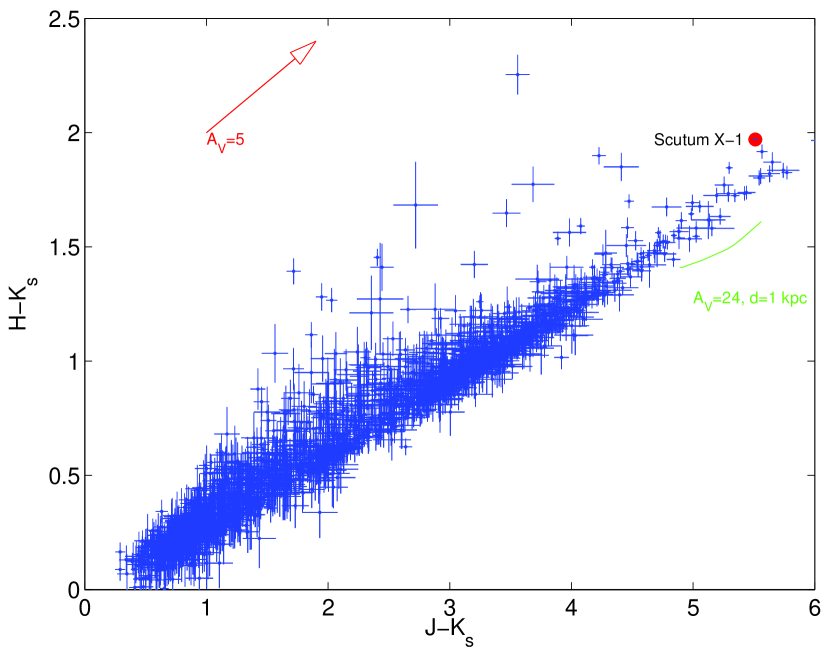
We found a potential IR counterpart to AX J1835280737 in the 2MASS Point Source Catalog: 2MASS J183525820736501, which is away from the XMM-Newton source (see Fig. 1). This object is rather bright and red, with , and . It is among the brightest of the sources in the 2MASS color-magnitude diagram of stars within (Fig. 6), and is considerably redder than most sources of similar magnitudes. Just on the basis of the magnitude, the association with Sct X-1 is very probable, as we find sources in this region with per square arcsecond, so the chance for a random alignment within is a negligible .
We also find 2MASS J183525820736501 in other near- and mid-infrared catalogs: the Deep Near Infrared Survey of the Southern Sky (DENIS; Epchtein et al. 1999) database, the Spitzer Space Telescope Galactic Legacy Infrared Mid-Plane Survey Extraordinaire (GLIMPSE; Benjamin et al., 2003) data-base, the Midcourse Space Experiment (MSX; Price et al., 2001)555See http://irsa.ipac.caltech.edu/Missions/msx.html. Point Source Catalog (MSX6C; Egan et al. 2003), and the IRAS Point Source Catalog (PSC). We summarize all of the infrared data on 2MASS J183525820736501 in Table 4.
In DENIS, the source is DENIS J183525.8073650, and it is detected with , , but is not detected in -band (where the limiting magnitude is ). These magnitudes are slightly different from the 2MASS values, even allowing for color transformations (Carpenter, 2001), but we note that the -band measurement is near the DENIS saturation limit.
In the GLIMPSE Archive (which is more complete but less reliable than
the GLIMPSE Catalog), it is listed as SSTGLMA G024.3361+00.0657, with
fluxes of , , , and
Jy at 3.6, 4.5, 5.8, and 8.0 m, respectively. The
variation of the fluxes as a function of wavelength is puzzling, since
a star would generally have monotonically decreasing values. This is
likely due to non-linearity/partial saturation of this source, and
indeed we note that SSTGLMA G024.3361+00.0657 is not included in the
GLIMPSE Catalog, the data-quality flag indicates that no non-linearity
correction was applied (bit 19), and the fluxes are above the nominal,
albeit conservative666See the GLIMPSE Data Products Document
at
http://data.spitzer.caltech.edu/popular/glimpse/20050415_enhanced_v1/Documents/glimpse_dataprod_v1.5.pdf.,
saturation limits of 0.44, 0.45, 2.9, and 1.6 Jy in all bands; the
radial profiles in the 3.6- and 4.5-m images also show effects of
saturation. Finally, in MSX6C, it is source MSX6C G024.3359+00.0656,
and in the IRAS PSC it is IRAS 183270739.
| Catalog/ | Band | Wavelength | Flux |
|---|---|---|---|
| Instrument | (m) | (Jy) | |
| MagIC | 0.6 | ||
| 0.8 | |||
| DENIS | 1.2 | 0.030(2) | |
| 2.2 | 2.0(2) | ||
| 2MASS | 1.2 | 0.024(1) | |
| 1.7 | 0.40(1) | ||
| 2.2 | 1.60(4) | ||
| GLIMPSE | 3.6 | 3.49(13) | |
| 4.5 | 2.61(10) | ||
| 5.8 | 4.17(12) | ||
| 8.0 | 3.42(20) | ||
| MSX6C | A | 8.3 | 5.1 |
| C | 12.1 | 7.8 | |
| D | 14.7 | 6.5 | |
| E | 21.3 | 3.9 | |
| IRAS | 12 | 10.3 |
Note. — Values in parentheses are 1 statistical uncertainties on the last digits, if available, but note that the GLIMPSE data, especially from the 3.6- and 4.5-m bands, are likely somewhat saturated. See § 3 for additional discussion.
3.2. Optical Photometry
We performed photometric observations of Sct X-1 on 2006 August 28 with the Magellan Instant Camera (MagIC) at an f/11 Nasmyth focus of the 6.5 m Baade (Magellan I) telescope at Las Campanas Observatory in Chile. MagIC is a 20482048 SITe CCD with a 0069 pixel-1 plate scale and a 142″ field of view. Exposures of 1830 s in the filter and 3630 s in the filter were obtained. The conditions were near-photometric, with seeing in and seeing in . We reduced the data according to standard procedures in IRAF by subtracting overscan regions, merging the data from four amplifiers, and flatfielding the data with twilight flats. We astrometrically calibrated the data by measuring the positions of 50 2MASS stars and fitting for the transformation using ccmap: the fit was characterized by an rms error of in each coordinate.
For purposes of photometry, we performed five 3-s observations of the L110-232 standard field (Landolt, 1992; Stetson, 2000) in each filter. We transformed the tabulated Kron-Cousins and magnitudes for 12 of the stars in that field using the results of Fukugita et al. (1996) to and magnitudes and determined zeropoints for the observations. These zeropoints agreed with the nominal values for MagIC777See http://occult.mit.edu/instrumentation/magic/#rpt_txt. to within our precision ( mag).
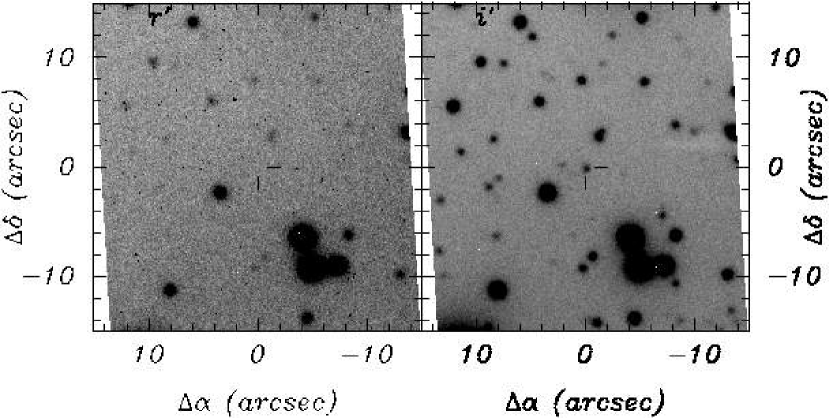
As seen in Figure 7, we detect an object at the position of 2MASS J183525820736501 in the image but not in the image. We estimate that the object has (3 limit) and , and we give the corresponding -band flux in Table 4. The photometry is consistent with the non-detection of 2MASS J183525820736501 in the DENIS -band.
3.3. Near-IR Spectroscopy
To help determine the spectral type of the counterpart to Sct X-1, we undertook some limited near-IR spectroscopy. The spectra were obtained with the near-IR spectrograph NIRSPEC (McLean et al., 1998) on the Keck II telescope in low-resolution () mode and reduced using the standard procedures described by Erb et al. (2003). The observations consisted of s exposures in the -band (using the NIRSPEC-6 filter), and s exposures in the -band (using the NIRSPEC-5 filter), on the night of 2006 October 3. The resolution was Å in -band and Å in -band. We could not obtain standard star data from the same night as the observations, but we did rough flux calibrations of the -band data using an observation from 2004 September of the A0V star HD 40335 and of the -band data using an observation from 2006 June of the A2V star HD 201941. There were variable clouds during the observations, and the calibration data are not of the highest quality. Therefore the absolute flux scale is uncertain to about a factor of 2, and some smaller-scale deviations in the continuum level are also present due to imperfect correction for atmospheric transmission.
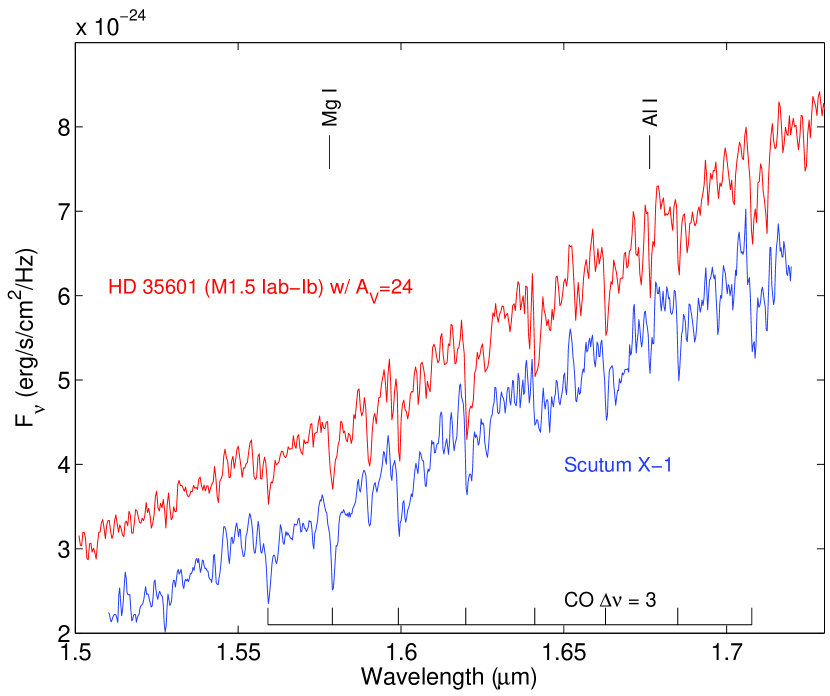
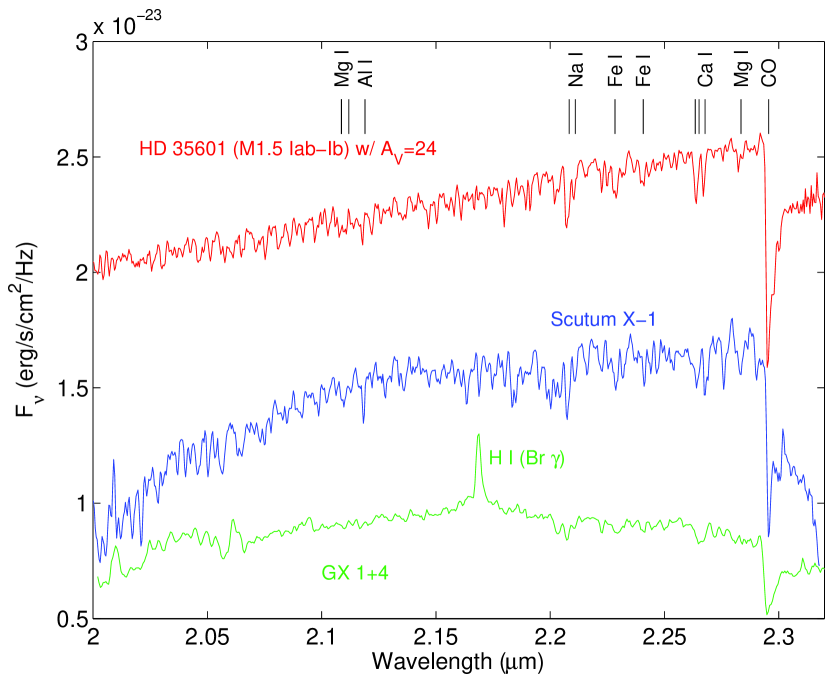
We show the spectra in Figure 8. We can immediately say that there are no strong emission lines such as one might expect from the stellar wind in an X-ray binary. Moreover, we do not see strong H I Paschen or Brackett series absorption that would indicate an early-type star — the type of star that is most commonly associated with X-ray binaries of this pulse period (e.g., Bildsten et al. 1997; Corbet et al. 1999). Instead, we see strong CO absorption and lines from a number of metals. Comparing the lines that we identify with the sequences presented in Wallace & Hinkle (1997), Meyer et al. (1998), and Rayner et al. (2006, in prep.888See http://irtfweb.ifa.hawaii.edu/{-0.7ex}{$~{ }$}}spex/spexlibrary/IRTFlibrary.html.), we find the closest match is with late-K to early-M stars. Given the poor flux calibration we were not able to make a quantitative classification, but the identification of the strong CO bands as well as absorption from neutral metals seems secure; in particular, the comparable strength of the Na I doublet and the Ca I triplet along with the presence of Al I in the -band data seem to indicate that the type is not too late. We have not attempted to determine the luminosity class of Sct X-1, as the detailed measurements necessary for that are beyond the tolerance of our calibration, although the strength of the CO bands argues for luminosity class I–III (see Meyer et al. 1998).
For comparison, in Figure 8 we also plot the spectrum of the M1.5 Iab–Ib star HD 35601 (taken from Rayner et al. 2006), reddened with (see § 4.3). A visual inspection shows that our choice of comparison star is reasonable. In the -band the match is particularly good, with the overall slope also agreeing. This then tells us that , and although we have not corrected for any intrinsic reddening of the comparison star, the intrinsic reddening should only be mag based on its membership in the Aur OB1 association (see Levesque et al. 2005). In the -band the match is not as good, with some curvature present in the NIRSPEC data from poor calibration, but the absorption features and the overall depth of the CO bands agree reasonably well. It is possible, though, that the continuum shape in the -band is a result of water absorption in a very late M (later than M7 or so) star rather than poor calibration (see Cushing, Rayner, & Vacca 2005).
4. Discussion
The detection of pulsations at approximately the same period as that found by Koyama et al. (1991), along with the position coincidence between AX J1835280737 and an alternate HEAO 1 diamond (Fig. 1; it is also more or less consistent with the other X-ray positions), secures the identification of AX J1835280737 with Sct X-1. We now discuss the implications of our measurements in more detail.
4.1. Spin-Period Evolution
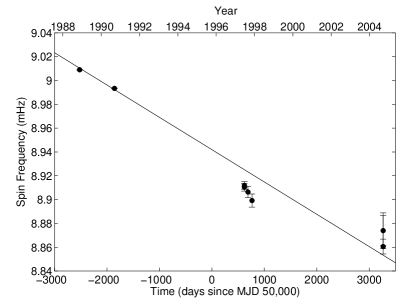
Comparing the spin periods that we measure here to the values measured by Yamauchi & Koyama (1993) with the Ginga satellite (Table 2), we see evidence for secular spin-down over 17 years. Yamauchi & Koyama (1993) inferred a spin-down rate of , although this was only based on two measurements and could not account for possible torque variations or periodic (i.e. orbital) changes. Our period measurement fits this trend reasonably well (Fig. 9): a weighted fit (which is dominated by the Ginga measurements) gives (). So it appears that the spin-down has largely been steady, averaged over 17 years, although there certainly could have been some small-scale torque variations visible in the departure of the RXTE period measurements from the long-term trend. This excludes the possibility that the period change in Sct X-1 was due to orbital motion as considered by Yamauchi & Koyama (1993), as no companion can produce a Doppler shift of 2 s over 17 yrs, and instead suggests that the spin-down is due to external torques. Overall, this scenario agrees with the conclusion of Yamauchi & Koyama (1993) that the compact object in Sct X-1 is a neutron star rather than a white dwarf (cf. Lopes de Oliveira et al. 2006), which would need a much larger torque than those that have been observed to produce the measured .
4.2. X-ray Spectrum
Even if we ignore the presence or absence of the Fe line, our best-fit spectral parameters are not the same as those estimated by Koyama et al. (1991), who found a slightly softer power-law ( vs. here) and more absorption ( vs. here). In fact, most of the X-ray observations to date (which have not been of the same quality as the XMM-Newton observation) have inferred column densities above . While this could just be an effect of instrumental cross-calibration and inconsistent fitting techniques, the difference is quite large. This could be due to variations in absorption by matter associated with the Sct X-1 system over the yrs between the observations (see Yamauchi & Koyama 1993); in particular, variations in are often associated with absorption from a variable stellar wind (e.g., White & Swank, 1984; Chakrabarty & Roche, 1997), and a decrease in can even be correlated with a decrease in the Fe equivalent width. Overall, the flux has decreased by about a factor of 4 from the Ginga observations to the XMM-Newton observations (we find a flux of mCrab), and the variability of the pulsed amplitude during the RXTE observations over the course of several months (Tab. 1) may be as much as a factor of 10. The unabsorbed flux in the XMM-Newton observations implies a luminosity in the 0.5–10 keV band, where the distance to Sct X-1 is kiloparsecs.
4.3. Optical/IR Counterpart: Constraints on Extinction and Distance
The very red colors of 2MASS J183525820736501 imply a large extinction, as no stars have intrinsic colors nearly that red. The reddest main-sequence star listed in Cox (2000) has (M5V), while the reddest giant star has (M5III). If we assume intrinsic colors of for 2MASS J183525820736501 and that the emission we see is photospheric (no excess from a disk or wind), this then implies (hence the giant track shown in Figure 6). Such extinction makes 2MASS J183525820736501 very faint in the optical, which is consistent with our measured magnitude and with the upper limits at and in other bluer bands. This extinction agrees with the slope of the -band continuum, although given our calibration uncertainties that is not a strong statement. The X-ray absorption implied by this extinction, using the relation of Predehl & Schmitt (1995), is , which is consistent with our spectroscopic result.
The Galactic extinction model of Drimmel, Cabrera-Lavers, & López-Corredoira (2003) predicts that at 7.5 kpc, and at 10 kpc, although at these distances and extinctions, the model is not very well constrained. So based on extinction alone, and assuming that the extinction is extrinsic to the sources, we would estimate a distance of kpc for Sct X-1, which is consistent with the assertion of Koyama et al. (1990), that Sct X-1 is likely in a spiral arm at kpc.
However, while we know that 2MASS J183525820736501 is heavily reddened, with the limited data that we have it is difficult to determine its intrinsic colors and stellar type with any precision. A rough fit to the photometry (and the upper limit) is reasonably consistent with a late-type star at . This inference is consistent with what we deduce from the near-IR spectroscopy. In general, for a given stellar type the distance to 2MASS J183525820736501 is
where , , and and are the color and absolute magnitude of the star, which we take from Cox (2000). We determine by
where we observe , is the intrinsic color of the star, and . If we take 2MASS J183525820736501 to be a late-type supergiant, we have (for M0I) , , and , so we find a distance of kpc. This is slightly smaller than that implied by the extinction, but gives a reasonable X-ray luminosity of .
4.4. Comparison with GX 1+4
Given its infrared and X-ray characteristics, Sct X-1 resembles the 2-minute X-ray pulsar GX 1+4, which is a symbiotic system with an M-giant mass donor (Davidsen, Malina, & Bowyer 1977; Chakrabarty & Roche 1997; Chakrabarty, van Kerkwijk, & Larkin 1998). GX 1+4 generally is quite similar to Sct X-1: it has a similar spin-period and showed a prolonged period of relatively faint (–2 mCrab) emission with steady spin-down (Chakrabarty et al., 1997), although it had previous bright periods associated with spin-up. We note, though, that we did not see the strong H I emission lines one would expect from a symbiotic star (Fig. 8), but this may be a result of variability or viewing geometry (see, e.g., Masetti et al. 2006). We also note that GX 1+4 appears somewhat less luminous in the near-IR: GX 1+4 has with , which imply or (Hinkle et al., 2006). If the Sct X-1 system contains a star like this it would only be 500 pc distant; the observed extinction in the optical/near-IR and low energy X-ray absorption would be hard to explain, and the X-ray luminosity would be very low.
5. Conclusions
It is possible that Sct X-1 is a nearby low-mass X-ray binary with an evolved giant companion. This would then imply a low X-ray luminosity — comparable to those implied by Masetti et al. (2006) — and that the X-ray and optical/IR absorption are intrinsic to the source, perhaps caused by material in the stellar wind (e.g., Revnivtsev et al. 2003; Filliatre & Chaty 2004). This would be consistent with the possible variations in seen between our XMM-Newton data and previous observations, but those variations are far from robustly determined. Additionally, the reasonable agreement between the X-ray and optical/IR column densities (c.f. Filliatre & Chaty, 2004; Kaplan et al., 2006) suggests that the absorbing material is largely distributed along the line of sight.
We therefore believe it very likely that Sct X-1 is an X-ray binary with a giant or supergiant late-type companion located at a distance of kpc. In this case, the mass donor in Sct X-1 would be larger than several hundred (the companion to GX 1+4 has a radius ) and significantly more massive than in the previous scenario (i.e., a supergiant of rather than an evolved giant of 1–2). With such a large companion, even at a distance of 10 kpc the X-ray luminosity would be very low for steady Roche-lobe overflow accretion, so therefore the accretion must be either wind-fed or in an elliptical orbit. With either companion (a giant or supergiant), if we assume that the accretion is wind-fed, we can set a lower limit in the orbital period . For a circular orbit and M0I star (with stellar radius and mass ), we would need yr so that it was contained within its Roche lobe, while a star like the companion to GX 1+4 ( and ) would have yr.
With a large companion, Sct X-1 is a good candidate for an eclipsing system since the companion will occult the neutron star with a significant probability (Ray & Chakrabarty, 2002), and such eclipsing systems offer valuable constraints on the neutron star mass distribution (van Kerkwijk, van Paradijs, & Zuiderwijk, 1995). Further X-ray observations to measure the orbit of Sct X-1 and fully study the spectrum, along with optical/IR observations to determine the parameters of 2MASS J183525820736501, should be quite valuable in unraveling the nature of the system.
References
- Balucinska-Church & McCammon (1992) Balucinska-Church, M. & McCammon, D. 1992, ApJ, 400, 699
- Benjamin et al. (2003) Benjamin, R. A., et al. 2003, PASP, 115, 953
- Bildsten et al. (1997) Bildsten, L., et al. 1997, ApJS, 113, 367
- Buccheri et al. (1983) Buccheri, R., et al. 1983, A&A, 128, 245
- Carpenter (2001) Carpenter, J. M. 2001, AJ, 121, 2851
- Chakrabarty et al. (1997) Chakrabarty, D., et al. 1997, ApJ, 481, L101
- Chakrabarty & Roche (1997) Chakrabarty, D. & Roche, P. 1997, ApJ, 489, 254
- Chakrabarty et al. (1998) Chakrabarty, D., van Kerkwijk, M. H., & Larkin, J. E. 1998, ApJ, 497, L39
- Charles et al. (1975) Charles, P. A., Mason, K. O., & Davison, P. J. N. 1975, Astrophys. Lett., 16, 145
- Cooke et al. (1984) Cooke, B. A., Levine, A. M., Lang, F. L., Primini, F. A., & Lewin, W. H. G. 1984, ApJ, 285, 258
- Corbet et al. (1999) Corbet, R. H. D., Marshall, F. E., Peele, A. G., & Takeshima, T. 1999, ApJ, 517, 956
- Cox (2000) Cox, A. N. 2000, Allen’s Astrophysical Quantities, 4th edn. (New York: AIP Press/Springer)
- Cushing et al. (2005) Cushing, M. C., Rayner, J. T., & Vacca, W. D. 2005, ApJ, 623, 1115
- Davidsen et al. (1977) Davidsen, A., Malina, R., & Bowyer, S. 1977, ApJ, 211, 866
- Drimmel et al. (2003) Drimmel, R., Cabrera-Lavers, A., & López-Corredoira, M. 2003, A&A, 409, 205
- Egan et al. (2003) Egan, M. P. et al. 2003, VizieR Online Data Catalog, 5114, 0
- Epchtein et al. (1999) Epchtein, N., et al. 1999, A&A, 349, 236
- Erb et al. (2003) Erb, D. K., Shapley, A. E., Steidel, C. C., Pettini, M., Adelberger, K. L., Hunt, M. P., Moorwood, A. F. M., & Cuby, J.-G. 2003, ApJ, 591, 101
- Filliatre & Chaty (2004) Filliatre, P. & Chaty, S. 2004, ApJ, 616, 469
- Forman et al. (1978) Forman, W., Jones, C., Cominsky, L., Julien, P., Murray, S., Peters, G., Tananbaum, H., & Giacconi, R. 1978, ApJS, 38, 357
- Fukugita et al. (1996) Fukugita, M., Ichikawa, T., Gunn, J. E., Doi, M., Shimasaku, K., & Schneider, D. P. 1996, AJ, 111, 1748
- Goorvitch (1994) Goorvitch, D. 1994, ApJS, 95, 535
- Helfand et al. (2004) Helfand, D. J., Gotthelf, E. V., & Halpern, J. P. 2004, in Bulletin of the American Astronomical Society, 1513
- Hill et al. (1974) Hill, R., Burginyon, G., Grader, R., Toor, A., Stoering, J., & Seward, F. 1974, ApJ, 189, L69
- Hinkle et al. (2006) Hinkle, K. H., Fekel, F. C., Joyce, R. R., Wood, P. R., Smith, V. V., & Lebzelter, T. 2006, ApJ, 641, 479
- Kaplan et al. (2006) Kaplan, D. L., Moon, D.-S., & Reach, W. T. 2006, ApJ, 649, L107
- Koyama et al. (1990) Koyama, K., Kawada, M., Kunieda, H., Tawara, Y., & Takeuchi, Y. 1990, Nature, 343, 148
- Koyama et al. (1991) Koyama, K., Kunieda, H., Takeuchi, Y., & Tawara, Y. 1991, ApJ, 370, L77
- Landolt (1992) Landolt, A. U. 1992, AJ, 104, 340
- Levesque et al. (2005) Levesque, E. M., Massey, P., Olsen, K. A. G., Plez, B., Josselin, E., Maeder, A., & Meynet, G. 2005, ApJ, 628, 973
- Lopes de Oliveira et al. (2006) Lopes de Oliveira, R., Motch, C., Haberl, F., Negueruela, I., & Janot-Pacheco, E. 2006, A&A, 454, 265
- Makino (1988) Makino, F. 1988, IAU Circ., 4679, 2
- Marshall et al. (1979) Marshall, F. E., Boldt, E. A., Holt, S. S., Mushotzky, R. F., Rothschild, R. E., Serlemitsos, P. J., & Pravdo, S. H. 1979, ApJS, 40, 657
- Masetti et al. (2006) Masetti, N., Orlandini, M., Palazzi, E., Amati, L., & Frontera, F. 2006, A&A, 453, 295
- McLean et al. (1998) McLean, I. S., et al. 1998, Proc. SPIE, 3354, 566
- Meyer et al. (1998) Meyer, M. R., Edwards, S., Hinkle, K. H., & Strom, S. E. 1998, ApJ, 508, 397
- Predehl & Schmitt (1995) Predehl, P. & Schmitt, J. H. M. M. 1995, A&A, 293, 889
- Price et al. (2001) Price, S. D., Egan, M. P., Carey, S. J., Mizuno, D. R., & Kuchar, T. A. 2001, AJ, 121, 2819
- Ransom (2001) Ransom, S. M. 2001, Ph.D. Thesis, Harvard Univ.
- Ray & Chakrabarty (2002) Ray, P. S. & Chakrabarty, D. 2002, ApJ, 581, 1293
- Raymond & Smith (1977) Raymond, J. C. & Smith, B. W. 1977, ApJS, 35, 419
- Reid et al. (1980) Reid, C. A., Johnston, M. D., Bradt, H. V., Doxsey, R. E., Griffiths, R. E., & Schwartz, D. A. 1980, AJ, 85, 1062
- Revnivtsev et al. (2003) Revnivtsev, M. G., Sazonov, S. Y., Gilfanov, M. R., & Sunyaev, R. A. 2003, Astronomy Letters, 29, 587
- Skrutskie et al. (2006) Skrutskie, M. F., et al. 2006, AJ, 131, 1163
- Stetson (2000) Stetson, P. B. 2000, PASP, 112, 925
- Sugizaki et al. (2001) Sugizaki, M., Mitsuda, K., Kaneda, H., Matsuzaki, K., Yamauchi, S., & Koyama, K. 2001, ApJS, 134, 77
- van Kerkwijk et al. (1995) van Kerkwijk, M. H., van Paradijs, J., & Zuiderwijk, E. J. 1995, A&A, 303, 497
- Wallace & Hinkle (1997) Wallace, L. & Hinkle, K. 1997, ApJS, 111, 445
- Warwick et al. (1988) Warwick, R. S., Norton, A. J., Turner, M. J. L., Watson, M. G., & Willingale, R. 1988, MNRAS, 232, 551
- White & Swank (1984) White, N. E. & Swank, J. H. 1984, ApJ, 287, 856
- Yamauchi & Koyama (1993) Yamauchi, S. & Koyama, K. 1993, PASJ, 45, 449