Chandra and XMM-Newton discovery of the transient X-ray pulsar in the nearby spiral galaxy NGC 2403
Abstract
We report on the discovery and analysis of the transient X-ray pulsar CXOU J073709.1+653544 detected in the 2004 August–October Chandra and XMM-Newton observations of the nearby spiral galaxy NGC 2403. The X-ray source exhibits X-ray pulsations with a period P18 s and a nearly sinusoidal pulse shape and pulsed fraction 46-70% during the first three observations. A detailed timing analysis reveals a rapid decrease of the pulsation period from 18.25 s on Aug. 9 to 17.93 s on Sep. 12 and possibly 17.56 s on Oct. 3, 2004. The X-ray spectra of CXOU J073709.1+653544 are hard and are well fitted with an absorbed simple power law of photon index in the 0.3-7 keV energy band. The X-ray properties of the source and the absence of an optical/UV counterpart brighter than 20th magnitude allow us to identify CXOU J073709.1+653544 as accreting X-ray pulsar in NGC 2403. The maximum unabsorbed luminosity of the source in the 0.3-7 keV range, ergs s-1 at 3.2 Mpc, is at least 260 times higher than its quiescent luminosity, and exceeds the isotropic Eddington limit for a 1.4 compact object accreting hydrogen-rich material. The corresponding estimated luminosity in the 0.3-100 keV energy range could be as high as ergs s-1, assuming the typical pulsar energy spectrum with high-energy cut-off at 10-20 keV. The rate of decrease of the pulsation period of the source ( s s-1) is one of the fastest observed among accreting pulsars. The evolution of the pulsation period suggests that it is dominated by the intrinsic spin-up of the compact object, which is almost certainly a neutron star. The X-ray luminosity of CXOU J073709.1+653544 is high enough to account for the observed spin-up rate, assuming that the X-ray source is powered by disk accretion onto highly magnetized neutron star. Based on the transient behavior and overall X-ray properties of the source, we conclude that it could be an X-ray pulsar belonging to either a Be binary system or a low-mass system similar to the transient Galactic bursting pulsar GRO J1744-28.
Subject headings:
galaxies: individual (NGC 2403) — X-rays: binaries — X-rays: stars1. INTRODUCTION
The observations of accretion-powered X-ray pulsars provide a unique opportunity to study the dynamical properties of accreting matter and its interaction with the magnetosphere of a neutron star, and the transfer of the angular momentum in a binary system (White, Swank & Holt 1983; Nagase 1989; Bildsten et al. 1997). Most of the known accreting X-ray pulsars are found in the high-mass binary systems involving a neutron star and OB donor star (either supergiant or Be type) and are associated with younger stellar populations Corbet (1986); Charles & Coe (2006). These two types correspond to different modes of accretion with supergiant systems accreting from a radially outflowing stellar wind, and the Be binaries accreting from a circumstellar disk. Therefore, the accreting pulsars with supergiant companions are observed as persistent X-ray sources, while the Be systems are recurrent transients and highly variable sources and reach much higher X-ray luminosities up to ergs s-1. A small number of X-ray pulsars is associated with low-mass binary systems with mass donors ranging from a main-sequence stars to degenerate carbon-oxygen dwarfs and red giants and can reach persistent luminosities of ergs s-1 (Nagase 1989; Bildsten et al. 1997).
Until recently, the study of X-ray pulsars was limited to our Galaxy and the nearby Magellanic Clouds due to the limited sensitivity and spatial resolution of previous X-ray missions. With the advent of the Chandra and XMM-Newton X-ray observatories, it has become possible to study the spectral and timing properties of individual X-ray sources associated with more distant galaxies, including bright X-ray pulsators Fabbiano & White (2006); Fabbiano (2006). For example, recent XMM-Newton observations of M31 revealed a 865 s pulsating supersoft X-ray source and a 197 s accreting X-ray pulsar candidate with luminosities of ergs s-1 and pulsed fractions of Osborne et al. (2001); Trudolyubov et al. (2005). These results demonstrate that bright pulsating X-ray sources ( ergs s-1) can be detected with XMM-Newton and Chandra in the galaxies beyond the Local Group up to the distances of a few Mpc.
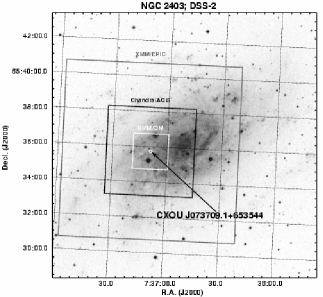
The spiral Scd galaxy NGC 2403 at 3.2 Mpc (Freedman & Madore 1988), provides a good opportunity to study X-ray source populations in a normal galaxy. NGC 2403 was a target of previous X-ray observations with the Einstein (Fabbiano & Trinchieri 1987; Fabbiano et al. 1992), ROSAT (Roberts & Warwick 2000; Liu & Bregman 2005) and ASCA observatories (Kotoku et al. 2000), which detected five discrete sources with one bright source classified as an ultraluminous X-ray source (ULX) with luminosity above ergs s-1. Recent Chandra observations covering the inner of the area of NGC 2403 have revealed 41 discrete sources with apparent luminosities down to ergs s-1 and allowed to study unresolved soft X-ray emission from the galactic disk Schlegel & Pannuti (2003); Fraternali et al. (2002). In addition, the survey of luminous X-ray source populations with XMM-Newton allowed to study spectral properties of four brightest sources detected in NGC 2304 (Winter et al. 2006)
In this paper, we report on the discovery of the transient pulsating X-ray source CXOU J073709.1+653544 in NGC 2403 using publicly available August-October 2004 observations made with Chandra and XMM-Newton as a part of the follow-up program studying recent supernova SN 2004dj Pooley & Lewin (2004).
2. OBSERVATIONS AND DATA REDUCTION
In our analysis we used the data of four 2004 August-December Chandra/ACIS-S observations of SN 2004dj region and 2001 April 17 observation of NGC 2403 (Table 1). The data of Chandra observations was processed using the CIAO v3.3111http://asc.harvard.edu/ciao/ threads. We performed standard screening of the Chandra data to exclude time intervals with high background levels, and found no flares exceeding 20% of the average background level. For each observation, we generated X-ray images in the 0.3-7 keV energy band, and used CIAO wavelet detection routine wavdetect to detect point sources. Only data in the 0.3-7 keV energy range was used in the spectral analysis of ACIS-S observations. The standard CIAO axbary tool was used to produce a barycenter-corrected source event lists used in the timing analysis. During three 2004 August-October observations the source was positioned on the back-illuminated chip S3, offset by from the aim point. To produce source filtered event lists and spectra, we extracted counts within the inclined elliptical region with semi-axes of and centered at the position of CXOU J073709.1+653544, large enough to include more than 90% of the source energy flux. Background counts were extracted from the adjacent source-free regions with subsequent normalization by ratio of detector areas.
We also use the data of 2003 April 30, 2003 September 11 and 2004 September 12 XMM-Newton observations of NGC 2403 (Table 1) with three European Photon Imaging Camera (EPIC) instruments (MOS1, MOS2 and pn)Turner et al. (2001); Strueder et al. (2001), and the Optical Monitor (OM) telescope (Mason et al. 2001). We reduced XMM data using XMM-Newton Science Analysis System (SAS v 6.5.0)222See http://xmm.vilspa.esa.es/user. For 2004 September 12 observation, we filtered the original EPIC event files based on the good time intervals produced from the light curves extracted from the whole detector in the 0.2-12 keV energy band by applying an upper count rate threshold of 6 and 2 counts s-1 for the EPIC pn and MOS cameras. The last ks of the EPIC observation is affected by high background, and has been excluded from analysis. The standard SAS tool barycen was used to perform barycentric correction on the original EPIC event files used for timing analysis. A significant part of 2003 April 30 and September 11 XMM-Newton observations was affected by background flares. After screening for high background only ks (2003 Apr. 30 observation) and ks (2003 Sep. 11 observation) of EPIC-MOS exposure and 5 ks of EPIC-pn exposure (2003 Sep. 11 observation) was left for the analysis (Table 1).
We generated EPIC-pn and MOS images of NGC 2403 field in the 0.3-7.0 keV energy band, and used the SAS standard maximum likelihood (ML) source detection script edetect_chain to detect point sources. We used bright X-ray sources with known counterparts from USNO-B catalog Monet et al. (2003) and Chandra source lists to correct EPIC image astrometry. The astrometric correction was also applied to the OM images, using cross-correlation with USNO-B catalog. After correction, we estimate residual systematic error in the source positions to be of the order for both EPIC and OM.
To generate EPIC-MOS source lightcurves and spectra during the 2004 September 12 XMM observation, we used a circular region of radius centered at the position of CXOU J073709.1+653544. Due to the source proximity to the edge of EPIC-pn CCD, the source counts were extracted from the elliptical region with semi-axes of and and position angle of 20 degrees, including of the source energy flux. The adjacent source-free regions were used to extract background spectra and lightcurves. The source and background spectra were then renormalized by ratio of the detector areas. For spectral analysis, we used data in the keV energy band. To synchronize source and background lightcurves from individual EPIC detectors, we used the identical time filtering criteria based on Mission Relative Time (MRT), following the procedure described in Barnard et al. (2007). The background lightcurves were not subtracted from the source lightcurves, but were used later to estimate the background contribution in the calculation of the source pulsed fractions.
To estimate upper limits on the quiescent source luminosities, the ACIS and EPIC count rates were converted into energy fluxes in the 0.3-7 keV energy range using Web PIMMS333http://heasarc.gsfc.nasa.gov/Tools/w3pimms.html, assuming an absorbed power law spectral shape with photon index and Galactic foreground absorbing column NH= cm-2 Dickey & Lockman (1990).
The energy spectra were grouped to contain a minimum of 20 counts per spectral bin in order to allow statistics, and fit to analytic models using the XSPEC v.12444http://heasarc.gsfc.nasa.gov/docs/xanadu/xspec/index.html fitting package Arnaud (1996). EPIC-pn, MOS1 and MOS2 data were fitted simultaneously, but with normalizations varying independently. For timing analysis we used standard XANADU/XRONOS v.5555http://heasarc.gsfc.nasa.gov/docs/xanadu/xronos/xronos.html tasks.
In the following analysis we assume a distance of 3.2 Mpc for NGC 2403 (Freedman & Madore 1988). All parameter errors quoted are 68% () confidence limits.
3. RESULTS
3.1. Source Position
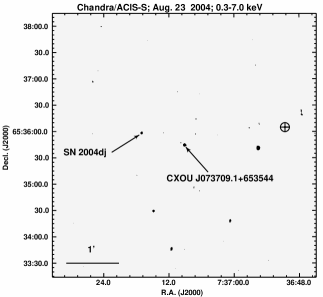
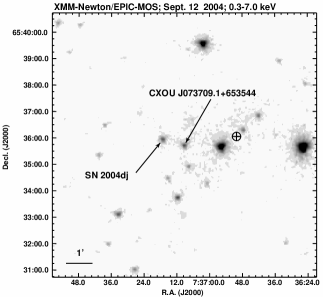
We discovered a new X-ray source CXOU J073709.1+653544 in the data of the 2004 August 9 and detected it in the subsequent August 23 and October 3 Chandra observations of the NGC 2403 field (Table 1). In addition, the analysis of archival 2004 September 12 XMM-Newton observation revealed the presence of a bright X-ray source at the position consistent with CXO J073709.13+653544. The source was not detected in the 2004 December 22 Chandra observation (observation ID 4630). Combining the data of three Chandra observations, we measure the position of CXOU J073709.1+653544 to be (J2000 equinox) with an uncertainty of (Fig. 1). The projected galactocentric distance of CXOU J073709.1+653544 is or kpc at 3.2 Mpc.
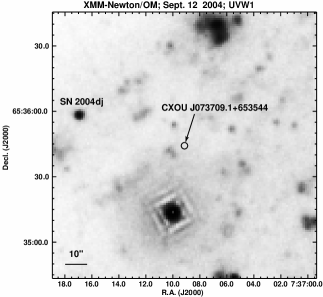
The search for the optical counterparts using the images from the Digitized Sky Survey did not yield any stellar-like object brighter than within the error circle of CXOU J073709.1+653544. We used the data of 2003 April 30 and 2004 Sept. 12 XMM-Newton/OM observations to search for UV counterparts to the source prior and during its X-ray outburst (Fig. 1). We did not detect any stellar counterparts to CXOU J073709.1+653544 in the OM images down to the limit of in the U and OM UVW1 (291 nm) bands.
3.2. Long-Term Flux Evolution
The evolution of X-ray luminosity of CXOU J073709.1+653544 in the 0.3-7 keV energy band based on the data of 2004 Chandra and XMM-Newton observations is shown in Fig. 2. The first two August 2004 Chandra observations show the overall increase of the source X-ray luminosity in the 0.3-7 keV energy band from to ergs s-1. The subsequent XMM-Newton and Chandra observations revealed the gradual decrease of the source luminosity to ergs s-1 on Sept. 12, and ergs s-1 on Oct. 3, 2004. The source was not detected during the 2004 December 22 Chandra observation with an upper limit on its 0.3-7 keV luminosity of ergs s-1 (), times lower than maximum measured outburst luminosity. It should be noted that due to the sparse sampling the lightcurve of the source observed during 2004 August-October could be a result of either single long ( days) outburst or the superposition of a number of shorter outbursts poorly sampled in time. The analysis of archival 2001 April 17 Chandra observation (observation ID 2014) Schlegel & Pannuti (2003) of NGC 2403 taken prior to the 2004 outburst, allow us to estimate the average upper limit () on the source quiescent luminosity to be ergs s-1 in the keV energy band. The source was not detected in the two 2003 April 30 and September 11 XMM-Newton observations (Table 1), but with a much less stringent upper limit on its 0.3-7 keV luminosity, ergs s-1 (Fig. 2).
3.3. X-ray Pulsations
We performed a timing analysis of the CXOU J073709.1+653544 using the data from Chandra/ACIS-S and XMM-Newton/EPIC detectors in the 0.3-7 keV energy band. After a barycentric correction of the photon arrival times in the original event lists, we performed a Fast Fourier Transform (FFT) analysis using standard XRONOS task powspec, in order to search for coherent periodicities. For the analysis of XMM-Newton data, we used combined synchronized EPIC-pn and MOS lightcurves with 2.6 s time bins to improve sensitivity. We found strong peaks in the Fourier spectra of data from the 2004 Aug. 9 and 23 Chandra observations and 2004 Sept. 12 XMM observation at the frequencies of (5.48-5.58) Hz (Fig. 3, left panels). The strengths of the peaks in the individual Fourier spectra (Fig. 3) correspond to the period detection confidence of , and for the Aug. 9, 23 Chandra and Sept. 12 XMM-Newton observations (disregarding simultaneous detection in all three observations).
To estimate the pulsation periods more precisely, we used an epoch folding technique, assuming no period change during individual observations. The most likely values of the pulsation period (Table 2) were obtained fitting the peaks in the versus trial period distribution with a Gaussian. The period errors in Table 2 were computed following the procedure described in Leahy (1987). Then the source lightcurves were folded using the periods determined from epoch folding analysis. The resulting folded lightcurves of CXOU J073709.1+653544 in the 0.3-7 keV energy band during first three observations are shown in Fig. 3 (right panels). The source demonstrates quasi-sinusoidal pulse profiles in the 0.3-7 keV energy band during the first three observations (Fig. 3). The pulsed fraction, defined as (Imax-Imin)/(Imax+Imin), where Imax and Imin represent source intensities at the maximum and minimum of the pulse profile excluding background photons, is significantly higher during the 2004 Aug. 9 Chandra observation (704%) when compared to the observations #5 (464%) and #6 (563%) (Table 2).
Although the analysis of the Oct. 3 Chandra observation (obs. #7) did not show the presence of a strong single peak in the power density spectrum, we still performed a search for the pulsations in the data of this observation using the epoch folding technique. The epoch folding analysis of the source lightcurve have led to the marginal detection of the pulsation with a period of 17.565 s (Fig. 3, left panel). The folded lightcurve of the source in the 0.3-7 keV energy band with a significance of determined using for a nonvarying, constant model, is shown in the lower right panel of Fig. 3. The pulse profile possibly shows a non-sinusoidal structure, which probably explains why we do not see strong first harmonic in its Fourier spectrum.
To investigate the energy dependence and time evolution of the source pulse profile, light curves in the soft (0.3-2 keV) and hard (2-7 keV) bands were created for observations #4, 5, and 6 666The limited source count statistics in the Oct. 3 observation does not permit a detailed study of energy dependence of pulsations. and folded at the corresponding best pulsation periods (Figure 4). The corresponding background-corrected pulsed fractions in the soft and hard energy bands are given in Table 2. As can be seen from Fig. 4 and Table 2, the energy dependence of the pulse profile in the Aug. 9 Chandra observation (obs. #4) is qualitatively different from subsequent Chandra and XMM-Newton observations (obs. #5 and 6). The source modulation amplitude in the soft band is higher than in the hard band during Aug. 9 Chandra observation, while the modulation is stronger in the hard band during the Aug. 23 Chandra and Sept. 12 XMM-Newton observations. The modulation fraction in the soft band is highest (785%) during the Aug. 9 observation, and drops to 436% and 506% on Aug. 23 and Sept. 12 (Table 2). At the same time, the modulation fraction in the hard energy band remains compatible during all three observations (Table 2; Fig. 4).
3.4. Long-term Period Evolution
There is a significant change of the pulsation period of CXOU J073709.1+653544 measured over the course of four observations covering a 55-day period from P=18.253 s on Aug. 9, 2004 to P=17.934 s on Sept. 12, 2004 and possibly P=17.565 s on Oct. 3, 2004 (Table 2; Fig. 5). During the first three observations corresponding to a -day time interval, the source shows a roughly linear decrease of the pulsation period. Using these three period measurements and assuming its linear time dependence, we estimate the rate of period change s s-1 (pulse frequency derivative Hz s-1), that corresponds to s yr-1 for a period s.
3.5. X-ray Spectra
The pulse phase averaged Chandra/ACIS-S and XMM-Newton/EPIC spectra of CXOU J073709.1+653544 can be adequately fit with the absorbed simple power law models with photon index, and an equivalent hydrogen density N cm-2. The corresponding absorbed luminosity of the source in the 0.3-7 keV band ranges between and ergs s-1, assuming the distance of 3.2 Mpc. The best-fit spectral model parameters for individual observations are given in Table 2. The luminosity and energy spectra of the source are similar to that of the bright X-ray pulsars in our Galaxy and the Magellanic Clouds (Nagase 1989; Yokogawa et al. 2003). The shape of the energy spectra of CXOU J073709.1+653544 in the 0.3-7 keV energy band remains essentially constant throught the outburst despite significant change of the source luminosity. For all observations, the measured absorbing column is 3-10 times higher than the Galactic hydrogen column in the direction of NGC 2403, 4 cm-2 Dickey & Lockman (1990), consistent with an additional intrinsic absorption within the system and inside the disk of NGC 2403.
4. DISCUSSION
A combination of transient behavior and the extremely large spin-up rate of CXOU J073709.1+653544 makes it a unique object among pulsating X-ray sources. The overall X-ray properties (X-ray spectrum, pulsation period etc.) of the source are consistent with that of the accreting X-ray pulsar in a binary system (White, Swank & Holt 1983; Nagase 1989). The absence of bright optical counterparts (both during quiescence and outburst), transient behavior, overall X-ray properties of CXOU J073709.1+653544 and positional coincidence with NGC 2403, allow us to conclude that is almost certainly located outside our Galaxy and belongs to NGC 2403. Placing CXOU J073709.1+653544 at the distance of NGC 2403 (3.2 Mpc) implies very high luminosities of the source during the outburst ( ergs s-1 in the 0.3-7 keV energy band and ergs s-1 in the 0.3-10 keV energy band) with maximum observed luminosity exceeding the isotropic Eddington luminosity limit for a object accreting hydrogen-rich material. If CXOU J073709.1+653544 is indeed an accreting X-ray pulsar in NGC 2403, the relative rate of change of its pulsation period, s-1 is the highest observed in this class of objects to date (Nagase 1989; Bildsten et al. 1997).
If the X-ray pulsations observed in CXOU J073709.1+653544 result from rotation of a highly magnetized accreting compact object in a binary system, the change of its pulsation period can be explained by combination of binary orbital motion of the pulsar (Skinner et al. 1982) and transfer of angular momentum in the accretion process (Rappaport & Joss 1977; Ghosh & Lamb 1979). The relatively long time scale on which we observe the decrease of the pulsation period and its high, nearly constant rate suggest that the intrinsic spin-up of the pulsar should make the major contribution to the observed change of the pulsation period. Using the observed pulsation parameters of CXOU J073709.1+653544, and assuming that disk accretion is occurring in the system, one can make a simple estimate of the lower limit on the accretion rate required to explain the observed spin-up rate . Let us assume that all the specific angular momentum of the accreting material is transferred to the compact object at the magnetospheric radius . In order to keep the “propeller” effect from preventing accretion onto compact object, the magnetospheric radius must be less that the corotation radius , where is the rotational period and is a compact object mass Illarionov & Sunyaev (1975). The maximum torque experienced by compact object , where denotes the accretion rate through the disk, should be greater or equal to the observed torque , where is the moment of inertia of the compact object. As a result, we obtain
| (1) |
or,
| (2) |
where . Substituting typical white dwarf parameters ( g cm2, ) and the observed rotation period and its derivative into equation (2) gives an unreasonably high mass accretion rate g s-1. On the other hand, for a typical neutron star parameters ( g cm2, ) the estimated mass accretion rate required to produce the observed spin-up is g s year-1. The corresponding bolometric luminosity of the 1.4 neutron star accreting at such rate should be ergs s-1, assuming that all gravitational energy of the infalling matter released in the process of accretion is converted into radiation. The estimated bolometric luminosity of the source is very high, exceeding the Eddington critical luminosity for a 1.4 star accreting hydrogen-rich material at least by factor of 4.
It is interesting to compare the luminosity required from accretion spin-up mechanism to the total X-ray luminosity of the source during the outburst. In order to estimate the total X-ray luminosity of CXOU J073709.1+653544, we extrapolated the results of our spectral analysis to the higher energies, assuming that the broad-band spectrum of the source in the 0.3-100 keV band is represented by a power law with high-energy cutoff at energies above 10-20 keV, as typically observed in the accreting X-ray pulsars (White, Swank & Holt 1983; Nagase 1989). To model the broad-band spectrum, we used a simple power law model with photon index and normalization derived from spectral fitting in the 0.3-7 keV band, modified at energies above a high-energy cutoff by the function , where is the folding energy. For the Aug. 23 observation, the estimated X-ray luminosity of CXOU J073709.1+653544 in the 0.3-100 keV energy band falls between and ergs s-1 for keV and keV. Note that this estimate should be regarded as a lower limit, as it does not account for the possible presence of the soft ( keV) component in the spectrum of the source, similar to that observed in some of the bright X-ray pulsars Yokogawa et al. (2003). Therefore, the estimated maximum X-ray luminosity of CXOU J073709.1+653544 is high enough to account for the observed spin-up rate, assuming that the X-ray source is powered by disk accretion onto highly magnetized neutron star.
The estimated maximum luminosity of the source can be used to put an upper limit on the strength of the magnetic field of the neutron star. Assuming the dipole configuration of the pulsar magnetic field, and requiring the magnetospheric radius to be smaller than corotation radius , we obtain
| (3) |
where and is the radius of the neutron star.
Although both the observed luminosity of the source and luminosities required by spin-up due to disk accretion are extremely high, they lie within the range observed for pulsating neutron stars that can reach luminosities of ergs s-1 (White & Carpenter 1978; Skinner et al. 1982; Nagase 1989). The required luminosities are also consistent with theoretical predictions for super-Eddington accretion onto highly magnetized ( G) neutron star (Basko & Sunyaev 1976). At high accretion rates, the accreting matter is expected to release its gravitational energy inside accretion columns above the magnetic poles of the neutron star. Since most of radiation is emitted from the sides of these columns, it can escape the system without crossing the bulk of the inflowing accreting matter. This anisotropy allows the luminosity of the neutron star to exceed formal Eddington limit by large factors. For the accretion column with a cross-section in the form of a thin ring segment of length and thickness , the limiting luminosity that can be reached in the Basko & Sunyaev (1976) model is given by
| (4) |
Therefore, for the highly super-Eddington accretion rate and the emission from accretion columns could explain the observed high luminosity of CXOU J073709.1+653544.
The measured pulse period places CXOU J073709.1+653544 among Be systems or short-period binary supergiant systems with Roche lobe overflow on a Corbet diagram (pulse period-orbital period plot)(Corbet 1986; Waters & van Kerkwijk 1989; Bildsten et al. 1997). The transient behavior of the source suggests a higher probability for it to be a member of Be binary class, since majority of Be systems display recurrent/transient outbursts. The high peak luminosity of CXOU J073709.1+653544 ( ergs s-1) is also not unusual for the Be X-ray pulsars with transient Be X-ray pulsar A0538-66 reaching similar luminosities during its giant outbursts Skinner et al. (1982).
Using the Corbet diagram, one can try to predict the value of the binary period of CXOU J073709.1+653544. If it is indeed a Be system, the estimated orbital period can vary between and days. The observed duration of the source outburst allows us to put further constraints on the value of the binary period. Assuming that we observed a single outburst from the source and that it corresponds to one orbital cycle, we obtain days. Note, however, that if the source went through the giant (class II) outburst lasting for several orbits (Stella, White & Rosner 1986) or a sequence of shorter outbursts during August-October 2004, the orbital period of the system could be much shorter than 60 days.
Another possibility is that CXOU J073709.1+653544 is a transient low-mass binary system. The transient behavior and high luminosity of the source are somewhat similar to that of the Galactic bursting X-ray pulsar GRO J1744-28 (Kouveliotou et al. 1996), that reached a luminosity of ergs s-1 during the peak of its outburst (Giles et al. 1996; Sazonov, Sunyaev & Lund 1997). In the low-mass system scenario, the transient outbursts of the source could be explained by sudden increase of accretion from the disk reservoir (Sunyaev & Shakura 1977) or as a result of the viscous-thermal instability of the quiescent accretion disk.
The discovery of X-ray pulsations in CXOU J073709.1+653544 is yet another demonstration that deep monitoring observations with Chandra and XMM-Newton have a great potential in revealing populations of both persistent and transient pulsating X-ray sources in nearby galaxies. Future observations of CXOU J073709.1+653544, if it reappears, could possibly give deeper insight into the behavior of this and other similar X-ray pulsar systems. The complete coverage of the source outbursts with more frequent sampling would allow to estimate the orbital parameters of the system and help to determine its nature.
References
- Arnaud (1996) Arnaud, K. 1996, in Astronomical Data Analysis Software and Systems V, ASP Conference Series 101, ed. G. Jacoby & J. Barnes (San Francisco: ASP) 17
- Barnard et al. (2007) Barnard, R., Trudolyubov, S., Kolb, U. C., Haswell, C. A., Osborne, J. P., & Priedhorsky, W. C. 2006, A&A, in press (astro-ph/0703120)
- Basko & Sunyaev (1976) Basko, M. M., & Sunyaev, R. A. 1976, MNRAS, 175, 395
- Bildsten et al. (1997) Bildsten, L., Chakrabarty, D., Chiu, J., Finger, M. H., Koh, D. T., Nelson, R. W., Prince, T. A., Rubin, B. C., Scott, D. M., Stollberg, M., Vaughan, B., Wilson, C. A., & Wilson, R. B. 1997, ApJSS, 113, 367
- Charles & Coe (2006) Charles, P. A., & Coe, M. J. 2006, in Compact Stellar X-ray Sources, ed. W. H. G. Lewin & M. van der Klis (Cambridge: Cambridge Univ. Press)
- Corbet (1986) Corbet, R. H. D. 1986, MNRAS, 220, 1047
- Dickey & Lockman (1990) Dickey, J. M., & Lockman F. J. 1990, ARA&A, 28, 215
- Fabbiano et al. (1992) Fabbiano, G., Kim, D.-W., & Trinchieri, G. 1992, ApJS, 80, 531
- Fabbiano & Trinchieri (1987) Fabbiano, G., & Trinchieri, G. 1987, ApJ, 315, 46
- Fabbiano & White (2006) Fabbiano, G., & White, N. E. 2006, in Compact Stellar X-ray Sources, ed. W. H. G. Lewin & M. van der Klis (Cambridge: Cambridge Univ. Press)
- Fabbiano (2006) Fabbiano, G. 2006, ARA&A, 44, 323
- Fraternali et al. (2002) Fraternali, F., Cappi, M., Sancisi, R., & Oosterloo, T. 2002, ApJ, 578, 109
- Freedman & Madore (1988) Freedman, W. L., & Madore, B. F. 1988, ApJ, 332, L63
- Ghosh & Lamb (1979) Ghosh, P., & Lamb, F. K. 1979, ApJ, 234, 296
- Giles et al. (1996) Giles, A. B., Swank, J. H., Jahoda, K., Zhang, W., Strohmayer, T., Stark, M. J., & Morgan, E. H. 1996, ApJ, 469, L25
- Illarionov & Sunyaev (1975) Illarionov, A. F., & Sunyaev, R. A. 1975, A&A, 39, 185
- Kotoku et al. (2000) Kotoku, J., Mizuno, T., Kubota, A., & Makishima, K. 2000, PASJ, 52, 1081
- Kouveliotou et al. (1996) Kouveliotou, C., van Paradijs, J., Fishman, G. J., Briggs, M. S., Kommers, J., Harmon, B. A., Meegan, C. A., & Lewin, W. G. H. 1996, Nature, 379, 799
- Leahy (1987) Leahy, D. A. 1987, A&A, 180, 275
- Liu & Bregman (2005) Liu, J., & Bregman, J. N. 2005, ApJS, 157, 59
- Mason et al. (2001) Mason, K.O., Breeveld, A., Much, R., Carter, M., Córdova, F. A.; Cropper, M. S., Fordham, J., Huckle, H., Ho, C., Kawakami, H., Kennea, J., Kennedy, T., Mittaz, J., Pandel, D., Priedhorsky, W. C., Sasseen, T., Shirey, R., Smith, P., & Vreux, J.-M. 2001, A&A, 365, 36
- Monet et al. (2003) Monet, D.G., et al. 2003, AJ, 125, 984
- Nagase (1989) Nagase, F. 1989, PASJ, 41, 1
- Osborne et al. (2001) Osborne, J. P., Borozdin, K. N., Trudolyubov, S. P., Priedhorsky, W. C., Soria, R., Shirey, R., Hayter, C., La Palombara, N., Mason, K., Molendi, S., Paerels, F., Pietsch, W., Read, A. M., Tiengo, A., Watson, M. G., & West, R. G. 2001, A&A, 378, 800
- Pooley & Lewin (2004) Pooley, G., & Lewin, W. H. G. 2004, IAU Circ. 8390
- Rappaport & Joss (1977) Rappaport, S., & Joss, P. C. 1977, Nature, 266, 683
- Roberts & Warwick (2000) Roberts, T. P., & Warwick, R. S. 2000, MNRAS, 315, 98
- Sazonov, Sunyaev & Lund (1997) Sazonov, S. Y., Sunyaev, R. A., & Lund, N. 1997, Astron. Lett., 23, 286
- Schlegel & Pannuti (2003) Schlegel, E. M., & Pannuti, T. J. 2003, AJ, 125, 3025
- Skinner et al. (1982) Skinner, G. K., Bedford, D. K., Elsner, R. F., Leahy, D., Weisskopf, M. C., & Grindlay, J. 1982, Nature, 297, 568
- Stella, White & Rosner (1986) Stella, L., White, N. E., & Rosner, R. 1986, ApJ, 308, 669
- Strueder et al. (2001) Strueder, L. et al., 2001, A&A, L18
- Sunyaev & Shakura (1977) Sunyaev, R. A., & Shakura, N. I. 1977, Sov. Astron. Lett., 3, 138
- Trudolyubov et al. (2005) Trudolyubov, S., Kotov, O., Priedhorsky, W., Cordova, F., & Mason, K. 2005, ApJ, 634, 314
- Turner et al. (2001) Turner, M. et al., 2001, A&A, 365, L27
- Waters & van Kerkwijk (1989) Waters, L. B. F. M., & van Kerkwijk, M. H. 1989, A&A, 223, 196
- White & Carpenter (1978) White, N. E., & Carpenter, G. F. 1978, MNRAS, 183, 11
- White, Swank & Holt (1983) White, N. E., Swank, J. H., & Holt, S. S. 1983, ApJ, 270, 711
- Winter et al. (2006) Winter, L. M., Mushotzky, R. F., & Reynolds, C. S. 2006, ApJ, 649, 730
- Yokogawa et al. (2003) Yokogawa, J., Imanishi, K., Tsujimoto, M., Koyama, K., & Nishiuchi, M. 2003, PASJ, 55, 161
| Obs.# | Date, UT | Date, TJD | Obs. ID | Mission/Instrument | Mode/ | RA (J2000)aapulsed fraction in the , and keV energy bands, defined as (Imax-Imin)/(Imax+Imin), where Imax and Imin represent source background-corrected intensities at the maximum and minimum of the pulse profile | Dec (J2000)aapulsed fraction in the , and keV energy bands, defined as (Imax-Imin)/(Imax+Imin), where Imax and Imin represent source background-corrected intensities at the maximum and minimum of the pulse profile | Exp.bbabsorbed model flux in the keV energy range in units of erg s-1 cm-2 |
|---|---|---|---|---|---|---|---|---|
| Filter | (h:m:s) | (d:m:s) | (ks) | |||||
| 1 | 2001 Apr. 17 | 12016.401(0.221) | 2014 | Chandra/ACIS-S | Faint | 07:36:49.86 | +65:34:43.5 | 35.5 |
| 2 | 2003 Apr. 30 | 12759.756(0.090) | 0150651101 | XMM-Newton/EPIC | Full/Thin | 07:36:51.00 | +65:36:10.0 | 4.7(MOS)ccunabsorbed model flux in the keV energy range in units of erg s-1 cm-2 |
| 3 | 2003 Sep. 11 | 12893.044(0.065) | 0150651201 | XMM-Newton/EPIC | Full/Thin | 07:36:51.00 | +65:36:10.0 | 8.9(MOS)/5.0(pn) |
| 4 | 2004 Aug. 09 | 13226.561(0.273) | 4627 | Chandra/ACIS-S | Faint | 07:37:22.34 | +65:36:10.7 | 40.0 |
| 5 | 2004 Aug. 23 | 13240.701(0.290) | 4628 | Chandra/ACIS-S | Faint | 07:37:21.72 | +65:36:10.9 | 46.5 |
| 6 | 2004 Sep. 12 | 13261.182(0.449) | 0164560901 | XMM-Newton/EPIC | Full/Medium | 07:37:17.00 | +65:35:57.8 | 59.0(MOS)/52.4(pn) |
| 7 | 2004 Oct. 03 | 13281.951(0.276) | 4629 | Chandra/ACIS-S | Faint | 07:37:19.45 | +65:36:29.8 | 44.5 |
| 8 | 2004 Dec. 22 | 13361.938(0.304) | 4630 | Chandra/ACIS-S | Faint | 07:37:12.85 | +65:36:20.9 | 49.9 |
pointing coordinates
bbabsorbed model flux in the keV energy range in units of
erg s-1 cm-2instrument exposure used in the analysis
ccunabsorbed model flux in the keV energy range in units of
erg s-1 cm-2the source position coincides with the gap between EPIC-pn CCDs, only EPIC-MOS data was used in the analysis
| Obs. | Period | PF0.3-7keV | PF0.3-2keV | PF2-7keV | NH | Photon | Fluxbbabsorbed model flux in the keV energy range in units of erg s-1 cm-2 | Fluxccunabsorbed model flux in the keV energy range in units of erg s-1 cm-2 | ddabsorbed luminosity in the keV energy range in units of erg s-1, assuming the distance of 3.2 Mpc | eeunabsorbed luminosity in the keV energy range in units of erg s-1, assuming the distance of 3.2 Mpc | Instrument | |
|---|---|---|---|---|---|---|---|---|---|---|---|---|
| (s) | (%)aapulsed fraction in the , and keV energy bands, defined as (Imax-Imin)/(Imax+Imin), where Imax and Imin represent source background-corrected intensities at the maximum and minimum of the pulse profile | (%)aapulsed fraction in the , and keV energy bands, defined as (Imax-Imin)/(Imax+Imin), where Imax and Imin represent source background-corrected intensities at the maximum and minimum of the pulse profile | (%)aapulsed fraction in the , and keV energy bands, defined as (Imax-Imin)/(Imax+Imin), where Imax and Imin represent source background-corrected intensities at the maximum and minimum of the pulse profile | ( cm-2) | Index | (d.o.f) | ||||||
| 4 | 1.94 | 2.40 | ACIS-S | |||||||||
| 5 | 2.33 | 2.60 | ACIS-S | |||||||||
| 6 | 1.09 | 1.21 | EPIC/pn+MOS | |||||||||
| 7 | … | … | … | 0.47 | 0.61 | ACIS-S |