Multi-Frequency VLBI Observations of the Gravitational Lens B2016+112
Abstract:
We present Global VLBI and HSA images of the gravitational lens B2016+112 at 18, 6 and 3.6 cm. Previous VLBI observations showed that images A and B (which are clearly lensed images of a single background source) and the elongated region C are each divided into components. Our new high-resolution maps reveal more components in images A and B, clearly demonstrating their expected opposite parities. According to the scenario of Koopmans et al. (2002), the arc-like region C consists of two merging, partial images (“C1-C2”) of just a small region of the same background source, seen with high lens magnification. We have determined the spectra and relative positions of the components within all four images in order to test this scenario. We find that the outer north-west components in images A and B do indeed have radio spectra similar to the components seen in C1 and C2.
1 Introduction
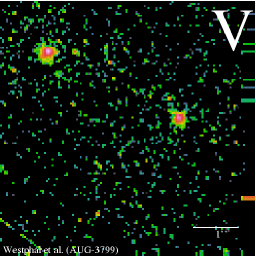
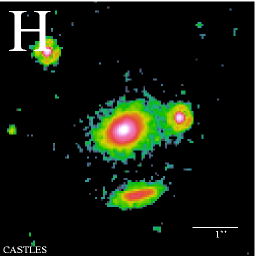
The gravitational lens system B2016+112, discovered in 1981 in the MIT-Green Bank 6-cm survey, shows three radio components A, B and C (see Figure 1 left). The overall integrated spectrum of this system is that of a Gigahertz Peaked Spectrum source. Components A and B, separated by 3.4 arcseconds, are associated with the lensed images of an AGN at redshift ([1] [2] [3]; see Figure 1, centre). The radio and optical positions of A and B are coincident within the measurement errors and they also have similar spectra in both radio and optical, as expected for lensed images. Koopmans et al ([4]) describe the optical spectrum as that of a type-II quasar.
Component C, which is the brightest radio source in the field, lies 2 arcseconds away to the south-east of B and is extended in the E-W direction. It is associated with a diffuse extended object in the infrared. A giant elliptical galaxy D at ([2]), lying close to the centroid of A, B and C, observed in K and I bands ([5]), acts as the primary lens (see Figure 1, right). Because the radio spectrum of C is flatter than those of A and B, and there is no associated optical nucleus, it is not clear whether this is also lensed emission from the same background source.

Images A and B are each further resolved into two components as shown in 18 cm-VLBI observations ([6]) and C is resolved into four components from 6 cm-MERLIN and 18 cm-EVN observations ([7], [8]). These show that the outer two components in region C have steeper spectra than the inner two components.
The lens model of this system by Koopmans et al. ([4]) consists of a single screen which contains the primary lens D, two singular isothermal sphere (SIS) mass distributions and an external shear. In this model B2016+112 is interpreted as a quadruply imaged lens system, in which the diamond caustic crosses the radio source such that just part of the “counter-jet”, host galaxy and narrow line regions are imaged at A, B and C (where C consists of two partial images, C1 and C2). The complete source, including all radio components and the optical nucleus, is only doubly imaged (A and B). This model predicts unusually high magnification ( 300) in region C. Support for this interpretation is provided by spectral observations showing that C has features at the same redshift as A and B. In this work, we analyze the spectra of all the radio components in order to test Koopmans’ scenario.
2 Observations and Data Reduction
Multi-frequency Global VLBI and HSA observations were made of B2016+112 (see Table 1). B2029+121 was used for phase calibration and B2134+004 as a fringe-finder. The data were processed at the VLBA correlator, producing 16 frequency samples per baseband channel.
| Date | Wavelength | Antennas | Obs. time | Integ. | BB chans. | Polarization |
|---|---|---|---|---|---|---|
| (hours) | time(sec) | per polsn. | ||||
| 25Feb02 | 18 cm | Eb, Jb, Mc, On, Tr | 17 | 2 | 4x8MHz | LCP-only |
| VLBA, Y, Ro, Go | ||||||
| 17Nov01 | 6 cm | Eb, Jb, Mc, On, Wb | 17 | 1 | 2x8MHz | LCP+RCP |
| VLBA, Ar | ||||||
| 30Apr06 | 3.6 cm | VLBA, Eb, Gb, Ar | 7 | 1 | 4x8MHz | LCP+RCP |
Further processing of the datasets was carried out with the NRAO aips package. No averaging of the data in either time or frequency was made, in order to reduce the effects of bandwidth and fringerate smearing when imaging this wide field lens system. First, the a priori amplitude calibration derived from system temperature measurements and antenna gains was applied to the data. Then the instrumental phase, delay and rate solutions determined from fringe-fitting the B2029+121 data were applied to make a map of B2016+112. Three sub-fields centered on A, B and C were imaged. This phase referenced map was then used as an initial model for phase self-calibration of the lens data. Several runs of the tasks calib and imagr were performed to refine the phase and amplitude solutions before a satisfactory map was obtained. All maps were made using a weighting scheme between uniform and natural (parameter robust = 0 in the task imagr) to give a reasonable balance between high resolution and high sensitivity. In order to determine the flux densities of components in the maps, single Gaussian models were fitted using task jmfit; where this was not possible the integrated flux was estimated using imstat or tvstat.
3 Results and Discussion
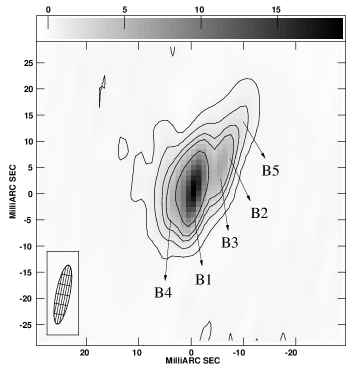
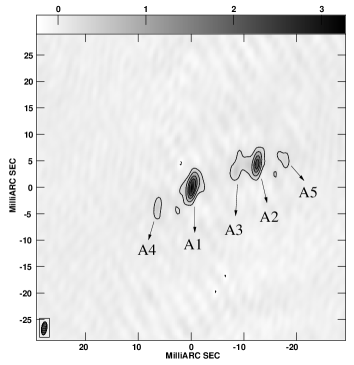
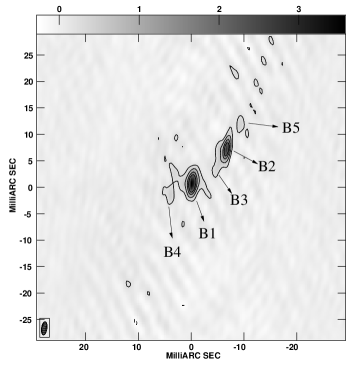
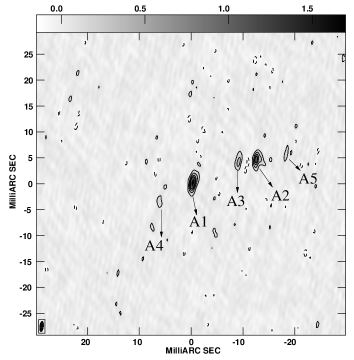
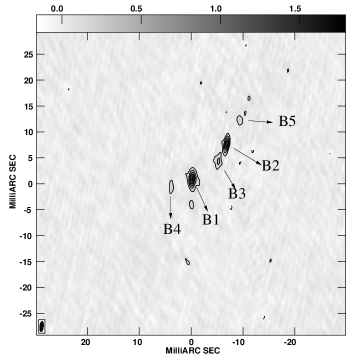
The maps at all 3 wavelengths are shown in Figure 2 (images A and B) and Figure 3 (region C). In addition to the 2 components noted by Koopmans et al (A1, A2, B1, B2) we identify in these higher resolution maps 3 new components (labelled 3, 4 and 5) in both A and B. The non-collinear line of the 5 components clearly demonstrates the opposite image parities of A and B.
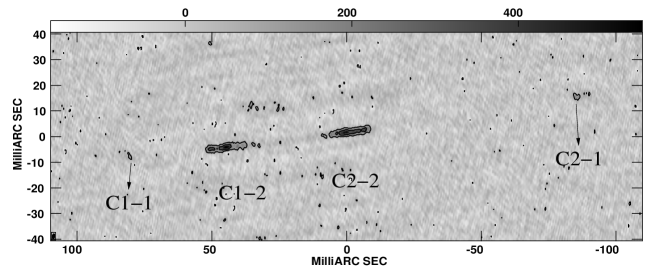
The 4 main components previously noted in region C are clearly seen at all wavelengths. The labelling of components in region C has been changed here to reflect the obvious symmetry between the left and right sides, and its interpretation as 2 merging images. Partial image C1 has components C1-1 and C1-2; their counterparts in C2 become C2-1 and C2-2.
Figure 4 shows the spectra of all 5 components in A (the corresponding components in B are essentially the same) and the 2 components in both partial images C1 and C2. All exhibit steep spectra except A2 (and B2), C1-2 and C2-2, which show flattened spectra between 18 and 6 cm. Following a standard description of extragalactic radio sources we would identify A2

![[Uncaptioned image]](/html/astro-ph/0701021/assets/x10.png)
![[Uncaptioned image]](/html/astro-ph/0701021/assets/x11.png)
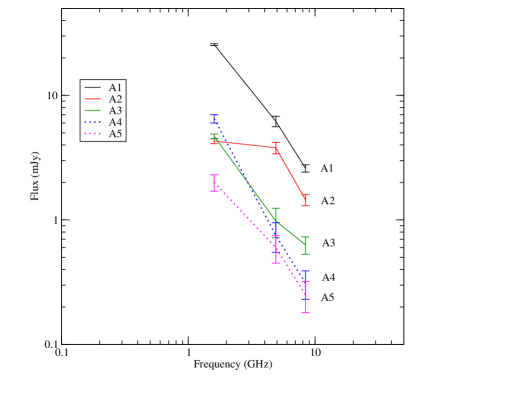
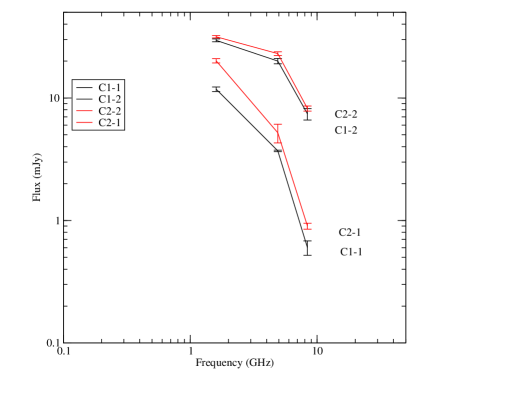
and B2 as the “core” of the radio structure, and expect this to coincide with the optical nucleus.
In the scenario of Koopmans et al, C1 and C2 are images of components in the background source which appear in the NW end of image A. The similar spectra of C2-2 (C1-2) and A2 (B2) suggests an identification of C2-2 with A2, and hence A5 with C2-1. As noted by Koopmans, however, models predict that C2-2 and C1-2 would be much more magnified than they appear, and the coincident optical nucleus would appear in C1 and C2. However, the data is consistent with a scheme whereby the diamond caustic passes A2, causing only a small part (not containing the small optical nucleus) to be quadruply imaged. From the gap between images C1 and C2 we deduce that A2 in fact consists of a line of smaller, flat-spectrum subcomponents, the caustic passing between 2 of them. Alternatively, C1 and C2 may correspond to further, faint components as yet undetected to the NW of A; however, this would require there to be 2 flat-spectrum, core-like components in the background source, which seems unlikely.
Acknowledgments.
This work was supported by the European Community’s Sixth Framework Marie Curie Research Training Network Programme, Contract No. MRTN-CT-2004-505183 ”ANGLES”.References
-
[1]
C. R. Lawrence C. R., et al. Discovery of a new gravitational lens system, Science 223 (1984) 46
-
[2]
D. P. Schneider, et al. Deep Optical and Radio observations of the gravitational lens system 2016+112, ApJ 294 (1985) 66
-
[3]
D. P. Schneider, et al. The third image, the redshift of the lens, and new components of the gravitational lens 2016 + 112,
AJ 91 (1986) 991
-
[4]
L. V. E. Koopmans, et al. 2016+112: a gravitationally lensed type II quasar, MNRAS 334 (2002) 39
-
[5]
C. R. Lawrence, et al. A K-band image of the gravitational lens system 2016+112, AJ 105 (1993) 17
-
[6]
M. B. Heflin, et al. First and second epoch VLBI observations of the gravitational lens system 2016+112, ApJ 378 (1991) 519
-
[7]
M. A. Garrett, et al. MERLIN observations of the gravitational lens system 2016+112, MNRAS 269 (1994) 902
-
[8]
M. A. Garrett, et al. Wide-field EVN observations of the gravitational lens system 2016+112, MNRAS 279 (1996) L7