Bulges and disks in the Host Galaxies of low redshift 3CR Sources: a near-IR view of their radial brightness profiles11affiliation: Based on observations made with the NASA/ESA Hubble Space Telescope (HST), obtained at the Space Telescope Science Institute, which is operated by the Association of Universities for Research in Astronomy, Inc., under NASA contract NAS 5-26555.
Abstract
We analyze the near-infrared luminosity profiles and photometric
parameters of the host galaxies of 3CR radio sources with ,
to investigate their physical nature. Our sample includes 82
galaxies, of which 22 (27%) are FR Is and 60 (73%) are FR IIs.
Using near-infrared data taken both with NICMOS onboard the Hubble Space Telescope
and from the ground with the Telescopio Nazionale Galileo,
we find that luminosity profiles are very well described by a single
Sérsic law in 52% of the cases and for the remaining objects (48%)
it is necessary to include an exponential profile, which could indicate the
presence of a disk. The average bulge to disk luminosity ratio for
the galaxies is .
The analysis of the photometric
parameters of the sub samples indicates that FR Is and FR IIs show
rather similar bulges in terms of effective surface magnitude, effective radius,
and Sérsic index.
On the other hand, disks in FR Is and FR IIs hosts show, on average,
different properties. Central surface magnitudes are dimmer and scale
lengths are greater by a factor of 2 in FR Is when compared
to FR IIs.
We also estimate the black
hole mass associated with each galaxy using two different methods that
claim tight correlations between the black hole mass () with
the infrared bulge luminosity () and with the Sérsic
index (). Our data indicate that masses obtained through these two
methods show a high dispersion and obtained through
are systematically higher (by a factor of 3) than
those obtained using . This result may reflect the
fact that for our sample galaxies we do not find any correlation
between and .
1 Introduction
Radio galaxies are a peculiar set of galaxies which give rise to a
number of questions regarding their nature: What kind of effects turn
these galaxies into radio galaxies? Are these effects related to
galaxy morphology or galaxy environment? What are the relations
between the properties of radio galaxies and the normal galaxy
population? Are these properties a result of the radio activity or
vice versa? In the framework of the AGN unification scheme (Urry &
Padovani 1995), radio galaxies are associated with quasars. Therefore
the study of such objects plays an important role to constrain
physical models of quasar evolution (Kauffmann & Haehnelt 2000), to
further test the unified models, and to explore the origin of radio
loudness (Blandford 2000).
Radio galaxies are usually classified into two morphological classes, edge-darkened FR Is and edge-brightened FR II (Fanaroff & Riley 1974), and this dichotomy corresponds to a (continuous) transition in radio power, which occurs at W Hz-1. In modern high resolution radio maps, FR Is are charachterized by bright jets near the radio “core” (centered on the host galaxy nucleus), while FR IIs have faint jets (mostly one-sided as a result of relativistic beaming effects) coupled with bright hot spots in the lobes, which mark the location where the jet impacts the ISM.
Optical studies of low-redshift radio galaxies have shown that radio galaxies of both classes are almost invariably associated with giant ellipticals, are generally found in regions of enhanced galaxy density such as clusters or dense groups, and often show signs of interaction (e.g. Zirbel 1997, Gonzalez-Serrano et al 1993). However, some differences between FR Is and FR II seem to be present. The most striking difference is related to the emission line properties of the two classes: while most (if not all) FR Is only show weak (narrow) emission lines, FR II can be distinguished into different sub-classes, according to their spectral properties (e.g. Laing 1994). In particular, the role of a subclass of low excitation FR II (LEG) has still to be fully established: the central engine and the environment of LEG appears very similar to that of FR Is (e.g. Chiaberge et al. 2002, Hardcastle & Worrall 2000), while the radio power and morphology are typical of FR II.
While the above topics are the subject of a number of papers, there are very few detailed studies on the photometric properties of the host galaxies of radio galaxies. Zirbel (1996a) analyzes the surface brightness profiles of the host galaxies of low-redshift powerful radio galaxies. This work suggests that FR Is exhibit a weak correlation between the size of the host galaxy and the radio power, and also leads to the conclusion that FR I and FR II inhabit a different population of host galaxies. More specifically, while FR Is are typically associated with cD galaxies, FR IIs are mostly associated with a subclass of elliptical called “N-galaxies”. In ground based images, N-class galaxies appear to have peaked radial brightness profiles, while in HST images it is clear that their peculiar profiles are explained by the presence of a bright quasar-like nucleus surrounded by a faint fuzz. Therfore, when deriving the host galaxy profiles, ground-based images are unreliable if a powerful nuclear source is present.
From an imaging study of a sample of radio-quiet quasars, radio-loud
quasars and radio galaxies, Dunlop et al. (2003) conclude that
spheroidal hosts become more prevalent with increasing nuclear
luminosity. For nuclear luminosities , the hosts of both
radio-loud and radio-quiet quasars are all massive ellipticals. They
also suggest that the basic properties of these hosts are
indistinguishable from those of quiescent, evolved, low-redshift
ellipticals of comparable mass.
The aim of this paper is to provide
valuable infrared photometric data of a sample of 82 3CR radio galaxies
and to compare these data with that obtained at other wavelengths for both
normal and radio galaxies.
To achieve this goal we use both ground-based and high angular resolution
HST data to properly disentangle the host galaxy from any other
component related to e.g. the AGN. The layout of the paper is as
follows. In Section 2 we summarize the sample selection and in
Section 3 we give details of the observations, image reduction and
point spread function determination. In Section 4 we present the
galaxy luminosity profiles and profile fitting. In Section 5 we
discuss the results and in Section 6 we analize these results from the
point of view of a different classification of the galaxies of the
sample. In Section 7 the black hole mass obtained through two
different methods is discussed. Finally, in Section 8 we summarize our
conclusions.
2 Sample selection
The sample of galaxies we analyze belongs to the Revised Third Cambridge Catalogue (3CR) (Bennet 1962a, 1962b). The 3CR catalog (Spinrad et al. 1985) is selected at 178 MHz, it includes the brightest radio sources in the northern sky ( Jy) and contains radio galaxies and quasars out to redshifts of . Since this catalogue is selected based only on the low-frequency radio properties of the sources, it is an excellent database to study the morphology and photometric attributes of the objects without any orientation bias. We chose all 3CR sources with with the primary goal of characterizing the radio galaxy hosts mostly free from the effects of dust. There is a total of 116 sources in the 3CR up to a redshift of 0.3, and we present here the photometric properties of 82 objects. These objects were randomly observed as part of a HST snapshot program 10173. Only 7 galaxies of the sample were observed as part of other programs. They are: 3C 84 (P 7330), 3C 264 (P 7882), 3C 293 (P 9726), 3C 305 (P 7853), 3C 317 (P 7886), 3C 338 (P 7453), and 3C 405 (P 7258). Table 1 lists the observed galaxies together with the observation date, right ascension and declination for epoch 2000, FR class (Fanaroff & Riley, 1974) and morphological classification.
We used the morphological classification from NED (Nasa/Ipac Extragalactic Database)
and Zirbel (1996, Paper II). As can be noted from Table 1 many of the host galaxies
(57%) still remain morphologically unclassified.
Most of the galaxies for which a classification is
available in the literature are ellipticals. Thirty four (72%) out of
the 47 morphologically classified galaxies are reported as
ellipticals, while 7 (15%) objects are classified as early
spirals and 6 (13%) as N type galaxies.
3 Observations and data processing
We use two different sets of near-infrared data: HST/NICMOS and
Telescopio Nazionale
Galileo (TNG) data. HST data are essential to derive the radial
brightness profile of galaxies located at and particularly
for those with a bright nucleus that outshines the host galaxy
stellar emission. TNG images are crucial for nearby galaxies () which in general are much larger than the NIC-2 field of
view and for which a direct measure of the background level is not
feasible with the HST data alone. In the following we give a brief description of the
datasets and the data analysis procedures.
3.1 HST Observations
All objects in our sample were observed with NICMOS Camera 2 (NIC2) that has a field
of view of and a projected pixel size
of . All images were obtained using the F160W filter
(similar to the standard band) and have the same total
exposure time of 1152 seconds. For only a few exceptions exposure times
were shorter. These are: 3C84, 3C264, and 3C317 for which exposure times
were 640, 448, and 640 seconds respectively.
A more detailed technical description of the observations
can be found in Madrid et al. (2006) (hereafter M2006).
We obtained the HST/NICMOS data from the
Multimission Archive at the STScI (MAST). The data was
processed by standard OTFR (On The Fly Reprocesing)
calibration pipeline. We performed two corrections subsequent to the
calibration pipeline: the removal of the pedestal effect and the
masking of the coronographic spot. Bad columns and bad pixels were masked
out too. The pedestal effect is stochastic noise introduced during
the detector readout (Noll et al., 2004). Each of the
quadrants of the detector have a different offset. One in particular, appears darker
when compared to the others. We remove this effect using the IRAF task
pedsub, in the Space Telescope Science Analysis System
(STSDAS). NIC2 has a hole to allow coronographic observations, this
hole produces a spot on our images and therefore we mask this spot
before image combination. Information is recovered using the 4-dither pattern
used for the observations. We combine the four exposures
using the Pyraf task multidrizzle also in STSDAS (Koekemoer
& Fruchter, 2002). The final image is the output of multidrizzle, in units of s-1. During our data reduction
we preserve both the original sky level and the original pixel size of
.
For the photometric calibration of the reduced data
we used the formula of Dickinson et al. (2002) to derive a Vega-normalized
magnitude for F160W (NIC2). We then have m(F160W) = -2.5 log [PHOTFNU
CR/(Vega)] = 22.107 - 2.5 log (CR),
where PHOTFNU = Jy s DN-1, and CR is the count rate in
DN s-1. The flux density of Vega in the F160W band for NIC2 is
(Vega) = 1043.5 Jy. These magnitude units are different
from the ST instrumental magnitudes used by M2006. We chose the Vega system
because it is more similar to the standard ground based near-IR system,
and for the F160W filter the difference between Vega-mag and ST-mag
corresponds to 3.68 mag.
A visual inspection of our final
images revealed that the amplifier glow effect residuals were not
negligible. The amplifier glow is caused by the readout
amplifier situated close to each corner of the detector, and even
after the correction was applied we noted that residuals for most
cases were around 10% to 20% above the background level. We trim the
border of the images to obtain accurate surface photometry and
eliminate the amplifier glow. The resulting final field of view
is .
3.2 TNG data
We have used the images taken by Marchesini et al. (2005). These images were obtained with the 3.6 m
Telescopio Nazionale Galileo (TNG), the Italian national facility located at La Palma Island (Spain). These observations
were made in two runs on Jul. 8-12, 2000 and on Feb. 9-13, 2001. ARNICA (ARcetri Near Infrared CAmera) was used
in the first run and NICS (Near Infrared Camera Spectrometer) was used in the second run.
ARNICA uses a pixel NICMOS 3 array with a pixel size of and a total field of view (FoV)
of which is more than 5 times greater than the FoV of the HST NICMOS camera 2.
On the other hand, NICS uses a Rockwell HgCdTe Hawaii array. NICS has two modes
available, the small field mode with a pixel size of and a FoV of ,
and the large field mode in which the pixel size and FoV are doubled.
For both ARNICA and NICS observations the filter was used. This filter has a central wavelength of
and a of . For NICS the total integration times of 20 min were used, while for ARNICA
total integration times ranged from 5 to 24 min depending on the source. More detailed information about the individual
observations are listed in Table 3 of Marchesini et al. (2005).
3.3 Background subtraction and PSF modeling
Since suitable fitting of radial profiles at low surface brightness
levels is a delicate task, we are extremely cautious in the
determination of the background level and its uncertainty. First of
all, most of the galaxies with cover the whole field-of-view
of HST/NICMOS, therefore the background cannot be measured directly.
Furthermore, a detailed analysis of the background level for the rest
of the galaxies with smaller apparent diameter (those with ),
shows that the background is not constant. In fact, background
variations among these images can be as large as 40% or more, which
makes it impossible to remove it using a common value for all images.
Therefore, each image of the galaxies are to be carefully
examined in order to determine the proper background level. However, our
analysis shows that, in each image, a constant value across the whole
detector’s field-of-view is accurate enough to remove the
background. For those images where this task was possible,
background removal left residuals not higher than 5%.
For galaxies
with the approach is completely different. Since we are not
able to determine the background on NICMOS images given that these
galaxies cover the whole chip, we use ground based -band images
taken with the TNG. Because of the much larger field of view, these
images allow us to easily determine the sky level and also to
obtain accurate luminosity profiles in the external regions of the
galaxies. The next step is to simply determine the adequate offset in
order to match the luminosity profiles obtained from the HST images
with those obtained from the TNG. The matching was done in a
intermediate region of the luminosity profiles, avoiding the innermost
regions of the TNG profiles, where seeing effects are important, and
avoiding the outermost region of the HST profiles where background
effects are noticeable. We find that zero points needed to match HST
profiles with TNG profiles are surprisingly constant over the
observation dates and the estimated errors were less that 0.05
. Finally, we assume that the color gradient is
null for our galaxies and then we subtract the adequate background level on
the HST images in order to match the outermost part of the HST
profiles with those obtained from the TNG images. The assumption of
null color gradient is supported by the fact that we do not detect any
color gradient for the galaxies with , where an accurate
background determination on both the TNG and the HST images is
possible. Further support to this assumption is found in Möllenhoff & Heidt (2001) (hereafter M&H2001). These authors showed
that in a sample of 40 bright spiral galaxies the structural
parameters for both the bulge and the disk components are identical
for filters, within the error they estimate from the data.
PSF
modeling for NIC2 is well described by Suchkov & Krist (1998)
and references therein. PSF diffraction structures, such as Airy rings
and spikes, grow larger with increasing wavelength and therefore one
must be very cautious when using infrared images. In our case, only a
few cases show a bright nuclear source which causes bright PSF
diffraction patterns on the images. In order to get rid of these
patterns we have used the Tiny Tim modeling software (Krist, 1993) to
create suitable PSF models for each of the selected images. These
models were then subtracted from the individual images. This
procedure works well in most images, if larger residuals were
noticed they were properly masked before any isophote
fitting. Besides, during the fitting procedure we also discarded the
inner 3 pixels () of the obtained luminosity profiles.
This additional consideration avoids any fitting contamination related
to the PSF subtraction (see Section 4).
4 Luminosity profiles and fitting functions
There are numerous methods for extracting luminosity profiles. The variety includes one-dimensional analysis (Bagget et al. 1988), ellipse fitting to the isophotes of the galaxies (Héraudeau & Simien 1996) and two-dimensional analysis (Byun & Freeman 1995). At first glance our infrared images show mostly elliptical galaxies with no trace of any further structures, and in a few cases (20%) we can detect dust lanes, jets or plumes. Therefore, we are mostly working with axisymmetric structures which can be easily analized with azimuthal isophote fitting. For this purpose, we use the ellipse routine within STSDAS (Jedrzejewski 1987). Before extracting the galaxy profile, we carefully mask all spurious objects such as stars, and residual diffraction patterns.
In the case of two galaxies overlapping, once we obtain the luminosity profile and
structural parameters (center coordinates, ellipticity, and position angle of the
isophotes), we construct a model galaxy using bmodel
(within STSDAS) that is subtracted from the original image. The
resulting image is then used to extract the luminosity profile of the
remaining galaxy. This process is repeated several times until the
luminosity profiles of both galaxies converge.
Isophote fitting was performed up to a count
level of 2 i.e., we stopped the fitting procedure when
the isophote level is around twice the background dispersion, which
corresponds to a surface magnitude of = 21.8
on the HST/NICMOS images. This procedure is used to derive the
luminosity profiles from both the TNG and the HST images.
4.1 Profile fitting
Similarly to profile extraction, luminosity profile fitting can be done using a wide variety of functions. The most common functions are the classical de Vaucouleurs profile (de Vaucouleurs, 1948), the exponential profile (Freeman, 1970), and the most general Sérsic profile (Sérsic, 1968). Generally, the profile describes very well the luminosity profile of bulges, while the exponential profile is used to fit the luminosity profile of disks. However, it was recently found that the function does not describe the bulge profile for many ellipticals correctly. Therefore, many authors use the more general profile, as is the case for Brown et al. (2003). However, for 45% of our sample galaxies, we find that a single Sérsic profile still cannot fit the data. Therefore, we try a more general case using two Sérsic profiles in order to fit the inner and outer regions of the luminosity profiles respectively. We find that the outer profile regions are well fitted with a Sérsic index , equivalent to an exponential disk. The adopted fitting function has only 5 free parameters and can be written in the following form:
| (1) |
In the above equation the first term corresponds to the Sérsic
profile, where is the intensity at , and is the
radius that encloses half of the total luminosity of the bulge (also
known as the effective radius). For , can be approximated
(with an error smaller than 0.1%) by the relation
(Ciotti 1991). The second term corresponds to the exponential
profile, where is the central intensity and is the
length scale. However, as is pointed out by de Jong et al. (2004) the
exponential luminosity profile does not prove that these galaxies have real disks.
Kinematic data is required to confirm the presence of a disk in any
individual galaxy.
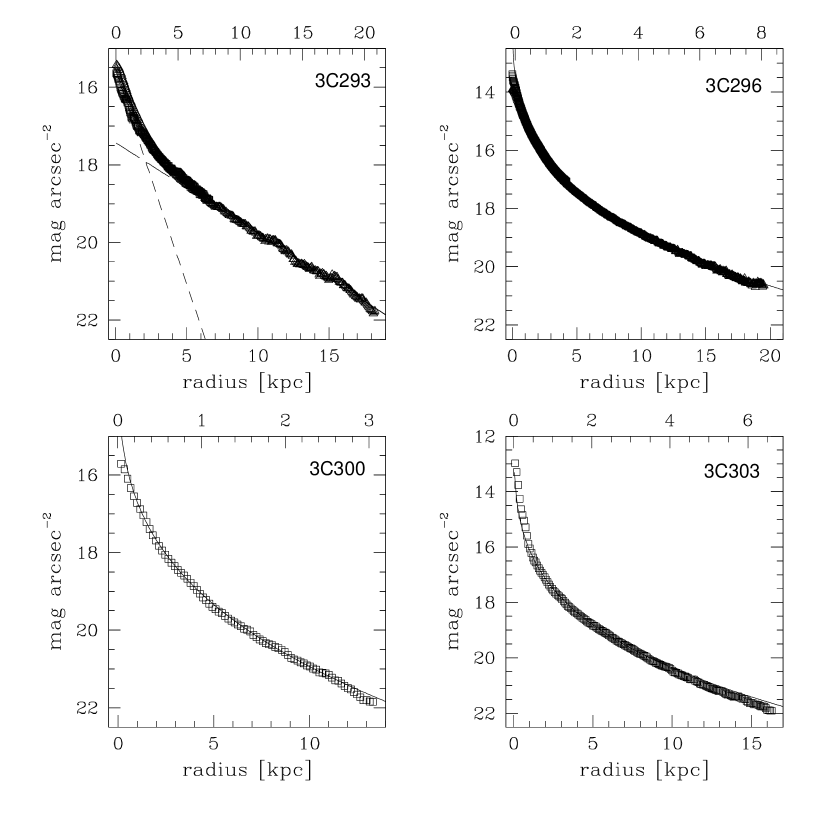
Figures 1a through 1s show the luminosity profile for
all the galaxies of our sample. In these figures NICMOS data are
represented by squares while data from TNG are represented by
triangles. The fitting functions are also displayed for the bulge
(short dashed), disk (long dashed) and the sum of both components
(continuum line). The radius is in Kpc (horizontal bottom axis) and
(horizontal upper axis).
Parameters described in the above equation were obtained
using the nfit routine within STSDAS (Schombert & Bothun 1987).
The fitting procedure is carried out only in the
portion of the galaxy surface brightness profiles. This is done to
exlude the regions in the faint end of the luminosity profiles, in
which the error is large and the information is poor. We also excluded
the inner 3 pixels () of the luminosity profiles in order to avoid
any contamination resulting from the PSF subtraction. The errors on the parameters are
calculated following the method described by Coenda
et al. (2005). Briefly, this technique consists in creating test
images to which we artificially add and subtract a constant value
corresponding to . We then extract the new luminosity
profile as explained above and we fit it with Equation 1.
These newly obtained parameters give us the respective upper and lower
limits for the parameters.
Intensity parameters are then converted into surface brightness,
expressed in by the equation , while
units of , and are converted to Kpc. Measured errors for
and are smaller than 15% while for , and are
below 0.20 . Total luminosities of both the bulge
and the exponential components are finally computed using the derived
photometric parameters and integrating separately both terms of
eq. 1 as follows:
| (2) |
which yields:
| (3) |
for the bulge component, and
| (4) |
for the exponetial component. is the gamma
function. Note that eq. 2 assumes that the galaxy is
face on. Therefore, the intensities in eq. 1 were
corrected by inclination as in Kent (1985). Total apparent magnitudes
were then converted into absolute magnitudes. Throughout this paper
we assume a Hubble constant = 71
together with = 0.27 and = 0.73.
5 Results and discussion
Table 2 lists the photometric parameters obtained through the
procedures described in the previous sections for all sample galaxies.
Columns 1, 2, and 3 list the source name, the ellipticity and
redshift, respectively. Bulge parameters , and are
listed in columns 4, 5, and 6, while columns 7 and 8 list disk
parameters (inclination corrected) and . Finally, columns
9, 10, 11, and 12 list the bulge absolute magnitudes, disk absolute
magnitudes, total galaxy magnitudes and bulge to disk ratio.
Forty
three out of 82 galaxies (52%) show a single Sérsic luminosity
profile type. The remaining 39 galaxies (48%) have luminosity
profiles that have to be fitted with a combination of a Sérsic
profile plus an exponential profile. Among FR Is, 10 out of 22 galaxies (45%) show
single luminosity profiles, while 12 (55%) show bulge+disk type profiles.
FR IIs, show 33 out of 60 galaxies (55%) with single Sérsic luminosity profiles,
and 27 galaxies (45%) with bulge+disk type profiles.
However, we also have 4 interesting
cases: 3C28, 3C129.1, 3C184.1 and 3C388. These galaxies show . This is somewhat reminiscent of the so-called pseudo-bulges recently
discovered in some spiral galaxies.
Pseudobulges are formed through secular evolution of galaxies. In
other words, the bulge is formed from disk evolution, allowing the
direct formation of bulges from disks in isolated galaxies (Kormendy & Kennicutt 2004).
Unfortunately, we do not have enough information, such as velocity dispersions, to
confirm this possibility.
3C348 is another interesting case since this galaxy has
a single Sérsic profile with = 0.93 which indicates it is a
bulgeless galaxy.
This result is unexpected since, as was pointed out in Section 2, most of
these galaxies are simply reported in the literature as ellipticals.
However, it is not clear whether or not the exponential profile is the
signature of a disk in all of them.
To investigate if these are real disks, we have plotted in Fig. 2a-d
the distribution of ellipticity for all galaxies of the sample.
We differenciate between galaxies that show a single Sérsic
luminosity profiles and those that show bulge+disk luminosity
profiles, and also between galaxies classified as FR I and FR II.
Histograms are plotted in
bins of . Galaxies that show a single
luminosity profile (panel d) display a distribution in ellipticity
which is rather similar to that displayed by a population of normal
elliptical galaxies, which has been shown to peak at
(Sandage, Freeman & Stokes 1970; Ryden 1992). For such a sub-sample
we obtain an average ellipticity = 0.180.08. The average
ellipticity for galaxies that also show an exponential component in their
luminosity profiles (panel d dashed line) is instead =
0.240.10. A Kolmogorov-Smirnov (K-S) test applied to these sub
samples indicates that these two data sets do not have different ellipticity distributions.
We also note that there are no differences between FR Is (panel b) and
FR IIs (panel c) ellipticity distributions. We obtain = 0.21
and 0.20 for FR I and FR II galaxies respectively.
Figure 3a shows the total absolute magnitude distribution for all
galaxies of the sample. Again, we have differenciated between
FR I (panel b) and FR II sources (panel c), and also between galaxies
with a single Sérsic luminosity profile (d). Total luminosity
distributions for all the classes look similar.
For the whole sample it peaks at
= -25.4 0.7, while for FR I and FR II sub samples
separately these values are = -25.6 0.7 and
= -25.3 0.6, respectively. The K-S test
applied to FR I and FR II data sets indicates that the magnitude
distributions are not statistically different.
We have made a similar analysis for bulge and disk photometric
parameters for the whole sample as well as for the FR I and FR II sub
samples. The average values for the photometric parameters together
with their standard deviations are listed in Table 3. FR I and FR II
bulges have similar properties in terms of their photometric
parameters, , , and . The Sérsic index average
value is = 0.40 0.18 for FR I galaxies, while for the FR II
sub sample it is = 0.33 0.08. However, the K-S test indicates that
the distributions of the Sérsic index for FR I and FR II are not statistically different.
FR I and FR II disks show some interesting differences. As reported in Table 3, the FR Is’ scale length () is on average a factor of two larger than that of FR IIs, although the spread in is large, thus they are consitent within . Similarly, the central surface magnitude () is 0.6 mag dimmer in FR I galaxies, but again consistent with that of FR IIs within . Interestingly, the K-S tests applied to these data indicates that the and distributions are statistically different at 98% and 99.9% confidence level for FR I and FR II galaxies respectively. We also find that the mean total disk magnitudes are = -25.1 0.6 and = -24.6 0.6. However, in this case the K-S test does not indicate that the the distributions are statistically different.
Finally, the bulge to disk luminosity ratio is = 0.80.4 for FR Is while it is = 1.30.8 for FR IIs. K-S test does not indicate these data sets are statistically different.
5.1 Correlation of structural parameters
The study of correlations between photometric parameters is a good
tool to understand the structure of galaxies and their evolution.
Many scaling relations for galaxies have been discovered this way,
such as the fundamental plane (Djorgovski & Davis 1987, Dressler et al. 1987) for
elliptical galaxies and the Tully-Fisher (1977) relation for
spirals.
The correlations between structural parameters for both
bulges and disks obtained for our sample are plotted in Fig. 4. Empty
triangles represent FR IIs while filled squares represent FR Is.
Panels a and b show the effective surface magnitude ()
and the bulge total absolute magnitude () plotted against
the logarithm of the effective radius () in Kpc. From these
plots we see a clear correlation between these parameters, in the
sense that large bulges have a lower effective surface magnitudes and
higher total luminosities. The first correlation is the Kormendy
relation (Kormendy 1977) for bulge galaxies. A linear regression
applied to these data gives:
= 16.6() + 3.2() log(/Kpc)
= -23.6() - 2.0() log(/Kpc)
The slope for the vs. regression is quite similar to that
obtained by Veilleux et al. (2006) for a sample of 33 luminous, late
stage galactic mergers and also to that obtained by Dunlop et al.
(2003) for their sub sample of radio loud quasars. The vs.
relationship for these type of galaxies shows a steeper slope to
that found for normal ellipticals (Pahre, 1999).
When this analysis is only applied to FR Is we obtain:
= 16.7() + 2.5() log(/Kpc)
= -23.2() - 2.6() log(/Kpc)
While for FR IIs we have:
= 16.7() + 3.4() log(/Kpc)
= -23.7() - 1.9() log(/Kpc)
These results indicate that FR Is and FR IIs have similar Kormendy
and vs. log() relations, which is in agreement with
the result of Dunlop et al. (2003). These authors find similar Kormendy relations
for a sample of 13 radio-quiet quasars, 10 radio-loud quasars and 10 radio galaxies.
We also investigate the correlations for disks photometric parameters.
Results are shown in Figs. 4c and 4d. Disk parameters show the same trend as seen for
bulge parameters. More explicitely, large disks have a lower central
surface magnitude and have higher total luminosities. However, in
this case the data show a larger dispersion than that observed for the bulges.
Linear regression fits applied to these data yield the following
results:
= 16.5() + 2.0() log(/Kpc)
= -22.8() - 2.6() log(/Kpc)
Intriguingly , these results are similar to those obtained by M&H (2001) for the disk components of a sample of 40 bright spiral galaxies. This result could give further support to the idea that exponential profiles in these galaxies are truly due to the presence of a disk. However, as it is pointed out by de Jong et al. (2003), this exponential distribution of light might not be in a disk configuration flattened by rotation as disks of spiral galaxies are.
6 FR Is, LEGs, HEGs, and QSOs
The FR I and FR II classification is only based on the radio morphology of the source. We then chose another classification scheme which relies on the spectroscopic properties, and is more likely to reflect the physical properties of the central AGN. In particular, we adopt the scheme defined by Jackson & Rawlings (1997). They classify high and low ionization narrow-lined galaxies (HEG and LEG) on the basis of the equivalent width (EW) of the [OIII]5007 emission line and/or the [OII]/[OIII] ratio. Galaxies with [OII]/[OIII] 1 and/or EW are defined as LEG (Low Excitation Galaxies). Similarly, quasars (QSO) are defined as those sources for which at least one broad line has been observed. We find in our sample 22 FR Is (corresponding to 27% of the sample), 22 LEGs (27%), 24 HEGs (29%), and 13 QSOs (16%). Only two FR II objects remain unclassified (3C 277.3 and 3C 346). As we pointed out in Section 5, 55% of FRI galaxies show bulge + exponential type profiles, which is identical to the percentage obtained for LEGs. HEGs show less galaxies with bulge + exponential profiles (43%), while QSOs have only 31% of the galaxies with the exponential component. It is interesting to note that even if the FR I classification is based on the radio morphology, it is known that most, if not all, FR I galaxies are weak lined LEGs (Hine & Longair, 1979; Laing, 1994).
Summarizing, we divide our objects into the following spectral classification scheme: FR Is, LEGs, HEGs and QSOs, and we investigate the statistical properties of the host galaxies under this classification. Table 4 lists the photometric parameters for each of these galaxy classes. All of them have bulges with similar average photometric properties, and even if FR Is have on average greater Sérsic indexes ( = 0.40 vs. 0.34) the Kolmogorov - Smirnov test applied to these data does not indicate that the distribution for FR I bulges is statistically different from that of LEGs, HEGs or QSOs.
Differences between these classes arise when we compare disk photometric parameters. FR Is have on average larger disks ( = 8.2 Kpc) and dimmer central surface magnitude () than those of LEGs ( = 17.5, = 4.3), HEGs ( = 17.5, = 3.6), and QSOs ( = 17.5, = 4.2). However, statistical tests applied to the distributions show that FR Is differentiate only from HEGs and QSOs(99% confidence level) and not from LEGs. Same tests applied to data of these classes reveal that FR Is have a different distribution when compared with those of LEGs, HEGs and QSOs (99% confidence level). In other words, these results are similar to those obtained in the previous section. They suggest that, from a photometric point of view, FR Is are slightly different from LEGs, and these differences become stronger when FR Is are compared to HEGs and QSOs. We also ran statistical tests comparing FR Is + LEGs to HEGs + QSOs. Results were similar to those described above but with a slightly less statistical significance (98% level). We find that FR Is + LEGs have on average and Kpc, while HEGs + QSOs have and Kpc.
7 Black hole mass vs. bulge near infrafred luminosity and Sérsic index
Recent studies suggest that central super massive black holes
(SMBH) reside in all galaxies with a bulge, as a result of past quasar
activity (Aller & Rischstone 2002, and references therein). Moreover,
SMBH are claimed to be related to the host galaxy properties and
therefore this implies that SMBH and galaxy formation and evolution are closely
correlated. Kormendy & Richstone (1995) showed that the mass of the SMBH is
correlated (with a considerable scatter) with both bulge luminosity and
bulge mass. This result was later confirmed and strengthened by
Magorrian et al. (1998) for a sample of nearby galaxies with kinematic
data.
On the other hand, it has also been shown that
correlates with the Sérsic index (Graham et al. 2003, and
references therein). These authors claim that the scatter of the
relation is equivalent to the relation
(Ferrarese & Merrit, 2000; Tremaine et al 2002) and it has the
additional advantage of requiring only galaxy images rather than
spectra.
The superb quality of HST/NICMOS images, together
with ground based information for nearby objects, allows us to
determine and with high accuracy. Therefore we can
estimate the black hole mass for each galaxy of the sample using both
relations, and check whether the results are consistent. First of all we
use the following relation with . as taken from Marconi &
Hunt (2003):
log() = 8.04 + 1.25 (log() - 10.8)
where is the mass of the black hole and is the total bulge luminosity in the H band in solar units.
Secondly, we use the Graham & Driver (2006) relation:
log() = 2.68 log(1/3) + 7.82
where is the Sérsic index as expressed in Equation 1. We estimate the mass of the central black hole using the values of and as listed in Table 2, and the results are reported in Fig. 5. In the figure, empty triangles and squares represent FR I and FR II populations, respectively. The data show a large dispersion and the results obtained through these methods differ on average by a factor of three. We also used the quadratic relation instead of the linear one given by Graham & Driver (2006) and no major differences were observed. This result might reflect the fact that we do not find any correlation between and . As can be seen in Fig. 6, neither FR I nor FR II bulge luminosities correlate with the Sérsic index. Note that similar bulge luminosity and distributions for FR Is and FR IIs also imply similar distribution for both sub samples.
8 Conclusions
We have analyzed the infrared photometric parameters of 82 galaxies belonging to the 3CR Catalogue.
From the morphological point of view most of these galaxies are not yet
classified, and classified galaxies are mostly ellipticals. Nevertheless, we find that only 43 (52%) of the galaxies
have a single component luminosity profile.
The remaining 39 galaxies (48%) need a second component with = 1 suggesting the idea that these
galaxies have an exponential disk. However, we cannot confirm this possibility without additional kinematical information.
When FR Is and FR IIs are differenciated we find the following results:
1) Forty five percent of FR Is show single luminosity profile while for FR IIs this percentage is 55%.
Reciprocally, 56% of FR I galaxies show bulge+exponential type profiles compared to 44% of FR II galaxies.
2) Analysis of the photometric parameters of both FR I and FR II galaxies indicates that they have similar
bulge and disk magnitudes. Moreover, both FR I and FR 2 bulges follow similar Kormendy relations.
Even so , if we consider the exponential component we have that FR Is have,
a) dimmer central surface magnitudes and, b) much larger scale lengths than FR IIs.
K-S tests applied to the and distributions confirm these results at confidence level.
We also choose another classification scheme which relies on the spectroscopic properties, and is
more likely to reflect the physical properties of the sources.
We divided the sample galaxies in 4 groups, FR Is, LEGs, HEGs and QSOs. The results of the analysis were
similar to those obtained with the previous classification. FR I galaxies show again for the exponential component
dimmer central surface magnitudes and much larger scale lengths than the rest of the
selected classes ( confidence level). However, we also find that these differences are less
conspicuous when FR Is are compared to LEGs.
Black hole masses were also calculated using two different methods,
using the Sérsic index and the bulge total luminosity. Results show a great dispersion and black hole
masses obtained through are on average a factor of 3 higher than those obtained
through . This result is not surprising since we did not find a clear correlation between
and .
Summarizing, past results on the host galaxies of FR I and FR II sources gave confusing results on
their properties and morphologies. Thanks to the HST/NICMOS data we can now probe deeply
into the nuclear regions of the hosts and we can clearly distinguish the contributions from the host
galaxies and the nuclear sources. We show that the host galaxies have very similar bulge properties
while there seems to be a real difference in the properties or presence of disks.
These results indicate that the formation histories of the different classes of radio galaxies may
be significantly different.
DM is supported by NASA LTSA NNG04GE12G.
This research has made use of the NASA Astrophysics Data System Bibliographic services. This research also made use made use of the NASA/IPAC Extragalactic Database (NED) which is operated by the Jet Propulsion Laboratory, California Institute of Technology, under contract with the National Aeronautics and Space Administration.
References
- Aller & Richstone (2002) Aller, M. C., & Richstone, D. 2002, AJ 124, 3035
- Bagget (1998) Bagget, W. E., Bagget, S. M., & Anderson, K. S. J. 1998, AJ, 116, 1626
- Bennett (1962) Bennett, A. S. 1962a, Mem. RAS, 68, 163
- Bennett (1962) Bennett, A.S. 1962b, MNRAS, 125, 75
- Blandford (2000) Blandford, R.D. 2000, RSPTA, 358, 811
- Brown et al. (2003) Brown, R.J.N., Forbes, D.A., Silva, D., Helsdon, S.F., Ponman, T.J., Hau, G.K.T, Brodie, J.P., Goudfrooij, P, & Bothum, G. 2003, MNRAS, 341, 747
- Byum (1995) Byum, Y. I. & Freeman, K. 1995, ApJ, 448, 563
- chiaberge (2002) Chiaberge, M., Capetti, A, Celotti, A. 2002, A&A, 394, 791
- Ciotti (1991) Ciotti, L. 1991, A&A, 249,99
- deJong (2004) de Jong, R.S., Simard, L., Davies, R.L., Saglia, R.P., Burstein, D., Colless, M., McMahan, R., & Wegner, G. 2004, MNRAS, 355, 1155
- de Vaucouleurs (1948) de Vaucouleurs, G. 1948, Ann. d’Astrophys., 11, 247
- Dickinson (2002) Dickinson, M.E., et al. 2002, HST NICMOS data handbook v5.0, ed. B. Mobasher, Baltimore, STScI
- Djorgovski (1987) Djorgovski, S. & Davis, M. 1987, ApJ, 313, 59
- Dressler (1987) Dressler, A., Lynden-Bell, D., Burstein, D., Davies, R. L., Faber, S. M., Terlevich, R., & Wegner, G. 1987, ApJ, 313, 42
- Dunlop (2003) Dunlop, J.S., McLure, R.J., Kukula, M.J., Baum, S.A., O’Dea, C.P., & Hughes, D.H. 2003, MNRAS, 340, 1095
- Fanaroff (1974) Fanaroff, B. L. & Riley, J. M. 1974, MNRAS, 167, 31
- Ferrarese & Merrit (2000) Ferrarese, L., & Merrit, D. 2000 ApJ, 539, L9
- Freeman (1970) Freeman, K. C. 1970, ApJ, 160, 811
- Graham et al. (2003) Graham, A.W., Erwin, P., Caon, N., & Trujillo, I. 2003, in Galaxy Evolution: Theory and Observations, RevMexAA (SC), eds ., V. Avila-Reese, C. Firmani, C.S. Frenk, & C. Allen, Vol 17, 196-197
- Graham & Driver (2006) Graham, A.W., & Driver, S.P. 2006 astro-ph/0607378
- Gonzalez-Serrano (93) Gonzalez-Serrano, J.I., Carballo, R., Perez-Fournon, I. 1993, AJ, 105, 1710
- Hardcastle (2000) Hardcastle, M.J., & Worrall, D.M. 2000, MNRAS, 319, 562
- Heraudeau (1996) Héraudeau, P., & Simien, F. 1996, A&AS, 118, 111
- Hine (1979) Hine, R.G., & Longair, M.S. 1979, MNRAS, 118, 111
- Jackson&Rawlings (1997) Jackson, N., & Rawlings, S. 1997, MNRAS, 286, 241
- Jedrzejewski (1987) Jedrzejewski, R. 1987, MNRAS, 226, 747
- Kauffman (2000) Kauffmann, G., & Haehnelt, M. 2000, MNRAS, 311, 576
- Krist (1993) Krist, J. 1993, in ASP Conf. Ser. 52, Astronomical Data Analysis Software and Systems II, ed. R.J. Hanisch, R.J.V Brissenden, & J. Barnes (San Francisco: ASP), 536
- Koekemoer (2002) Koekemoer, A. M., Fruchter, A. S., Hook, R. N., & Hack,W. 2002, in The 2002 HST Calibration Workshop: Hubble after the Installation of the ACS and the NICMOS Cooling System, ed. S. Arribas, A. Koekemoer, & B. Whitmore, Baltimore, STScI, 339
- Kormendy (1977) Kormendy, J. 1977, ApJ, 218, 333
- Kormendy & Richstone (1995) Kormendy, J., & Richstone, D. 1995, ARA&A, 33, 581
- Kormendy & Kennicutt (2004) Kormendy, J., & Kennicutt, R. C. Jr. 2004, ARA&A, 42, 603
- Laing (1983) Laing R. A., Riley J. M., & Longair M. S. 1983, MNRAS, 204, 151
- Laing (1994) Laning, R.A. 1994, ASPC, 54, 227
- Madrid, J. P., et al. (2006) Madrid, J. P., et al. 2006, ApJS, 164, 307 (M2006)
- Magorrian et al. (1998) Magorrian, J. et al. 1998, AJ, 115, 2285
- Marchesini (2001) Marchesini, D., Capetti, A., & Celotti, A., 2005, A&A 433, 841
- Marconi & Hunt (2003) Marconi, A. & Hunt, L.K. 2003, ApJ, 589, L21
- Mollenhoff (2001) Möllenhoff, C. & Heidt, J. 2001, A&A, 368, 16 (M&H2001)
- Noll, K., et al. (2004) Noll, K., et al. 2004, NICMOS Instrument Handbook, Version 7.0, (Baltimore: STScI)
- Pahre (1999) Pahre, M.A. 1999, ApJS, 124, 127
- Ryden (1992) Ryden, S. 1992, ApJ, 396, 445
- Sandage (1970) Sandage, A. R., Freeman, K. C., & Stokes, N. R. 1970, ApJ, 160, 831
- Sérsic (1968) Sérsic, J. L. 1968, Atlas de Galaxias Australes (Córdoba: Obs. Astron.)
- Suchkov (1998) Suchkov, A. & Krist, J. 1998, Instrument Science Report NICMOS 98-018 (Baltimore: STScI)
- Tully (1997) Tully, R. B. & Fisher, J. R. 1977, A&A, 54, 661
- Urry (1995) Urry, C.M., & Padovani, P. 1995, PASP, 107, 803
- Zirbel (1996) Zirbel, E.L. 1996, ApJ, 473, 144 (Paper a)
- Zirbel (1996) Zirbel, E.L. 1996, ApJ, 473, 713 (Paper b)
- Zirbel (1997) Zirbel, E.L. 1997, ApJ, 476, 489
| Source | Date (UT) | FR Class | Morph. Class. | ||
|---|---|---|---|---|---|
| (1) | (2) | (3) | (4) | (5) | (6) |
| 3C17 | 2006 Jul 2 | 00 38 20.5 | -02 07 41.0 | II (QSO) | E pec |
| 3C20 | 2005 Feb 27 | 00 43 09.27 | +52 03 36.66 | II (HEG) | — |
| 3C28 | 2005 Jun 13 | 00 55 50.65 | +26 24 36.93 | II (LEG) | E |
| 3C31 | 2005 Jun 17 | 01 07 24.99 | +32 24 45.02 | I | BCG; SA0- |
| 3C33.1 | 2004 Aug 15 | 01 09 44.27 | +73 11 57.2 | II (QSO) | — |
| 3C35 | 2005 Mar 16 | 01 12 02.29 | +49 28 35.33 | II (LEG) | — |
| 3C52 | 2005 Mar 11 | 01 48 28.90 | +53 32 27.9 | II (LEG) | — |
| 3C61.1 | 2004 Aug 9 | 02 22 36.00 | +86 19 08.0 | II (LEG) | — |
| 3C66B | 2004 Nov 5 | 02 23 11.46 | +42 59 31.34 | I | E |
| 3C75N | 2004 Nov 11 | 02 57 41.55 | +06 01 36.58 | I | E0 |
| 3C76.1 | 2005 Feb 6 | 03 03 15.0 | +16 26 19.85 | I | E1? |
| 3C79 | 2004 Oct 30 | 03 10 00.1 | +17 05 58.91 | II (QSO) | E |
| 3C83.1 | 2005 Mar 12 | 03 18 15.8 | +41 51 28.0 | I | E+ |
| 3C84 | 1998 Mar 16 | 03 19 48 | +41 30 42 | I | cD pec |
| 3C88 | 2004 Nov 6 | 03 27 54.17 | +02 33 41.82 | II (LEG) | E pec? |
| 3C98 | 2005 Nov 25 | 03 58 54.4 | +10 26 03 | II (HEG) | E1? |
| 3C105 | 2004 Oct 26 | 04 07 16.46 | +03 42 25.68 | II (HEG) | E |
| 3C111 | 2004 Dec 8 | 04 18 21.05 | +38 01 35.77 | II (QSO) | N |
| 3C123 | 2004 Dec 7 | 04 37 04.4 | +29 40 13.2 | II (LEG) | — |
| 3C129 | 2004 Dec 8 | 04 49 09.07 | +45 00 39.0 | I | E |
| 3C129.1 | 2004 Nov 22 | 04 50 06.7 | +45 03 06.0 | I | E |
| 3C132 | 2005 Nov 24 | 04 56 43.0 | +22 49 22 | II (LEG) | — |
| 3C133 | 2004 Dec 13 | 05 02 58.4 | +25 16 28.0 | II (LEG) | — |
| 3C135 | 2005 Apr 8 | 05 14 08.3 | +00 56 32.0 | II (HEG) | E |
| 3C153 | 2005 Nov 25 | 06 09 32.5 | +48 04 15 | II (LEG) | — |
| 3C165 | 2005 Apr 26 | 06 43 06.6 | +23 19 03.0 | II (LEG) | — |
| 3C166 | 2005 Nov 4 | 06 45 24.1 | +21 21 51 | II (LEG) | E |
| 3C171 | 2004 Nov 14 | 06 55 14.72 | +54 08 58.27 | II (HEG) | N |
| 3C173.1 | 2004 Nov 22 | 07 09 24.34 | +74 49 15.19 | II (LEG) | — |
| 3C180 | 2005 Feb 20 | 07 27 04.77 | -02 04 30.97 | II (LEG) | — |
| 3C184.1 | 2004 Nov 26 | 07 43 01.28 | +80 26 26.3 | II (QSO) | E |
| 3C192 | 2005 Jan 8 | 08 05 35.0 | +24 09 50.0 | II (HEG) | — |
| 3C196.1 | 2005 Feb 1 | 08 15 27.73 | -03 08 26.99 | II (QSO) | cD |
| 3C197.1 | 2005 Apr 19 | 08 21 33.7 | +47 02 37.0 | II (HEG) | — |
| 3C198 | 2005 May 3 | 08 22 31.9 | +05 57 7.0 | II (HEG) | E |
| 3C213.1 | 2005 Feb 12 | 09 01 05.3 | +29 01 46.0 | II (LEG) | — |
| 3C219 | 2004 Sep 14 | 09 21 8.64 | +45 38 56.49 | II (QSO) | — |
| 3C223 | 2005 Feb 10 | 09 39 52.76 | +35 53 59.12 | II (QSO) | E2 |
| 3C223.1 | 2005 Jan 18 | 09 41 24.04 | +39 44 42.39 | II (HEG) | S0? |
| 3C227 | 2005 Mar 28 | 09 47 45.14 | +07 25 20.33 | II (QSO) | N |
| 3C234 | 2005 Nov 3 | 10 01 49.5 | +28 47 09 | II (QSO) | N |
| 3C236 | 2004 Nov 2 | 10 06 01.7 | +34 54 10.0 | II (LEG) | E |
| 3C264 | 1998 May 12 | 11 45 05.0 | +19 36 23 | I | E |
| 3C277.3 | 2005 Mar 24 | 12 54 12.06 | +27 37 32.66 | II | E |
| 3C284 | 2006 Mar 4 | 13 11 04.7 | +27 28 08 | II (HEG) | — |
| 3C285 | 2004 Dec 5 | 13 21 17.8 | +42 35 15.0 | II (HEG) | — |
| 3C287.1 | 2005 Jul 16 | 13 32 53.27 | +02 00 44.73 | II (QSO) | E pec |
| 3C288 | 2004 Oct 31 | 13 38 50.0 | +38 51 10.7 | I | — |
| 3C293 | 2004 Mar 17 | 13 52 17.8 | +31 26 46 | II (LEG) | — |
| 3C296 | 2006 Apr 21 | 14 16 52.9 | +10 48 26 | I | — |
| 3C300 | 2006 Mar 4 | 14 23 01.0 | +19 35 17 | II (HEG) | E |
| 3C303 | 2004 Dec 26 | 14 43 02.74 | +52 01 37.5 | II (QSO) | N |
| 3C305 | 1998 Jul 19 | 14 49 21.6 | +63 16 14 | I | SB0 |
| 3C310 | 2004 Aug 13 | 15 04 57.18 | +26 00 56.87 | I | — |
| 3C314.1 | 2005 Feb 24 | 15 10 23.12 | +70 45 53.4 | I | E |
| 3C315 | 2004 Dec 30 | 15 13 40.0 | +26 07 27.0 | I | — |
| 3C317 | 1998 Aug 26 | 15 16 44.5 | +07 01 17 | I | cD; E |
| 3C319 | 2004 Dec 29 | 15 24 05.5 | +54 28 14.6 | II (LEG) | — |
| 3C326 | 2006 Apr 21 | 15 52 09.1 | +20 05 24 | II (LEG) | — |
| 3C332 | 2006 Jan 12 | 16 17 42.5 | +32 22 35 | II (QSO) | E |
| 3C338 | 1997 Dec 17 | 16 28 38.5 | +39 33 06 | I | — |
| 3C346 | 2005 May 19 | 16 43 48.69 | +17 15 48.09 | II (LEG) | E |
| 3C348 | 2005 May 9 | 16 51 08.16 | +04 59 33.84 | I | E |
| 3C349 | 2005 Mar 23 | 16 59 28.84 | +47 02 56.8 | II (HEG) | — |
| 3C353 | 2004 Sep 9 | 17 20 28.16 | -00 58 47.06 | II (LEG) | SA0- |
| 3C357 | 2006 Mar 25 | 17 28 18.5 | +31 46 14 | II (HEG) | E |
| 3C379.1 | 2004 Nov 5 | 18 24 32.53 | +74 20 58.64 | II (HEG) | — |
| 3C381 | 2004 Nov 11 | 18 33 46.29 | +47 27 02.9 | II (HEG) | — |
| 3C386 | 2005 Jun 15 | 18 38 26.27 | +17 11 49.57 | I | SA0- |
| 3C388 | 2004 Oct 19 | 18 44 02.4 | +45 33 30.0 | II (LEG) | — |
| 3C401 | 2004 Aug 11 | 19 40 25.14 | +60 41 36.85 | II (LEG) | E |
| 3C402 | 2004 Dec 10 | 19 41 46.0 | +50 35 44.9 | II (HEG) | S? |
| 3C403 | 2004 Nov 6 | 19 52 15.81 | +02 30 24.4 | II (HEG) | S0 |
| 3C405 | 1997 Dec 16 | 19 59 28.3 | +40 44 02 | II (HEG) | S? |
| 3C424 | 2006 Jun 22 | 20 48 12.0 | +07 01 17.0 | I | E |
| 3C433 | 2004 Aug 18 | 21 23 44.6 | +25 04 28.5 | II (HEG) | — |
| 3C436 | 2004 Nov 9 | 21 44 11.74 | +28 10 18.67 | II (HEG) | — |
| 3C438 | 2004 Nov 18 | 21 55 52.3 | +38 00 30.0 | II (HEG) | — |
| 3C449 | 2004 Nov 11 | 22 31 20.63 | +39 21 30.07 | I | — |
| 3C452 | 2004 Nov 28 | 22 45 48.9 | +39 41 14.47 | II (HEG) | E |
| 3C459 | 2006 Jun 24 | 23 16 35.2 | +04 05 18.0 | II (LEG) | N |
| 3C465 | 2004 Sep 28 | 23 38 29.41 | +27 01 53.03 | I | cD; E+ pec |
Note. — Col. (1), 3CR number; col. (2) HST observation date; col. (3) right ascension for epoch 2000; col. (4) declination for epoch 2000; col. (5) FR class; col (6) morphological classification.
| Source | ellip. | z | |||||||||
|---|---|---|---|---|---|---|---|---|---|---|---|
| (1) | (2) | (3) | (4) | (5) | (6) | (7) | (8) | (9) | (10) | (11) | (12) |
| 3C17 | 0.25 | 0.21968 | 18.28 | 3.21 | 0.370 | — | — | -24.88 | — | -24.88 | — |
| 3C20 | 0.05 | 0.17400 | 17.89 | 2.33 | 0.350 | — | — | -24.43 | — | -24.43 | — |
| 3C28 | 0.18 | 0.19520 | 17.76 | 1.05 | 0.821 | 17.25 | 4.49 | -22.49 | -25.36 | -25.43 | 0.07 |
| 3C31 | 0.11 | 0.01670 | 18.09 | 5.22 | 0.272 | — | — | -25.50 | — | -25.50 | — |
| 3C33.1 | 0.09 | 0.18090 | 18.65 | 3.08 | 0.443 | — | — | -24.16 | — | -24.16 | — |
| 3C35 | 0.27 | 0.06700 | 18.77 | 5.89 | 0.371 | — | — | -25.13 | — | -25.13 | — |
| 3C52 | 0.31 | 0.28540 | 19.06 | 8.34 | 0.240 | — | — | -26.63 | — | -26.63 | — |
| 3C61.1 | 0.07 | 0.18400 | 19.52 | 2.86 | 0.282 | — | — | -23.40 | — | -23.40 | — |
| 3C66.B | 0.15 | 0.02150 | 19.31 | 9.16 | 0.248 | 19.94 | 20.69 | -25.58 | -25.32 | -26.21 | 1.27 |
| 3C75.N | 0.03 | 0.02315 | 17.10 | 1.98 | 0.247 | — | — | -24.41 | — | -24.41 | — |
| 3C76.1 | 0.15 | 0.03240 | 16.70 | 1.08 | 0.261 | 19.15 | 5.19 | -23.45 | -23.05 | -24.02 | 1.46 |
| 3C79 | 0.10 | 0.25595 | 18.38 | 4.27 | 0.348 | — | — | -25.56 | — | -25.56 | — |
| 3C83.1 | 0.25 | 0.02550 | 18.93 | 12.01 | 0.214 | — | — | -26.63 | — | -26.63 | — |
| 3C84 | 0.22 | 0.01756 | 18.73 | 6.52 | 0.356 | 18.22 | 8.12 | -25.33 | -25.11 | -25.98 | 1.23 |
| 3C88 | 0.35 | 0.03022 | 19.18 | 4.92 | 0.227 | 18.11 | 6.57 | -24.42 | -24.68 | -25.31 | 0.79 |
| 3C98 | 0.15 | 0.03000 | 18.31 | 3.12 | 0.248 | — | — | -24.28 | — | -24.28 | — |
| 3C105 | 0.28 | 0.08900 | 17.16 | 1.19 | 0.315 | 17.55 | 2.20 | -23.45 | -23.12 | -24.05 | 1.35 |
| 3C111 | 0.25 | 0.04850 | 18.87 | 3.44 | 0.173 | — | — | -24.16 | — | -24.16 | — |
| 3C123 | 0.12 | 0.21770 | 22.28 | 28.65 | 0.166 | — | — | -26.04 | — | -26.04 | — |
| 3C129 | 0.13 | 0.02080 | 17.39 | 1.75 | 0.637 | 17.71 | 4.22 | -23.33 | -24.01 | -24.47 | 0.54 |
| 3C129.1 | 0.24 | 0.02220 | 17.32 | 1.76 | 0.900 | 17.76 | 5.97 | -23.32 | -24.78 | -25.03 | 0.26 |
| 3C132 | 0.18 | 0.21400 | 18.66 | 5.36 | 0.362 | — | — | -25.60 | — | -25.60 | — |
| 3C133 | 0.06 | 0.27750 | 19.44 | 4.74 | 0.319 | — | — | -24.82 | — | -24.82 | — |
| 3C135 | 0.19 | 0.12530 | 17.12 | 1.19 | 0.223 | 17.42 | 2.49 | -23.78 | -23.64 | -24.47 | 1.14 |
| 3C153 | 0.11 | 0.27700 | 16.79 | 1.28 | 0.259 | 18.44 | 5.27 | -24.75 | -24.81 | -25.53 | 0.95 |
| 3C165 | 0.18 | 0.29570 | 20.21 | 9.23 | 0.241 | — | — | -25.72 | — | -25.72 | — |
| 3C166 | 0.07 | 0.24500 | 21.49 | 14.18 | 0.225 | — | — | -25.24 | — | -25.24 | — |
| 3C171 | 0.08 | 0.23840 | 19.11 | 4.21 | 0.305 | — | — | -24.78 | — | -24.78 | — |
| 3C173.1 | 0.23 | 0.29210 | 19.46 | 9.01 | 0.162 | — | — | -26.62 | — | -26.62 | — |
| 3C180 | 0.43 | 0.22000 | 20.00 | 7.44 | 0.242 | 18.07 | 5.56 | -25.21 | -25.09 | -25.91 | 1.11 |
| 3C184.1 | 0.27 | 0.11820 | 15.79 | 0.59 | 0.904 | 16.74 | 2.05 | -22.87 | -23.88 | -24.24 | 0.39 |
| 3C192 | 0.03 | 0.05980 | 17.84 | 2.61 | 0.253 | — | — | -24.39 | — | -24.39 | — |
| 3C196.1 | 0.29 | 0.19800 | 19.03 | 2.41 | 0.337 | 17.75 | 6.65 | -23.47 | -25.72 | -25.85 | 0.13 |
| 3C197.1 | 0.08 | 0.13010 | 19.42 | 4.73 | 0.227 | — | — | -24.51 | — | -24.51 | — |
| 3C198 | 0.15 | 0.08150 | 19.31 | 3.50 | 0.292 | — | — | -23.61 | — | -23.61 | — |
| 3C213.1 | 0.39 | 0.19400 | 18.95 | 4.59 | 0.281 | — | — | -25.01 | — | -25.01 | — |
| 3C219 | 0.23 | 0.17440 | 18.92 | 6.27 | 0.399 | — | — | -25.48 | — | -25.48 | — |
| 3C223 | 0.18 | 0.13680 | 18.71 | 4.06 | 0.286 | — | — | -24.76 | — | -24.76 | — |
| 3C223.1 | 0.45 | 0.10700 | 16.99 | 1.50 | 0.261 | 16.74 | 3.21 | -24.25 | -24.78 | -25.30 | 0.61 |
| 3C227 | 0.17 | 0.08610 | 18.47 | 2.93 | 0.235 | — | — | -24.21 | — | -24.21 | — |
| 3C234 | 0.07 | 0.18500 | 17.88 | 2.78 | 0.433 | — | — | -24.76 | — | -24.76 | — |
| 3C236 | 0.34 | 0.10050 | 19.57 | 10.06 | 0.291 | 16.62 | 1.91 | -25.72 | -23.75 | -25.89 | 6.15 |
| 3C264 | 0.05 | 0.02172 | 16.13 | 1.52 | 0.671 | 17.70 | 5.48 | -24.37 | -24.70 | -25.30 | 0.74 |
| 3C277.3 | 0.05 | 0.08570 | 19.11 | 5.54 | 0.255 | — | — | -24.93 | — | -24.93 | — |
| 3C284 | 0.03 | 0.23900 | 19.44 | 6.13 | 0.213 | 17.59 | 2.00 | -25.48 | -23.42 | -25.63 | 6.69 |
| 3C285 | 0.42 | 0.07940 | 18.63 | 3.00 | 0.239 | 17.87 | 4.89 | -24.08 | -24.49 | -25.05 | 0.69 |
| 3C287.1 | 0.12 | 0.21590 | 16.24 | 1.00 | 0.268 | 18.26 | 4.83 | -24.55 | -24.58 | -25.32 | 0.97 |
| 3C288 | 0.03 | 0.24600 | 18.94 | 4.79 | 0.749 | 18.12 | 7.73 | -24.81 | -25.83 | -26.19 | 0.39 |
| 3C293 | 0.55 | 0.04503 | 17.44 | 1.63 | 0.968 | 17.43 | 4.65 | -23.09 | -24.66 | -24.89 | 0.23 |
| 3C296 | 0.21 | 0.02370 | 17.97 | 6.60 | 0.277 | — | — | -26.17 | — | -26.17 | — |
| 3C300 | 0.29 | 0.27000 | 19.31 | 4.92 | 0.299 | — | — | -24.92 | — | -24.92 | — |
| 3C303 | 0.10 | 0.14100 | 18.93 | 5.30 | 0.259 | — | — | -25.19 | — | -25.19 | — |
| 3C305 | 0.35 | 0.04164 | 17.39 | 2.58 | 0.224 | 17.46 | 5.44 | -24.88 | -24.97 | -25.67 | 0.92 |
| 3C310 | 0.15 | 0.05350 | 18.09 | 2.56 | 0.285 | 18.85 | 8.40 | -24.06 | -24.55 | -25.09 | 0.63 |
| 3C314.1 | 0.41 | 0.11970 | 18.99 | 4.44 | 0.408 | — | — | -24.43 | — | -24.43 | — |
| 3C315 | 0.35 | 0.10830 | 16.83 | 1.39 | 0.252 | 18.84 | 4.59 | -24.28 | -23.47 | -24.70 | 2.11 |
| 3C317 | 0.30 | 0.03446 | 17.83 | 1.63 | 0.434 | 17.24 | 7.63 | -23.06 | -25.89 | -25.97 | 0.07 |
| 3C319 | 0.24 | 0.19200 | 16.40 | 0.78 | 0.353 | 18.61 | 4.05 | -23.59 | -23.74 | -24.42 | 0.87 |
| 3C326 | 0.39 | 0.08900 | 17.13 | 1.38 | 0.269 | 16.90 | 2.07 | -23.86 | -23.62 | -24.50 | 1.25 |
| 3C332 | 0.05 | 0.15150 | 15.94 | 0.88 | 0.254 | 17.82 | 3.10 | -24.35 | -23.82 | -24.87 | 1.63 |
| 3C338 | 0.28 | 0.03035 | 19.03 | 12.86 | 0.474 | — | — | -26.29 | — | -26.29 | — |
| 3C346 | 0.30 | 0.16100 | 14.90 | 0.46 | 0.270 | 17.83 | 3.82 | -23.98 | -24.29 | -24.90 | 0.76 |
| 3C348 | 0.22 | 0.15400 | 19.58 | 9.25 | 0.925 | — | — | -25.16 | — | -25.16 | — |
| 3C349 | 0.48 | 0.20500 | 17.27 | 1.48 | 0.249 | 17.89 | 3.45 | -24.20 | -24.02 | -24.87 | 1.18 |
| 3C353 | 0.03 | 0.03043 | 17.86 | 1.85 | 0.251 | 18.11 | 3.43 | -23.53 | -23.24 | -24.15 | 1.31 |
| 3C357 | 0.32 | 0.16700 | 18.94 | 5.29 | 0.238 | 17.94 | 5.17 | -25.34 | -24.87 | -25.88 | 1.54 |
| 3C379.1 | 0.11 | 0.25600 | 18.14 | 2.77 | 0.225 | 17.83 | 5.02 | -25.06 | -25.22 | -25.89 | 0.87 |
| 3C381 | 0.17 | 0.16050 | 17.10 | 1.56 | 0.264 | 17.78 | 2.86 | -24.43 | -23.71 | -24.88 | 1.95 |
| 3C386 | 0.12 | 0.01700 | 18.32 | 3.38 | 0.226 | — | — | -24.38 | — | -24.38 | — |
| 3C388 | 0.13 | 0.09100 | 17.64 | 2.21 | 1.227 | 16.86 | 5.37 | -23.62 | -25.71 | -25.86 | 0.14 |
| 3C401 | 0.18 | 0.20104 | 17.89 | 1.17 | 0.310 | 17.97 | 5.34 | -22.95 | -24.89 | -25.06 | 0.17 |
| 3C402 | 0.21 | 0.02390 | 18.85 | 5.00 | 0.190 | — | — | -24.76 | — | -24.76 | — |
| 3C403 | 0.26 | 0.05900 | 18.01 | 4.72 | 0.405 | — | — | -25.32 | — | -25.32 | — |
| 3C405 | 0.25 | 0.05608 | 20.01 | 14.85 | 0.525 | — | — | -25.67 | — | -25.67 | — |
| 3C424 | 0.03 | 0.12699 | 19.38 | 3.67 | 0.254 | — | — | -23.91 | — | -23.91 | — |
| 3C433 | 0.43 | 0.10160 | 17.90 | 2.51 | 0.494 | 16.85 | 4.68 | -24.08 | -25.44 | -25.71 | 0.29 |
| 3C436 | 0.18 | 0.21450 | 19.12 | 6.61 | 0.255 | — | — | -25.75 | — | -25.75 | — |
| 3C438 | 0.10 | 0.29000 | 19.86 | 9.96 | 0.298 | — | — | -26.06 | — | -26.06 | — |
| 3C449 | 0.48 | 0.01710 | 19.01 | 5.08 | 0.164 | — | — | -24.75 | — | -24.75 | — |
| 3C452 | 0.24 | 0.08110 | 18.15 | 3.83 | 0.276 | — | — | -25.00 | — | -25.00 | — |
| 3C459 | 0.15 | 0.21990 | 15.45 | 0.81 | 0.430 | 17.59 | 3.38 | -24.63 | -24.48 | -25.31 | 1.14 |
| 3C465 | 0.20 | 0.03030 | 17.67 | 3.92 | 0.311 | 18.52 | 14.59 | -25.25 | -25.98 | -26.43 | 0.51 |
Note. — Col. (1), 3CR number; col (2), ellipticity; col. (3), redshift; col. (4), effective surface magnitude; col. (5), effective radius; col. (6), Sérsic index; col. (7), central surface magnitude; col. (8), scale length; col. (9), bulge absolute magnitude; col. (10), disk absolute magnitude; col. (11), total absolute magnitude; col. (12), bulge/disk ratio.
| Galaxies | B/D | ||||||||
|---|---|---|---|---|---|---|---|---|---|
| [Kpc] | [Kpc] | ||||||||
| (1) | (2) | (3) | (4) | (5) | (6) | (7) | (8) | (9) | (10) |
| ALL | -25.4 0.7 | -25.0 0.9 | -24.8 0.6 | 17.6 1.1 | 4.6 2.7 | 0.35 0.18 | 17.6 0.7 | 5.3 2.8 | 1.1 1.0 |
| FR I | -25.6 0.7 | -25.1 0.9 | -25.1 0.6 | 17.7 0.8 | 4.7 2.6 | 0.40 0.18 | 18.1 0.7 | 8.2 2.7 | 0.8 0.4 |
| FR II | -25.3 0.6 | -25.0 0.7 | -24.6 0.6 | 17.5 1.0 | 4.6 2.6 | 0.33 0.08 | 17.5 0.4 | 4.0 1.3 | 1.3 0.8 |
Note. — Col. (1), Sub sample galaxies; (2), total absolute magnitude; Col. (3), bulge total magnitude; col. (4), disk total magnitude; col. (5), bulge effective magnitude; col. (6), bulge effective radius ; col. (7), Sérsic index; col. (8), disk central surface magnitude; col. (9), disk scale length; col. (10), bulge to disk ratio.
| Galaxies | B/D | ||||||||
|---|---|---|---|---|---|---|---|---|---|
| [Kpc] | [Kpc] | ||||||||
| (1) | (2) | (3) | (4) | (5) | (6) | (7) | (8) | (9) | (10) |
| FR I | -25.6 0.7 | -25.1 0.7 | -25.1 0.7 | 17.7 0.9 | 4.7 2.6 | 0.40 0.16 | 18.1 0.6 | 8.2 3.1 | 0.8 0.4 |
| LEG | -25.5 0.6 | -25.2 0.9 | -24.7 0.6 | 17.7 1.4 | 5.8 4.1 | 0.38 0.10 | 17.5 0.5 | 4.3 1.1 | 1.2 0.8 |
| HEG | -25.2 0.5 | -24.9 0.6 | -24.5 0.7 | 18.1 0.8 | 4.2 2.0 | 0.29 0.10 | 17.5 0.3 | 3.6 1.1 | 1.6 0.9 |
| QSO | -25.0 0.5 | -24.7 0.6 | -24.8 0.8 | 17.3 0.7 | 3.1 1.2 | 0.36 0.11 | 17.5 0.4 | 4.2 1.8 | 0.8 0.5 |
Note. — Col. (1), Sub sample galaxies; (2), total absolute magnitude; Col. (3), bulge total magnitude; col. (4), disk total magnitude; col. (5), bulge effective magnitude; col. (6), bulge effective radius ; col. (7), Sérsic index; col. (8), disk central surface magnitude; col. (9), disk scale length; col. (10), bulge to disk ratio.