Early Ultraviolet, Optical and X-Ray Observations
of the Type IIP
SN 2005cs in M51 with Swift
Abstract
We report early photospheric-phase observations of the Type IIP Supernova (SN) 2005cs obtained by Swift’s Ultraviolet-Optical and X-Ray Telescopes. Observations started within two days of discovery and continued on a regular basis for three weeks. During this time the V-band magnitude remained essentially constant, while the UV was initially bright but steadily faded until below the brightness of an underlying UV-bright Hii region. This UV decay is similar to SNe II observed by the International Ultraviolet Explorer. UV grism spectra show the P-Cygni absorption of Mgii 2798Å, indicating a photospheric origin of the UV flux. Based on non-LTE model atmosphere calculations with the CMFGEN code, we associate the rapid evolution of the UV flux with the cooling of the ejecta, the peak of the spectral energy distribution (SED) shifting from 700Å on June 30th to 1200Å on July 5th. Furthermore, the corresponding recombination of the ejecta, e.g., the transition from Feiii to Feii, induces a considerable strengthening of metal line-blanketing at and above the photosphere, blocking more and more effectively this fading UV flux. SN 2005cs was not detected in the X-rays, and the upper limit to the X-ray luminosity yields a limit to the mass loss rate of the progenitor of . Overall, Swift represents a unique opportunity to capture the early and fast evolution of Type II SNe in the UV, providing additional constraints on the reddening, the SED shortward of 4000Å, and the ionization state and temperature of the photon-decoupling regions.
1 Introduction
Supernova (SN) 2005cs was discovered in the Whirlpool Galaxy (M51, NGC 5194) by W. Kloehr (2005) on 2005 June 28.9 (all dates UT). Pastorello et al. (2006) estimate the explosion occurred June 27.5 (JD 2453549) based on previous non-detections. Modjaz, Kirshner & Challis (2005) classified it from a spectrum as a young SN II on June 30.23, and the observations with the Swift spacecraft (Gehrels et al., 2005) reported here began June 30.9. The photometric and spectroscopic evolution of SN 2005cs is consistent with that of a subluminous SN II-Plateau (IIP), with a plateau phase lasting days and low ejecta velocities (Tsvetkov et al., 2006; Pastorello et al., 2006).
A young SN discovered in a nearby galaxy as well studied as M51 offers a unique opportunity for detailed investigations. The host galaxy has previously been observed at various wavelengths by many different instruments (see e.g. Calzetti et al. 2005, Dewangan et al. 2005). Examination of pre-explosion images from the Hubble Space Telescope (HST) has identified a red supergiant as a plausible progenitor candidate (Li et al. 2006; Maund, Smartt & Danziger 2005). The position measured using high resolution images from the Canada-France-Hawaii Telescope and HST is R.A. and Dec. (J2000; Li et al. 2006).
The quick identification and classification of this SN event allowed for early observations by instruments on the ground and in space while the SN was still in its early photospheric phase. This is especially critical in the UV because of the rapid decline in luminosity at short wavelengths as the SN photosphere cools. Because they require space-based observatories, UV data on SNe are limited, especially at early times. While IUE observed several SNe II, none were of the ”plateau” (IIP) subtype despite it being the most common type of SNe II. HST observed the SN IIP 1999em at two epochs, starting about two weeks after the explosion (Baron et al., 2000). The observations presented in this paper fill an important gap by showing the UV evolution of SN 2005cs during the first few weeks after its explosion.
2 Observations and Reductions
2.1 Swift Observations
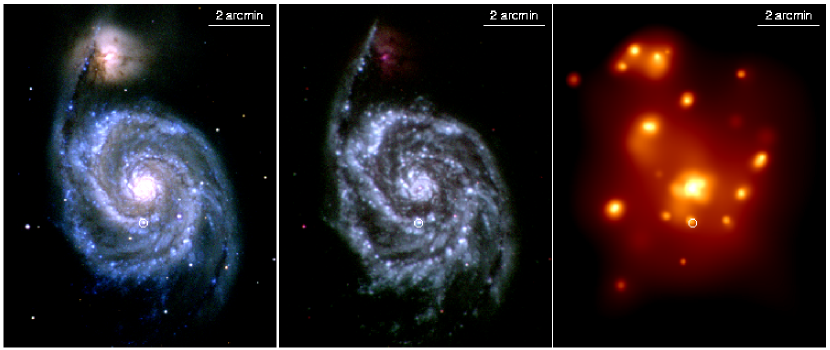
Regular observations of SN 2005cs were made with the Swift spacecraft (Gehrels et al., 2005) between 2005 June 30th and July 23rd with a follow-up observation on September 14, utilizing both the X-Ray Telescope (XRT; Burrows et al., 2005) and the Ultraviolet/Optical Telescope (UVOT; Roming et al., 2005). Images from UVOT and XRT of SN 2005cs and its host galaxy M51 are displayed in Fig. 1. The XRT operates in the 0.2–10 keV range with a half-power diameter at 1.5 keV. Pertinent calibration details for UVOT111see http://swift.gsfc.nasa.gov/docs/heasarc/caldb/swift/docs/uvot/ for updated documentation, including the filter bandpasses and photometric zeropoints, are given in Table 1.
2.2 UVOT Photometry
SN 2005cs is located in a spiral arm of M51, which causes the background to be variable over small spatial scales. There is an underlying Hii region visible in pre-explosion GALEX UV images (Bianchi et al., 2004). This means that high precision photometry will not be possible until SN 2005cs has faded and the underlying light can be subtracted. It is anticipated that Swift UVOT will reobserve the field of SN 2005cs in 2007 so that late-time template images of the host galaxy can be obtained. At the early times in which we are most interested here, the SN was much brighter and contribution from the Hii region or other contamination is small.
We performed aperture photometry using a circular aperture with a radius of () or (UV filters) centered on the SN. A background sky region was selected by eye which contained approximately the same structure and light as the region containing the SN. Photometry was done using several background regions selected in this way and all were found to return similar photometry. Aperture corrections to the standard UVOT photometry apertures ( for and for UVW1, UVM2, and UVW2) were calculated frame by frame in . For the UV filters, a single aperture correction for each filter was computed from a summed image due to the lack of UV-bright, isolated stars in the field of view. The larger source aperture was chosen to minimize errors due to small orbital variations in the PSF.
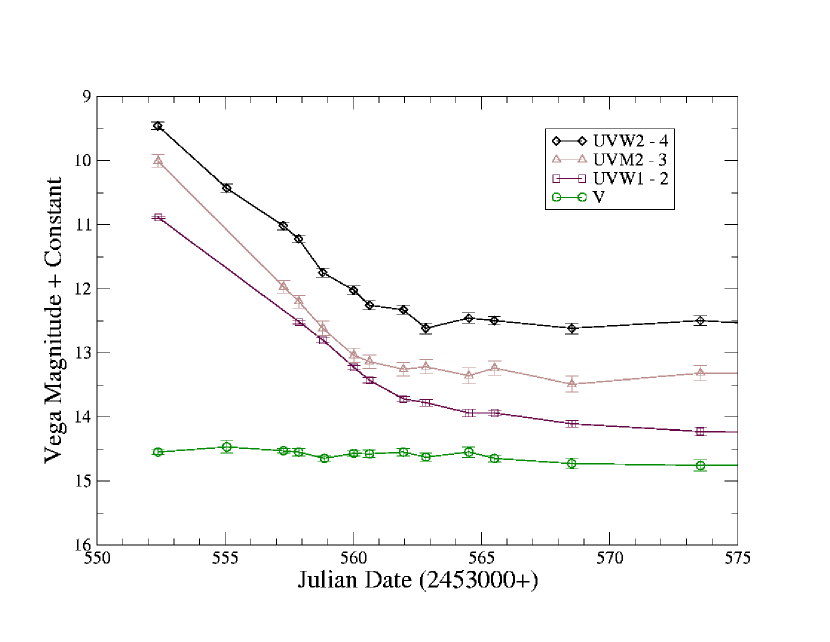
The count rates were corrected for coincidence loss using the coincidence loss equation in the Swift UVOT Calibration Database (CalDB)222available from http://swift.gsfc.nasa.gov/docs/heasarc/caldb/swift/. Corrected count rates were transformed to Vega magnitudes using the appropriate photometric zero points in the CalDB. The and curves begin near or above the saturation level of UVOT’s photon counting detector and will not be considered here. The photometry in the remaining four UVOT filters, 3 UV filters and the V band, is presented in Table 2 and displayed in Fig. 2. These values have not been corrected for extinction. The errors (given in Table 2 or displayed in Fig. 2) are the statistical errors only and do not include the systematic errors in the photometric zeropoint calibration (given in Table 1).
2.3 UVOT Grism Data
Swift UVOT also observed SN 2005cs several times using its spectroscopic grisms. These observations are listed in Table 3. The wavelength scale could be shifted by up to 30 Å due to the difficulty of fixing the scale on the saturated zeroth order spectrum especially at early times when the UV flux was greatest. There is also a large uncertainty in the background subtraction due to the bright underlying galaxy.
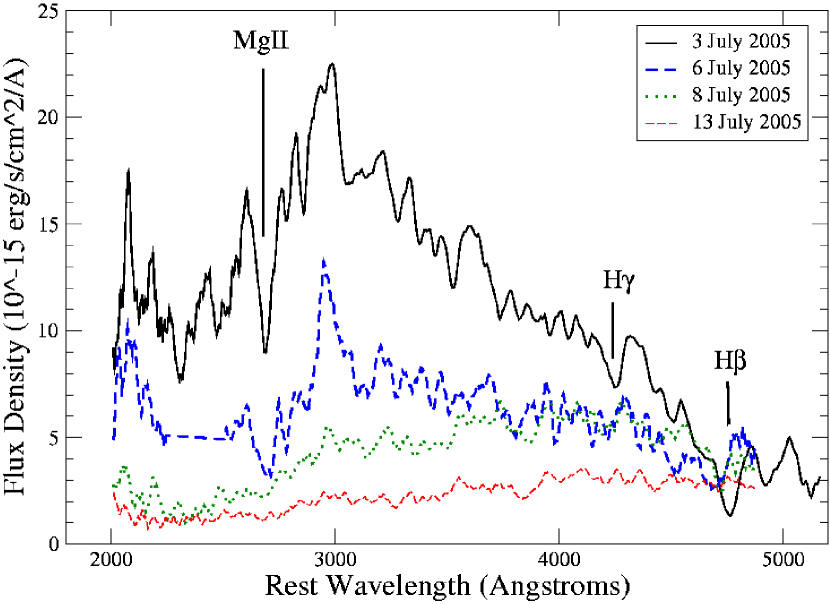
The extracted spectra were smoothed using a running average of 10 points (20Å) and scaled to match contemporaneous UVOT photometry (using the flux density conversion factors of Table 1). The resulting spectra from four epochs are displayed in Fig. 3. The first epoch spectrum is a composite of the UV grism and V grism spectra, spliced near 2900Å, in order to avoid order overlap in the UV grism. The UV grism observation from 6 July contains the zeroth order of another field star near 2450 Å, and the affected region has been removed from the spectrum.
2.4 XRT Data
All XRT data, from June 30th to September 14, were merged into a single 33.0 ks observation to search for X-ray emission from SN 2005cs. However, the bright (integrated flux between 0.2 and 10 keV, ) and nearby ( offset) X-ray flash source detected in sequence number 00030083011 (Immler, Kong & Lewin 2005) severely affects an estimate of the amount of emission from SN 2005cs because this source is within the XRT source extraction aperture ( half-power diameter at 1.5 keV). We therefore excluded all observations obtained on the day the X-ray flash was observed (2005-07-06, sequence numbers 00030083010/11/12/13) to minimize contamination, leaving 26.8 ks of exposure time in the final merged image used below.
The 26.8 ks image shows no X-ray source at the position of the X-ray flash, and no source at the position of SN 2005cs. We therefore extracted on-source counts from a circular extraction region with a radius of 10 pixel () and subtracted the background from an annulus centered on the position of SN 2005cs to account for diffuse emission from the galaxy. A 3-sigma upper limit to the 0.2–10 keV count rate of is obtained, which corresponds to an unabsorbed X-ray flux of .
2.5 XMM-Newton EPIC Data
SN 2005cs was observed with XMM-Newton on 2005-07-01 (OBS-ID 0212480801) as a Target of Opportunity (PI Immler) to search for prompt X-ray emission from the SN. Data processing and analysis were performed with SAS 6.5.0333http://xmm.vilspa.esa.es/external/xmm_sw_cal/sas.shtml and the latest calibration constituents. After screening of the EPIC PN and MOS data for periods with a high background, cleaned exposure times of 28.1 ks for the PN and 33.8 ks for each of the two MOS instruments were obtained.
Inspection of the EPIC images showed that the X-ray “flash” serendipitously observed by Swift XRT during some of the observations (Immler, Kong & Lewin 2005) is also present in the data obtained quasi-simultaneously with the XMM-Newton EPIC. Since the offset of this bright X-ray source from the position of SN 2005cs () is smaller than the point-spread-function of the XRT+EPIC ( half energy width), no reliable upper limits to the X-ray flux of SN 2005cs can be established from the XMM-Newton X-ray data. The XMM-Newton EPIC data will therefore not be further used and we will rely on the Swift XRT data to study the X-ray emission from SN 2005cs.
3 Discussion
3.1 Ultraviolet Light Curves
SN 2005cs was initially extremely bright in the UV, outshining the nucleus of M51 by over 2 magnitudes. The blue UV-optical colors of SN 2005cs were used to photometrically type SNe 2006at (Brown & Immler, 2006) and 2006bc (Immler & Brown, 2006) as young SNe II. The UV faded quickly until falling below the brightness of an underlying Hii region about 10 days after the explosion. While the decay slope generally steepens at shorter wavelengths (see Li et al., 2006, Tsvetkov et al., 2006, or Pastorello et al., 2006 for the optical curves), the decline in UVM2 is actually steeper (0.38 mag/day) than the filters on either side, UVW1 (0.31 mag/day) UVW2 (0.34 mag/day). This is likely caused by the strong Feiii and the strengthening Feii lines concentrated within the UVM2 bandpass.
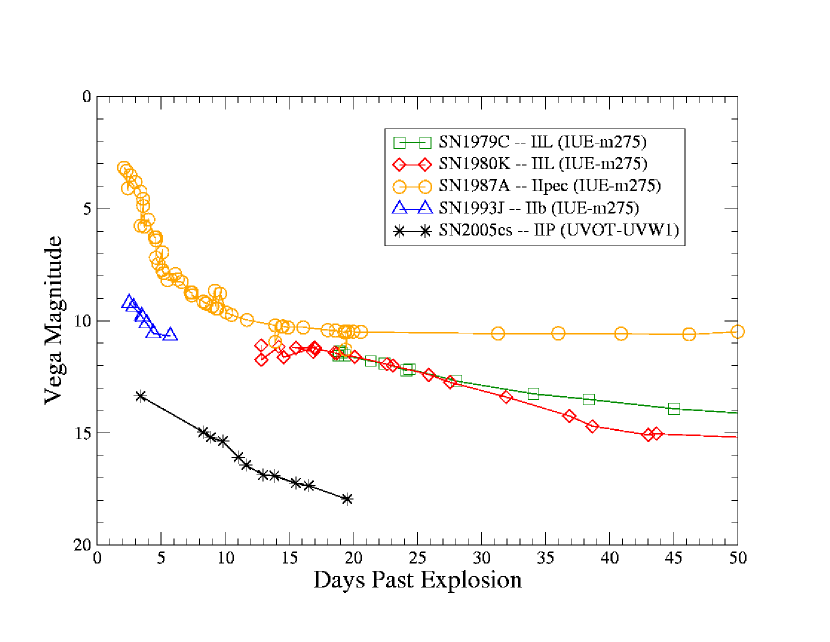
For a comparison with other SNe II in a nearby UV wavelength regime, we created a new UVW1 light curve for SN 2005cs by assuming that the magnitude in the last epoch ( days after explosion) corresponds to the underlying background and subtracting that flux from the early UVW1 data. This might overestimate the background caused by a residual contribution from the SN, but this is not expected to be significant because of the continued fading seen in more recent UV observations of SNe II such as SN 2006bp (Immler et al., 2006). This new UVW1 curve is compared to other UV observations of SNe II in Fig. 4.
Several SNe II were observed by IUE, including several with multiple epochs (more than four observations: SNe 1979C, 1980K, 1987A & 1993J). For comparison we use the magnitudes given by Cappellaro, Turatto & Fernley (1995) which are calculated by convolving the HST F275W filter (central wavelength 2770Å and width 594Å; Nota et al., 1996) with the IUE spectra and calibrated so Vega would have . Due to the quantity of data, only an early selection from SN 1987A was used. Any magnitudes from spectra marked as saturated were also left out, as were the later spectra of SN 1993J which were contaminated by sunlight. We left the IUE magnitudes unshifted, as the difference in apparent magnitude between the brighter SNe observed by IUE and SN 2005cs is enough to separate their respective curves.
To make sure the comparison of the UV light curve shapes with the UVW1 and filters is valid, we performed spectrophotometry on the IUE spectra of SN 1987A (Pun et al., 1995) using the IRAF SBANDS command. A selection of spectra from the Long Wave Prime (LWP) camera (1975 Å –3300Å; Pun et al., 1995) were convolved with the UVW1 effective area curves to simulate how SN 1987A would have appeared in the UVW1 filter. The light curves of the UVW1 spectrophotometry and were very similar.
While the fading behavior in the UV is common among these SNe, it is interesting to note how varied the early optical ( band) behavior is for these SNe during the same time period. SN 1979C (Panagia et al., 1980, Barbon, Ciatti & Rosino, 1982) and SN 1980K (Buta, 1982), both II-Linear SNe (IIL), were discovered after maximum light and were thus fading in the optical. SN 1993J (Richmond et al., 1994), a IIb, was caught soon after explosion and showed the brightness declining, reaching a local minimum about 8 days before rising again as the photosphere receded to layers influenced by non-thermal excitation due to the radioactive decay of unstable isotopes of Nickel and Cobalt. SN 1987A (Pun et al., 1995), a peculiar type II, was mostly rising during this period. As shown in Fig. 2, SN 2005cs had a nearly constant V magnitude during this period, the distinguishing characteristic of a SN II-Plateau. In all cases, the UV and optical light curves must have begun with a rapid rise at the time of shock breakout, which is not usually observed. But while the optical curves vary enough to separate SNe II into subclasses based on their lightcurve shape (Barbon, Ciatti & Rosino, 1979), the differences from subclass or emission mechanism are not as clear in the UV.
3.2 UV Spectra
The first two UV spectra displayed in Fig. 3 show strong features also seen in the HST spectra of SN 1999em (Baron et al. 2000). Even after smoothing the spectra still contain significant noise, as evidenced by features in the optical regions which are not apparent in contemporaneous ground-based optical spectra (Pastorello et al., 2006). Because of this and the uncertainty in the wavelength scale, we do not want to overinterpret line identifications or velocities. We can identify a few strong lines, namely H, H, and MgII 2798 multiplet, whose strong and broad absorption features are marked. Overlapping absorption lines, particularly of Feiii, Feii and Mgii remove much of the UV light (see e.g. Lucy, 1987, Branch, 1987, Mazzali & Lucy, 1993, Dessart & Hillier, 2005, 2006). A complete census of the various ions and the spectral regions where they affect the emergent light is computed for two epochs bracketing the first grism observation (see discussion and the accompanying Fig. 5 below), generated by performing a formal solution to a converged CMFGEN model, but accounting only for the bound-bound transitions of a single ion. This neglects potential non-linear effects and line overlap but offers an instructive illustration of the cumulative effects of line blanketing, disentangled between all contributing species. Notice how little line emission appears above the UV continuum, and that the resulting “emission” features in the UV coincide with spectral regions of reduced line blanketing. The later UV spectra are of lesser quality but show the UV continuum becoming increasingly fainter.
The broad absorption around 2700Å is consistent with the formation of MgII 2798Å in the SN ejecta, i.e. at and above the SN photosphere at that time, and we associate it with the absorption part of the corresponding P-Cygni profile of this strong line (see § 3.3). This suggests that the UV emission from SN 2005cs originates from the photospheric layers of the fast expanding ejecta rather than from interaction with the circumstellar medium (CSM). SNe 1979C, 1980K and 1993J all showed blue-shifted emission from MgII and had smoother UV spectra (see e. g. Panagia et al., 1980, Fransson, 1984, Immler et al., 2005, Jeffery et al., 2006, & Jeffery et al., 1994). SN 1987A, on the other hand, exhibited a P-Cygni profile for MgII and no evidence for strong CSM interaction at early times (Kirshner et al., 1987; Pun et al., 1995). The addition of our spectra in Fig. 3 here to Fig. 3 in Jeffery et al. (1994) gives a spectroscopic juxtaposition of the same SNe compared photometrically in our Fig. 4.
3.3 Comparison with non-LTE model atmospheres
We report on a preliminary quantitative analysis of the UVOT photometric evolution and optical ground-based spectroscopy covering the first two weeks after discovery. Detailed results of this study will be shown in a forthcoming paper (Dessart et al. 2006, in prep.).
We employ the non-LTE model atmosphere code CMFGEN (Hillier & Miller, 1998; Dessart & Hillier, 2005) and follow the same approach as Dessart & Hillier (2006) for their analysis of SN 1999em. The version of the code used assumes a spherically symmetric (1D), steady-state, chemically homogeneous, homologously expanding ejecta with a density power-law of exponent . A key ingredient of our approach is that we set the inner boundary luminosity of the model (at a Rosseland optical depth of 50-100) so that the emergent synthetic flux matches the observed flux. To do this, we require the distance to SN 2005cs, which we take as 8 Mpc, the rough average of various distance estimates to the host galaxy M51 or sources within it. These distance estimates used HII regions (9.6 Mpc; Sandage & Tammann, 1974), young stellar associations (6.91 Mpc; Georgiev et al., 1990), planetary nebulae (8.4 Mpc, revised to 7.6 Mpc; Feldmeier, Ciardullo & Jacoby, 1997; Ciardullo et al., 2002), surface brightness fluctuations (7.7 Mpc; Tonry et al., 2001), the SEAM (6.0 Mpc; Baron et al., 1996), and more recently the EPM/SCM using SN 2005cs itself (7.3 Mpc; Takáts & Vinkó, 2006). We redden the synthetic spectral energy distribution computed by CMFGEN using the law of Cardelli, Clayton & Mathis (1988) and =0.04, which offers the best fit to the observations, and renormalize them to the observed flux at 6000Å (the flux offset between synthetic and observed spectra is small and 10-20%).
We assume an (homogeneous) ejecta composition that differs somewhat from that of Dessart & Hillier (2006) used for SN1999em. Indeed, Oii lines present in the June 30 spectrum at 4600Å required a higher oxygen abundance (Baron, 2006). We obtain satisfactory fits at all times using H/He, C/He, N/He and O/He, in agreement with the recent determination of the average surface composition of galactic B-supergiants (Crowther, Lennon & Walborn, 2006), together with a solar metallicity for the other elements.
To document the early color evolution of the spectral energy distribution of SN 2005cs, we focus on only two dates, June 30th and July 5th, complementing UVOT observations with optical spectra obtained by the CfA SN Group (for June 30th) and Pastorello et al. (2006; for July 5th) - the full time sequence will be shown in the follow-up analysis to this paper. We show in Fig. 5 a comparison, for these two dates, of the observed UVOT (blue crosses in color version) and optical spectra (black curve) of SN 2005cs with reddened synthetic spectra (red curve in color version) computed with CMFGEN. At the bottom of each plot is a ladder plot of spectra (normalized by the continuum) showing the contribution of bound-bound transitions of individual ions. To fit the observations, we vary primarily the base radius/luminosity to modulate the ionization state of the ejecta. This changes, in a non-linear way, the sources of opacity thereby modifying line strengths. It also changes the hardness of the spectral energy distribution (SED) at the thermalization layer (which lies above the inner boundary of the model), where it resembles that of a blackbody. Hence, this modifies the slope of the continuum as well. We also change the density exponent , adopting a very high value of 20 for the June 30th model. This represents an extremely steep density decrease with radius, but is necessary in order to reproduce the very weak optical features. A steep density profile was also required to fit early observations of SN 1993J (Baron et al., 1995). A lower value of ten is used to reproduce the observations of July 5th. We obtain satisfactory fits for a reddening of 0.04, which we adopt for all dates. Discordant flux distributions between quasi-simultaneous observations of Pastorello et al. (2006) and the CfA suggest that the flux is not very accurate below 4000Å, likely due to the CfA spectra not being taken at the parallactic angle. This is a region where spectra would best constrain the reddening and the ionization/temperature of the ejecta. The corresponding uncertainty in the slope suggests that the reddening could be as low as 0, but could not be higher than 0.1 without setting stringent requirements on the spectral modeling. Either way, the reddening is low, with a value equal or lower than that adopted by Pastorello et al. (2006), namely . Baron (2006) also found the reddening to be small and adopted the galactic value for the extinction from the Schlegel dust maps (; Schlegel, Finkbeiner & Davis, 1998).
We find that the density distribution flattens considerably in the continuum and line formation region over that week, described here as a change in the density exponent from to . This reproduces the changing optical line features, which appear systematically weak in the first spectrum but considerably stronger in the second. Given the numerous constraints on our modeling, only varying the density exponent can lead to the desired reduction of line fluxes in the first epoch. The corresponding flattening of the density profile over the course of one week does not constitute a puzzle. As demonstrated by Dessart & Hillier (2005), line formation in Type II SN is localized to a narrow spatial region above the photosphere and, thus, no sizeable flux emission occurs beyond a few tens of percent beyond the photospheric velocity. On the 5th of July 2005, 90% of the H flux (the strongest optical line) received from SN 2005cs falls within a range of line of sight velocities of 5000 km s-1, thus well below the photospheric velocity on the 30th of June for which we adopt the steeper density slope. Another point (Woosley, priv. comm.) is that the ejecta swept up by the shock remains in a dynamical phase up to one week after breakout. Homologous expansion is not reached until after about one week. This suggests that interpreting and comparing ejecta velocities inferred spectroscopically during the first week of explosion is not straightforward.
Beside a flattening of the density distribution, we also find that the ionization/temperature changes significantly between these two dates, following cooling through expansion of the ejecta, as well as radiation from the surface layers. We infer a drop of the photospheric temperature from 15750 K down to 8200 K in that period. (We define the photosphere as the ejecta location where the inward integrated optical depth at 5000Å, including bound-free, free-free, and electron-scattering opacity processes, is equal to two-thirds.) The corresponding constraints from the observations are the fast changing UV flux/magnitude and the strengthening of line blanketing in the UV and, more modestly, in the optical. Line identifications apply here the same way as for SN 1999em (Dessart & Hillier 2006), but with a few alterations. The first spectrum is likely closer to the explosion date (see Dessart et al. 2006), showing much weaker lines and a steeper spectrum than for SN 1999em. The ejecta of SN 2005cs is also slower, so that we not only confirm the presence of Nii lines (Dessart & Hillier 2006) but also of Oii at 4600Å. The Siii 6355Å line is also well resolved, while it overlapped with the H trough in SN1999em (Dessart & Hillier 2006; Leonard et al. 2002b) or SN1999gi (Leonard et al. 2002a).
The temporal evolution of the flux distribution reflects first the cooling of the photosphere. At the base of our two CMFGEN models (corresponding to a Rosseland optical depth of 70 and 73, or a radius of 1.6 and 4.176 1014 cm for the two selected dates), the electron temperature varies from 40750 K down to 23670 K, and the corresponding flux distributions, which match blackbodies at such depths, peak at 710Å and 1220Å. We thus see that the intrinsic photon distribution softens significantly, although it still peaks in the UV. The flux distribution that emerges peaks further to the red due to the intervening blocking of light in the UV, between the thermalization layer where the photon distribution is characterized to layers where it escapes freely. We illustrate this effect in Fig. 6 by showing the radial variation in the comoving frame (the radiation field appears redshifted with increasing radius) of the mean intensity () normalized to the continuum mean intensity (; bottom panels), for the June 30th (left) and the July 5th (right) models. Here the continuum mean intensity is computed by solving the radiative transfer equation for the processes associated with the continuum only. At the base is unity, but as we cross the photosphere (at 1.4 for June 30 and 2 for July 5, where is the base model radius), this ratio suddenly drops below unity in the UV, while showing the appearance of many lines in the optical. At such early times, optical lines are mostly of Hi and Hei, with weaker contributions from Nii and Oii. In the top panel, we show the emergent synthetic spectrum (normalized to the continuum) for comparison. Hence, we see that line blanketing plays a strong role in the UV, but it operates on a photon distribution that becomes more and more depleted in the UV as time progresses. Our model atmosphere calculations support a purely photospheric origin for the observed flux, both for the UV and the optical ranges, and thus do not suggest any sizeable CSM contribution (ignoring the underlying HII region contribution). These two combined effects, the reddening of the continuum and the strengthening of the line blanketing, explain the color evolution of SN 2005cs and in particular confirm the “thermal”, photospheric origin of this radiation. Work is underway to interpret quantitatively the absolute flux levels observed, with links to the explosion energy and the ejecta kinematics.
3.4 X-Ray Results
The upper limit from the merged 26.8 ks XRT observation (after screening out the day of the X-Ray flash) corresponds to an unabsorbed X-ray flux and luminosity of and , respectively for an assumed thermal plasma spectrum with a temperature of 10 keV, an absorbing foreground column density of (Dickey & Lockman, 1990) and a distance of 8 Mpc. SNe IIP have been detected in X-rays in the past (SN 1999em, Pooley et al., 2002; SN 1999gi, Schlegel, 2001; SN2004dj, Pooley & Lewin, 2004) but usually at lower luminosities (typically around ) than our upper limits for SN 2005cs. But these observations do rule out an X-ray bright SN more luminous than SN 1994W (), a IIP with optical evidence for CSM interaction (Schlegel, 1999). The typically faint X-ray luminosity is attributed to a low density CSM surrounding the progenitor stars (Schlegel, 2001). The presence of X-rays would likely indicate interaction with the CSM which would also affect the UV luminosity. Thus the lack of X-rays is consistent with the photospheric origin of the UV radiation discussed previously.
We calculated the upper limit to the mass-loss rate of the progenitor assuming a shock velocity of 10,000 and following the description by Immler, Wilson & Terashima (2002). A 3-sigma upper limit of , where corresponds to the wind velocity, is obtained for a median date of the XRT observations around days after the outburst. The upper limit to the mass loss-rate is consistent with those of core-collapse SN progenitors, which are in the range to (Immler & Lewin, 2003) and times smaller than that of highly interacting SNe such as SN 1979C (Immler et al., 2005).
4 Summary
SN 2005cs is the first SN IIP with a well observed UV light curve, and is an important addition to the SNe II observed in the UV by IUE and HST. The rapid drop in the UV shows the importance of quick response observations, as the emergent flux is dominated by the UV for only about a week after the explosion. The agreement of our CMFGEN models with the UVOT photometry and optical spectra (for a unique set of SN ejecta parameters), the identification of absorption lines in the UV (e.g., Mgii 2798Å) and in the optical (e.g., Hi Balmer lines with comparable, Doppler-broadened widths), and the non-detection of X-rays all point to a photospheric origin of the UV emission and a lack of strong CSM interaction. The early UV photometry presented in this paper demonstrates the temporal effects of photospheric cooling and line blanketing which can be reproduced by the non-LTE model atmosphere code CMFGEN. The effort to understand these effects will be continued by increasing the sample of UV light curves and spectra of SNe II with Swift in order to provide constraints for the spectroscopic modeling of multiple objects. These observations will also provide X-ray observations probing earlier times than have been studied in the past.
References
- Barbon, Ciatti & Rosino (1982) Barbon, R., Ciatti, F. & Rosino, L. 1982, 116, 32
- Barbon, Ciatti & Rosino (1979) Barbon, R., Ciatti, F. & Rosino, L. 1979, 72, 287
- Baron (2006) Baron, E. 2006, preprint (astro-ph/0611545)
- Baron et al. (1996) Baron, E., Hauschildt, P. H., Branch, D., Kirshner, R. P. & Filippenko, A. V. 1996, MNRAS, 279, 799
- Baron et al. (1995) Baron, E., Hauschildt, P. H., Branch, D., Austin, S., Garnavich, P., Bae Ann, H., Wagner, R.M., Filippenko, A. F., Matheson, T., & Lebert, J. 1995, ApJ, 441, 170
- Baron et al. (2000) Baron, E., et al. 2000, ApJ, 545, 444
- Bianchi et al. (2004) Bianchi, L. et al. 2005, ApJL, 619, 71
- Branch (1987) Branch, D. 1987, 320, L121
- Brown & Immler (2006) Brown, P. J.& Immler, S. 2006, ATEL 761
- Burrows et al. (2005) Burrows, D. et al. 2005, Space Sciences Reviews, 120, 165
- Buta (1982) Buta, R. J., 1982, PASP, 94, 578
- Cardelli, Clayton & Mathis (1988) Cardelli, J. A., Clayton, G. C. & Mathis, J. S. 1988, ApJ, 329, 33
- Calzetti et al. (2005) Calzetti, D. et al. 2005, ApJ, 633, 871
- Cappellaro, Turatto & Fernley (1995) Cappellaro, E., Turatto, M. & Fernley, J. 1995, IUE–ULDA Access Guide #6 – SNe, ESA
- Ciardullo et al. (2002) Ciardullo, R., Feldmeier, J. J., Jacoby, G. H., Kuzio de Naray, R., Laychak, M. B. & Durrell, P. R. 2002, ApJ, 577, 31
- Crowther, Lennon & Walborn (2006) Crowther, P. A., Lennon, D. J. & Walborn, N. R. 2006, A&A, 446, 279
- Dessart & Hillier (2006) Dessart, L. & Hillier, D. J. 2006, A&A, 447, 691
- Dessart & Hillier (2005) Dessart, L. & Hillier, D. J. 2005, A&A, 437, 667
- Dewangan et al. (2005) Dewangan, G. C., Griffiths, R. E., Choudhury, M., Miyaji, T. & Schurch, N. J. 2005, ApJ, 635, 198
- Dickey & Lockman (1990) Dickey, J. M. & Lockman, F. J. 1990, ARAA, 28, 215
- Feldmeier, Ciardullo & Jacoby (1997) Feldmeier, J. J., Ciardullo, R. & Jacoby, G. H. 1997, ApJ, 479, 231
- Fransson (1984) Fransson, C. 1984, A&A, 133, 264
- Gehrels et al. (2005) Gehrels, N., et al. 2005, ApJ, 611, 1005
- Georgiev et al. (1990) Georgiev, T. V., Getov, R. G., Zamanova, V. I. & Ivanov, G. R. 1990, Soviet Astronomy Letters, 16, 420
- Hillier & Miller (1998) Hillier, D. J. & Miller, D. L. 1998, ApJ, 496, 407
- Immler et al. (2006) Immler, S. et al. 2006, ApJ, submitted
- Immler & Brown (2006) Immler, S. & Brown, P. J. 2006, ATEL 776
- Immler et al. (2005) Immler, S. et al. 2005, ApJ, 632, 283
- Immler, Kong & Lewin (2005) Immler, S., Kong, A. & Lewin, W. H. G. 2005, IAU Circ 8564
- Immler & Lewin (2003) Immler, S. & Lewin, W. 2003, in Supernovae and Gamma-Ray Bursters (ed K. Weiler), Lecture Notes in Physics, 598, 91
- Immler, Wilson & Terashima (2002) Immler, S., Wilson, A. S., Terashima, Y., 2002, ApJ, 573, L27
- Jeffery et al. (2006) Jeffery, D. J., Ketchum, W., Branch, D., Baron, E., Elmhamdi, A., & Danziger, I. J. pre-print(astro-ph/0607084)
- Jeffery et al. (1994) Jeffery, D. J. et al. 1994, ApJ, 421, L27
- Kirshner et al. (1987) Kirshner, R. P., Sonneborn, G., Crenshaw, D. M., & Nassiopoulos, G. E. 1987, ApJ, 320, 602
- Kloehr (2005) Kloehr, W. 2005, IAU Circ 8553
- Leonard et al. (2002a) Leonard, D. C., et al. 2002a, AJ, 124, 2490
- Leonard et al. (2002b) Leonard, D. C., et al. 2002b, PASP, 114, 35
- Li et al. (2006) Li, W., Van Dyk, S. D., Filippenko, A. V., Cuillandre, J., Jha, S., Bloom, J. S., Riess, A. G. & Livio, M. 2006, ApJ, 641, 1060
- Lucy (1987) Lucy, L. B. 1987, A&A, 182, L31
- Mazzali & Lucy (1993) Mazzali, P. A. & Lucy, L. B. 1993, A&A 279, 447
- Maund, Smartt & Danziger (2005) Maund, J. R., Smartt, S. J., & Danziger, I. J. 2005, MNRASL, 364, 33
- Modjaz, Kirshner & Challis (2005) Modjaz, M., Kirshner, R. & Challis, P. 2005, IAU Circ 8491
- Nota et al. (1996) Nota, A., Jedrezejewski, R., Voit, M., & Hack, W. 1996, FOC Instrument Handbook Version 7.0 (Baltimore: STScI)
- Panagia (2003) Panagia, N. 2003, in SNe and Gamma-Ray Bursters. ed. K. Weiler, 598, 113
- Panagia et al. (1980) Panagia, N. et al. 1980, MNRAS, 192, 861
- Pastorello et al. (2006) Pastorello, A., et al. 2006, MNRAS, 370, 1752
- Pooley et al. (2002) Pooley, D. et al. 2002, ApJ, 572, 932
- Pooley & Lewin (2004) Pooley, D. & Lewin, W. H. G. 2004, IAU Circ. 8390
- Pun et al. (1995) Pun, C. S. J. et al. 1995, ApJSS, 99, 223
- Richmond et al. (1994) Richmond, M. W., Treffers, R. R., Filippenko, A. V., Paik, Y., Leibundgut, B., Schulman, E. & Cox C. V. 1994, AJ, 107, 1022
- Roming et al. (2005) Roming, P. W. A., et al. 2005, Space Science Reviews, 120, 95
- Sandage & Tammann (1974) Sandage, A. & Tammann, G. A. 1974, ApJ, 194, 559
- Schlegel, Finkbeiner & Davis (1998) Schlegel, D. J., Finkbeiner, D. P. & Davis, M. 1998, ApJ, 500, 525
- Schlegel (1999) Schlegel, E. M. 1999, ApJ, 527, L85
- Schlegel (2001) Schlegel, E. M. 2001, ApJ, 556, L25
- Tonry et al. (2001) Tonry, J. L., Dressler, A., Blakeslee, J. P., Ajhar, E. A., Fletcher, A. B., Luppino, G. A., Metzger, M. R. & Moore, C. B. 2001, ApJ, 546, 681
- Takáts & Vinkó (2006) Takáts, K. & Vinkó, J. 2006, astro-ph/0608430
- Tsvetkov et al. (2006) Tsvetkov, D. Y., Volnova, A. A., Shulga, A. P., Korotkiy, S. A., Elmhandi, A., Danziger, I J. & Ereshko, M. V. 2006, A&A submitted, astro-ph/0605184
| Filter | FWHM | Zeropoint | Flux Density | |
|---|---|---|---|---|
| (Å) | (Å) | (mag) | (10-16 ergs cm) | |
| UVW2 | 1880 | 760 | ||
| UVM2 | 2170 | 510 | ||
| UVW1 | 2510 | 700 | ||
| 3450 | 875 | |||
| 4390 | 980 | |||
| 5440 | 750 |
Note. — refers to the central wavelength of the filter’s effective area curve. The flux density is a multiplicative conversion from count rate to flux density assuming a Vega spectrum. The zeropoints and flux density factors correspond to a source with a Vega-like spectrum and a count rate of one count per second.
| JD | UVW2 | UVM2 | UVW1 | |
|---|---|---|---|---|
| 2453552.4 | ||||
| 2453555.1 | ||||
| 2453557.3 | ||||
| 2453557.9 | ||||
| 2453558.8 | ||||
| 2453560.0 | ||||
| 2453560.6 | ||||
| 2453562.0 | ||||
| 2453562.8 | ||||
| 2453565.0 | ||||
| 2453567.0 | ||||
| 2453571.0 | ||||
| 2453573.5 | ||||
| 2453628.5 |
Note. — The observation time is given as the Julian Date (JD) of the middle of the set of exposures. These values have not been corrected for extinction. The errors given are statistical errors.
| Observation Sequence | Date (UT) | Exposure | Grism |
|---|---|---|---|
| (Seconds) | |||
| 00030083007 | 3 Jul 2005 | 2078.1 | V |
| 00030083008 | 3 Jul 2005 | 2078.5 | UV |
| 00030083012 | 6 Jul 2005 | 2137.9 | UV |
| 00030083017 | 8 Jul 2005 | 2017.7 | UV |
| 00030083023 | 11 Jul 2005 | 2077.7 | UV |
| 00030083027 | 13 Jul 2005 | 1788.3 | UV |
| 00030083035 | 19 Jul 2005 | 1955.2 | UV |