Mid-infrared observations of NGC 1068 with VLT/VISIR
Abstract
We present a speckle analysis of the active galactic nucleus (AGN) inside the archetype Seyfert type 2 galaxy NGC 1068. This study is based on 12.8 m images obtained with the burst mode of VISIR (the Very Large Telescope Imager and Spectrometer in the InfraRed). The interferometric processing allows to push the resolution far below the diffraction limit of a 8 m telescope in the band and to trace two main contributions to the mid-IR flux inside the nucleus. It also allows to partially fill the lack of visibility points at low spatial frequencies. The confrontation with VLT/MIDI (the Mid-InfrareD Interferometer) data points helps to establish the link between dust in the vicinity of the central engine and inside the ionisation cone to get a multi-scale picture of mid-IR sources emitting in the nucleus of NGC 1068.
1. Speckle analysis of VISIR BURST mode images
The speckle processing of 12.8 m VISIR burst mode images aims to fully benefit of the diffraction limit of a UT (Unit Telescope of 8 m at the VLT). Low spatial frequency visibilities between 0 and 8 m (refered as VISIR visibilities) are obtained from the Fourier transform of the source distribution of intensity.
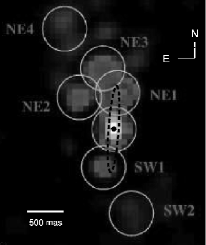
The application of a model (containing a priori information on the source) allows to extrapolate high-spatial frequency visibilities from the low spatial frequency ones and then to estimate structures smaller than the diffraction limit ( 320 mas at 12.8 m). In this way, the model accounting for the VISIR visibilities considers two main contributions to the MIR flux: (i) a small component of 85 mas, well below the diffraction limit and in full agreement with the sizes of the dusty torus from Jaffe et al. (2004) and Poncelet et al. (2006a); (ii) a NS elongated one at P.A. = -4∘, 140 mas 1197 mas (Poncelet et al. 2006b), is associated to knots NE1 and SW1 from deconvolved images of VISIR standard mode images (Galliano et al. 2005) (see Fig. 1). It shows the good consistency between the two approaches.
2. The link between VISIR and MIDI visibilities
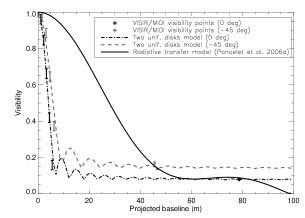
To confront [0 - 8] m VISIR visibilities with MIDI data of 2003, we take into account the limited field of view of MIDI (i.e. a 0.6 0.6′′ area oriented at -30∘) in the speckle processing. Fig. 2 presents the confrontation between low spatial frequency visibilities then obtained and MIDI data points of 2003. It illustrates the strong and unexpected drop of visibilities at short baselines. Both data sets are well reproduced by a model of two components entering in the field of view of MIDI: a compact one ( 20 mas) associated to the dusty layer, and an extended one ( 400 mas) associated with heated dust in the ionisation cone (Poncelet et al. 2006b). This amount of dust of the ionisation cone entering in the field of view of MIDI has then to be taken into account during the modelling of interferometric data.
References
- Galliano et al. (2005) Galliano, E., Pantin, E., Alloin, D., Lagage, P.O., 2005, MNRAS, 363, 1
- Jaffe et al. (2004) Jaffe, W., Meisenheimer, K., Rottgering, H.J.A. et al., 2004, Nature, 429, 47
- Poncelet et al. (2006a) Poncelet, A., Perrin, G. and Sol, H., 2006a, A&A, 450, 483
- Poncelet et al. (2006b) Poncelet, A., Doucet, C., Perrin, G., Sol, H., Lagage, P.O., 2006b, A&A, submitted