The Quest for a Complete Census of AGN Activity
Abstract
Deep X-ray surveys provide the most efficient identification of Active Galactic Nuclei (AGN) activity. However, recent evidence has indicated that the current keV surveys do not detect the most heavily obscured AGNs. Here we explore whether the X-ray undetected AGN population can be identified within the ultra-deep Spitzer survey of the GOODS-N field using X-ray stacking techniques. We find evidence for AGN activity in the Spitzer dataset and the strongest and hardest X-ray signal is produced by galaxies with starburst-like infrared spectral slopes and median properties of 0.8 and . The stacked X-ray properties suggest that obscured AGN activity is present in these sources, with a median X-ray spectral slope of and erg s-1. These overall properties are consistent with the obscured AGN population expected to produce the unresolved X-ray background.
Department of Physics, Durham University, Durham DH1 3LE, UK
1. Introduction
There is a growing need for a complete census of AGN activity. The seminal discovery that every massive galaxy in the local Universe harbors a super-massive black hole (SMBH; ) implies that all galaxies have hosted AGN activity at some time during the past 13 Gyrs (e.g., Rees 1984; Kormendy & Richstone 1995). To accurately trace how and when these SMBHs grew requires a detailed census of AGN activity that will provide, amongst other things, constraints on the efficiency and duty cycle of SMBH growth. The finding that the mass of the SMBH is proportional to that of the galaxy spheroid also indicates that the growth of SMBHs and their host galaxies are regulated in some way (e.g., Magorrian et al. 1998; Gebhard et al. 2000). Whether or not this growth occured concordantly is unknown but comparisons between the rate of star formation and SMBH growth, both in individual objects and from a cosmic census, will provide important insight.
2. Selecting and Identifying AGN Activity
Since obscured AGNs outnumber unobscured AGNs by a factor of 3–10, any “complete” census of AGN activity must be sensitive to the detection and identification of obscured sources. X-ray emission is relatively impervious to obscuration, at least at high energies, and the detection of luminous or hard X-ray emission provides an almost unambiguous identification of AGN activity even in the absence of source redshifts. For this reason, the most complete census of AGN activity to date is provided by deep X-ray surveys. For example, the 2 Ms Chandra Deep Field North (CDF-N; Alexander et al. 2003) survey identifies a times larger AGN source density ( 7200 deg-2, Bauer et al. 2004) than found in optical surveys; see Fig. 1a for the sensitivity of the CDF-N to AGN objects.
However, although deep X-ray surveys have proved stunningly effective at identifying both obscured and unobscured AGN activity (see Brandt & Hasinger 2005 for an overall review), there is clear evidence that a large fraction of the AGN population remains undetected in the keV (observed frame) band probed by these surveys: (1) about half of the X-ray background is unresolved at keV (Worsley et al. 2005), (2) the obscured:unobscured AGN ratio is much lower than that found for comparably luminous AGNs in the local Universe (e.g., Treister & Urry 2005), and (3) few Compton-thick AGNs ( cm-2) have been identified, even though they comprise 50% of the AGN population in the local Universe (e.g., Tozzi et al. 2006; Page et al. 2006).
Many of these X-ray undetected AGNs are likely to be intrinsically luminous sources that are heavily obscured (–10 cm-2) by an optically and geometrically thick torus of gas and dust (e.g., Worsley et al. 2005; see Fig. 1a for the detectability of the intrinsically luminous AGN in NGC 1068 in the CDF-N observations). Although the primary emission from these obscured AGNs will be absorbed by the torus and rendered weak or invisible at X-ray–optical wavelengths, it will heat the dust grains and re-emit this emission relatively isotropically in the infrared (IR) waveband (rest-frame m; e.g., Granato & Danese 1994; Efstathiou & Rowan-Robinson 1995). The intrinsically luminous but X-ray undetected AGNs should therefore be detected in deep IR surveys; see Fig. 1b.111High-resolution radio observations also provide effective obscuration-independent selection of AGNs. However, most radio surveys are either confined to relatively rare AGN source populations, such as high- radio-loud AGNs or to AGN activity in nearby galaxies (but see Donley et al. 2005). Future radio observatories such as the Square Kilometer Array will provide an extremely sensitive AGN census but will not be fully operational for years (e.g., Jarvis & Rawlings 2004); see http://www.skatelescope.org/. Since star formation can also produce luminous IR emission it is necessary to distinguish between AGNs and starburst galaxies. A number of recent studies have demonstrated that IR colours can often distinguish between AGN and star-formation activity using crude IR data, with the former having “hotter” IR spectral energy distributions (SEDs; e.g., Lacy et al. 2004; Stern et al. 2005). However, since a large fraction of the AGN population in the local Universe has IR colors similar to those of starburst galaxies, other indicators (e.g., the detection of high-excitation emission lines, hard X-ray emission from stacking analyses of samples of objects, and luminous unresolved radio emission) are also required to identify AGN activity from star formation.
The primary aim of this article is to investigate the prospects for selecting X-ray undetected AGN with Spitzer observations in the ultra-deep CDF-N/GOODS-N field to increase the AGN census beyond that identified from the X-ray data alone. Here we select X-ray undetected AGN candidates using the Spitzer GOODS-N observations and then search for the presence of hard X-ray emission using X-ray stacking techniques. From these results we place constraints on the demographics and properties of AGN activity in the IR galaxy population.
3. Searching for a large X-ray-undetected AGN population in the CDF-N/GOODS-N field
The Spitzer GOODS observations (P.I. M. Dickinson) were performed as part of the Spitzer Legacy program and cover 160 arcmin2 of the most sensitive regions in each of the Chandra deep fields (the CDF-N and the CDF-S). The IRAC 3.6–8 m and MIPS 24 m Spitzer observations are the deepest across the sky, achieving typical 1 sensitivities of 0.03–0.3 Jy (3.6–8 m) and 5 Jy (24 m). Here we focus on the CDF-N/GOODS-N field, which has the deepest X-ray coverage to date. To provide maximum sensitivity to X-ray faint AGN activity we restrict our analyses to the region within 5.5 arcmin of the Chandra aimpoint (95 arcmin2), where the X-ray sensitivity and angular resolution is optimal; see Figs. 18 & 19 of Alexander et al. (2003). There are 223 X-ray sources, 1800 MIPS 24 m sources, and 3400 IRAC 8 m sources within this region.
3.1. X-ray Detected Infrared Galaxies
The X-ray sources were matched to the IR sources on the basis of the X-ray source positional uncertainties given in Alexander et al. (2003). The positional uncertainites were linearly increased to give a 3% spurious source match fraction; extensive Monte-Carlo tests were used to determine the spurious match fraction. Overall, 78% and 87% of the X-ray sources were matched to 24 m and 8 m sources, respectively. Using the multi-wavelength source classification of Bauer et al. (2004) we distinguished between X-ray detected AGNs and X-ray detected starbursts. The X-ray sources comprise 9.4% of the 24 m source population (7.0% X-ray AGNs and 2.4% X-ray starbursts) and 5.6% of the 8 m source population (4.3% X-ray AGNs and 1.3% X-ray starbursts).
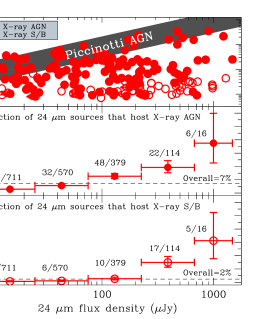
Fig. 2 shows the X-ray vs 24 m properties of the X-ray sources, including the X-ray AGNs and X-ray starburst fraction for different 24 m flux density bins. As expected, the majority of the X-ray AGNs have X-ray–IR flux ratios higher than those of the X-ray starbursts. Fig. 2 also shows a clear drop in the X-ray detected fraction of IR sources towards the faintest IR fluxes. This is at least partially due to the linear decrease in the observed X-ray–IR flux ratio with 24 m flux density, suggesting that the majority of the X-ray undetected AGN population will have faint IR fluxes.222This is clearly a simplistic prediction since Fig. 2 doesn’t take into account possible changes in redshift and SED for sources in the different 24 m flux-density bins but it is at least qualitatively similar to the conclusions drawn from the AGN population synthesis model of Treister et al. (2006).
3.2. Searching for X-ray Undetected AGNs
Evidence for an X-ray undetected AGN population can be explored using X-ray stacking techniques. The principle behind this approach is to stack the X-ray data of individually undetected Spitzer sources and determine the probability that the stacked X-ray signal could be produced by the background (e.g., Brandt et al. 2001; the background is determined from a Monte-Carlo analysis of source-excluded regions around the stacked sources. The expected signature of a significant obscured AGN population is a detection in the hard (2–8 keV) band and a comparatively flat X-ray spectral slope (). By comparison, unobscured/low-luminosity AGN and typical starburst galaxies have softer X-ray spectral slopes ( 2; e.g., Ptak et al. 1999; George et al. 2000). We note that neutron-star X-ray binary populations can also have flat X-ray spectral slopes (e.g., Colbert et al. 2004), however, it seems unlikely that the integrated X-ray emission from a starburst galaxy will be dominated by this comparatively rare galactic population.
For the stacking analyses we have used the procedure outlined in Worsley et al. (2006) and stacked Spitzer galaxies in the soft (0.5–2 keV), hard (2–8 keV), and full (0.5–8 keV) bands. The background was determined using 1,000 Monte-Carlo trials for each stacked source and the X-ray counts were measured using apertures based on the 90% encircled-energy radius. Stacking all of the X-ray undetected IR sources we obtain highly significant detections ( 10 ) in all three X-ray bands, corresponding to an overall X-ray spectral slope of and suggesting that some of the stacked sources are likely to be obscured AGNs (contrast with the result obtained by Alexander et al. 2002 using shallower 15 m data over a smaller area); this is further confirmed by a 3.5 detection in the ultra-hard (4–8 keV) band. We also stacked the data in the 6–8 keV band and obtained a non detection in this band; the 3 upper limit corresponds to 20% of the 6–8 keV background. If a substantial fraction of the X-ray background is unresolved in the 6–8 keV band by current X-ray surveys, as suggested by the analyses of Worsley et al. (2005), then the other contributing sources must be either IR-faint ( Jy) or comparatively rare in 100 arcmin2 regions.
A basic interpretation of the data in Fig. 2 is that X-ray undetected AGNs will be predominantly detected at the faintest IR fluxes. To test this simple prediction we stacked the X-ray data for individually undetected sources in different 24 m flux-density bins; see Fig. 3a. The 2–8 keV stacked flux generally increases towards fainter 24 m flux densities, suggesting an increase in the contribution from obscured AGN activity, with the 75–225 Jy bin producing the strongest and hardest X-ray signal. However, the softer X-ray spectral slope for sources with 25–75 Jy implies that starburst galaxies probably dominate the stacked X-ray emission at the faintest IR fluxes. Furthermore, the comparatively weak 2–8 keV flux suggests that there may be fewer obscured AGNs than at 75–225 Jy, possibly indicating a genuine drop in the number of obscured AGNs at low IR luminosities or at high redshifts ( 75 Jy corresponds to at ). These results are qualitatively similar to those expected from the AGN population synthesis model of Treister et al. (2006) and the interpretation of shallower Spitzer and X-ray data by Brand et al. (2006). More detailed analyses are required to provide definitive conclusions.
We can also explore the average X-ray properties of the Spitzer sources as a function of IR spectral slope (, where ). In the local Universe many AGNs have flat IR spectral slopes while starburst galaxies are often distinguished by steeper IR spectral slopes. Alonso-Herrero et al. (2006) investigated the detailed properties of Spitzer galaxies with flat IR spectral slopes () in the 1 Ms CDF-S field and deduced that only 50% of these IR-selected AGNs are detected in the X-ray band. Although the flat IR spectral slopes of these sources clearly indicate that they host AGN activity, they are comparatively rare ( 800 sources deg-2, including both X-ray detected and X-ray detected AGNs) and unlikely to dominate the unresolved keV background. As a comparison, the range of IR spectral slopes for the X-ray detected AGN in the CDF-N/GOODS-N dataset is –1.0, and only 30% have , indicating that many have IR spectral properties more consistent with those of starburst galaxies. Since the aim of the study here is to provide the most complete census of AGN activity, we have stacked the X-ray data of Spitzer galaxies over a wide range of IR spectral slopes (, –0.0, 0.0–0.5, 0.5–1.0). The X-ray spectral slope and 2–8 keV flux density of the stacked sources are shown in Fig. 3b. All are significantly detected in the 2–8 keV band but the strongest and hardest X-ray signal comes from the sources with the steepest IR spectral slope ( 0.5–1.0). The steep IR spectral slope of these sources does not obviously imply the presence of AGN activity but the hard X-ray signal ( 1.2) indicates that a considerable fraction of the sources host obscured AGN activity. Motivated by the discovery that sources with 75 Jy show greater evidence for X-ray undetected AGN activity (see Fig. 3a), we further stacked the sources in two different 24 m flux bins ( 25–75 Jy and 75 Jy). The flatter X-ray spectral slope () and larger 2–8 keV flux density of the 75 Jy sources with 0.5–1.0 clearly indicates that the majority of the obscured AGNs reside in this population.
4. Discussion
The X-ray stacking analyses provide evidence that a large X-ray undetected AGN population does indeed reside in the Spitzer galaxy population. The dominant AGN population has an IR spectral slope of 0.5–1.0 and 75 Jy. Their IR colors are more similar to starburst galaxies than AGNs but X-ray stacking analyses indicate that they host obscured AGN activity. We can gain further insight into the properties of these sources by investigating their median redshifts, luminosities, and source densities.
The median spectroscopic redshift of the 0.5–1.0 Spitzer galaxies is 0.8, which corresponds to an median luminosity of ; the majority of the redshifts were taken from Wirth et al. (2004). Assuming this median redshift, the 2–8 keV luminosity of the stacked sources with 0.5–1.0 and 75 Jy is erg s-1 (rest-frame 3.6–14.4 keV). This X-ray luminosity should be considered a lower limit since (1) many of the stacked galaxies will not be AGNs and their inclusion in the stacking analysis will decrease the average 2–8 keV flux, and (2) the luminosity has not been corrected for the presence of instrinsic absorption. These two issues are briefly considered below.
We cannot directly determine the “dilution” to the hard-band X-ray signal from non-AGN activity, however, we can place constraints from the non-detection of individual sources in the X-ray data. For example, if the X-ray undetected AGN represented just 1% of the stacked IR galaxies but contributed all of the 2–8 keV flux then they would have individual 2–8 keV luminosities 2 orders of magnitude higher and would be individually detected in the X-ray data. Therefore, since the stacked 2–8 keV flux is an order of magnitude below the individual X-ray sensitivity limit, these X-ray undetected AGNs are likely to represent % of the stacked IR galaxies. This indicates an average observed (i.e., uncorrected for absorption) 2–8 keV luminosity of – erg s-1 and places lower limits on the X-ray undetected obscured AGN source density of 500–5,000 deg-2 (for AGNs with 0.5–1.0 and 75 Jy).
A crude constraint on the amount of absorption towards the AGNs can be determined from the average X-ray spectral slope for a given AGN model (e.g., an observed X-ray spectral slope of 1.0 from a 0.8 AGN would imply cm s-2 for a simple intrinsic AGN power-law spectrum of ). Since the soft-band flux almost certainly has a large contribution from star-formation activity, this approach effectively provides a lower limit on the true absorbing column density. Another approach, albeit very uncertain, is to estimate the intrinsic (i.e., corrected for absorption) X-ray luminosity of the AGNs from the IR luminosities and then compare this to the observed X-ray luminosity. Under the assumption that 10–100% of the IR luminosity is powered by an AGN, the median X-ray luminosity of these sources estimated from the Elvis et al. (1994) SED is – erg s-1, suggesting large amounts of absorption ( cm-2).
Although these analyses on the properties of the X-ray undetected AGNs are crude, their estimated properties are qualitatively consistent with those required by Worsley et al. (2005) to produce the unresolved X-ray background (i.e., 0.5–1.5, – cm-2, – erg s-1). Interestingly, the median redshift, IR luminosity, and X-ray luminosity range of the X-ray detected AGNs with 0.5–1.0 are also similar to those estimated for the X-ray undetected AGNs with 0.5–1.0. This is entirely consistent with that expected for the unified AGN model, where the X-ray undetected AGNs represent the more heavily obscured counterparts of the X-ray detected AGNs. Detailed observations of individual objects are now required to elucidate the properties of this X-ray undetected AGN population.
Acknowledgments.
I thank the Royal Society for support and my collaborators on this project so far: R. Chary, M. Dickinson, F. Bauer, W. Brandt, A. Fabian, M. Worsley, and the Spitzer-GOODS team.
References
- Alexander et al. (2001) Alexander, D. M., et al. 2001, AJ, 122, 2156
- Alexander et al. (2002) Alexander, D. M., et al. 2002, ApJ, 568, L85
- Alexander et al. (2003) Alexander, D. M., et al. 2003, AJ, 126, 539
- Alonso-Herrero et al. (2006) Alonso-Herrero, A., et al. 2006, ApJ, 640, 167
- Bauer et al. (2004) Bauer, F. E., et al. 2004, AJ, 128, 2048
- Brand et al. (2006) Brand, K., et al. 2006, ApJ, 644, 143
- Brandt et al. (2001) Brandt, W. N., et al. 2001, ApJ, 558, L5
- Brandt & Hasinger (2005) Brandt, W. N., & Hasinger, G. 2005, ARA&A, 43, 827
- Colbert et al. (2004) Colbert, E. J. M., et al. 2004, ApJ, 602, 231
- Donley et al. (2005) Donley, J. L., Rieke, G. H., Rigby, J. R., & Pérez-González, P. G. 2005, ApJ, 634, 169
- Efstathiou & Rowan-Robinson (1995) Efstathiou, A., & Rowan-Robinson, M. 1995, MNRAS, 273, 649
- Elvis et al. (1994) Elvis, M., et al. 1994, ApJS, 95, 1
- Gebhard et al. (2000) Gebhardt, K., et al. 2000, ApJ, 539, L13
- George et al. (2000) George, I. M., et al. 2000, ApJ, 531, 52
- Granato & Danese (1994) Granato, G. L., & Danese, L. 1994, MNRAS, 268, 235
- Jarvis & Rawlings (2004) Jarvis, M. J., & Rawlings, S. 2004, New Astronomy Review, 48, 1173
- Kormendy & Richstone (1995) Kormendy, J., & Richstone, D. 1995, ARA&A, 33, 581
- Lacy et al. (2004) Lacy, M., et al. 2004, ApJS, 154, 166
- Magorrian et al. (1998) Magorrian, J., et al. 1998, AJ, 115, 2285
- Mainieri et al. (2005) Mainieri, V., et al. 2005, A&A, 437, 805
- Page et al. (2006) Page, M. J., et al. 2006, MNRAS, 369, 156
- Piccinotti et al. (1982) Piccinotti, G., et al. 1982, ApJ, 253, 485
- Ptak et al. (1999) Ptak, A., Serlemitsos, P., Yaqoob, T., & Mushotzky, R. 1999, ApJS, 120, 179
- Rees (1984) Rees, M. J. 1984, ARA&A, 22, 471
- Stern et al. (2005) Stern, D., et al. 2005, ApJ, 631, 163
- Tozzi et al. (2006) Tozzi, P., et al. 2006, A&A, 451, 457
- Treister & Urry (2005) Treister, E., & Urry, C. M. 2005, ApJ, 630, 115
- Treister et al. (2006) Treister, E., et al. 2006, ApJ, 640, 603
- Wirth et al. (2004) Wirth, G. D., et al. 2004, AJ, 127, 3121
- Worsley et al. (2005) Worsley, M. A., et al. 2005, MNRAS, 357, 1281
- Worsley et al. (2006) Worsley, M. A., et al. 2006, MNRAS, 368, 1735