INAF–Osservatorio Astronomico di Brera, Via E. Bianchi 46, I-23807 Merate (LC), Italy Università degli Studi di Milano, Bicocca, Piazza delle Scienze 3, I-20126, Milano, Italy NASA/Goddard Space Flight Center, Greenbelt, MD 20771, USA National Research Council, 2101 Constitution Avenue, NW TJ2114, Washington, DC 20418, USA INAF–Istituto di Astrofisica Spaziale e Fisica Cosmica, Via U. La Malfa 153, I-90146 Palermo, Italy Universities Space Research Association, 10211 Wincopin Circle, S. 500, Columbia, MD 21044, USA Department of Physics & Astronomy, University of Leicester, LE1 7RH, UK Ioffe Physico-Technical Institute, 26 Polytekhnicheskaya, St. Petersburg 194021, Russian Federation Department of Physics, University of Nevada, Las Vegas, NV 89154-4002, USA Dept. of Astronomy & Astrophysics, Pennsylvania State University, University Park, PA 16802, USA ASI Science Data Center, Via G. Galilei, I-00044 Frascati (Roma), Italy Los Alamos National Laboratory, MS B244, NM 87545, USA INAF–Osservatorio Astronomico di Roma, Via di Frascati 33, I-00040 Monteporzio Catone, Italy International School for Advanced Studies (SISSA-ISAS), Via Beirut 2-4, I-34014 Trieste, Italy \PACSes\PACSit98.70.Rz-ray sources; -ray bursts \PACSit01.30.CcConference proceedings
Panchromatic study of GRB 060124: from precursor to afterglow
Abstract
We present observations of GRB 060124, the first event for which both the prompt and the afterglow emission could be observed simultaneously and in their entirety by the three Swift instruments and by Konus-Wind. Thanks to these exceptional circumstances, the temporal and spectral properties of the prompt emission could be studied in the optical, X-ray and gamma-ray ranges (up to 2 MeV). While the X-ray emission (0.2–10 keV) clearly tracks the gamma-ray burst, the optical component follows a different pattern, likely indicating a different origin, possibly the onset of external shocks. The prompt GRB spectrum shows significant spectral evolution, with both the peak energy and the spectral index varying. As observed in several long GRBs, significant lags are measured between the hard- and low-energy components, showing that this behaviour extends over 3 decades in energy. The GRB peaks are also much broader at soft energies. This is related to the temporal evolution of the spectrum, and can be accounted for by the softening of the electron spectral index with time. The burst energy ( erg at ) and average peak energy ( keV) make GRB 060124 consistent with the Amati relation. The X-ray afterglow is characterized by a decay which presents a break at s.
1 Introduction
GRB 060124 is the first event for which the three Swift instruments have a clear detection of both the prompt and the afterglow emission. Indeed, Swift-BAT triggered on a precursor on 2006-01-24 at 15:54:52 UT, s before the main burst peak. This allowed Swift to immediately repoint the NFIs and acquire a pointing towards the burst s before the burst occurred. The burst, which had a highly structured profile, comprises three major peaks following the precursor and had one of longest total durations (even excluding the precursor) recorded by either BATSE or Swift (see Fig. 1a). GRB 060124 also triggered Konus-Wind 559.4 s after the BAT trigger golenetskii2006:gcn4599 . The Konus light curve confirmed the presence of both the precursor and the three peaks of prompt emission. In this paper we summarize the observed properties of this burst. A fully detailed account of the observations and a more in-depth discussion of this exceptionally bright and long GRB (which is the very first case that the burst proper could be observed with an X-ray CCD with high spatial resolution imaging down to 0.2 keV) can be found in Romano2006:060124 .
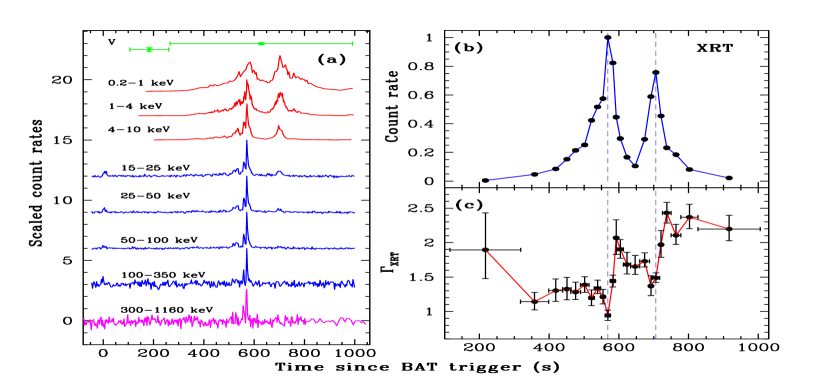
Time-resolved spectroscopy of the prompt emission of GRB 060124 with XRT/WT data. (b): Normalized XRT count rate. (c): Time evolution of the photon index. The vertical dashed lines mark the peak positions.
2 The precursor/prompt phase

-
1.
For GRB 060124, we observed the longest interval ( s) recorded between a precursor and the main GRB event (Lazzati2005:precursors, ). The precursor is spectrally softer (photon index ) than the following peaks ().
-
2.
The XRT, BAT and Konus light curves (0.2–2 000 keV, see Fig. 1a) show the same overall structure consisting of three peaks. No time-resolved information is available from UVOT, but we can state that the optical behaviour during the prompt emission was significantly different from the X-ray one. This may indicate the onset on a (weak) reverse shock.
-
3.
Based on the s, although the individual peak durations are comparable to those of other GRBs, the total duration is among the longest recorded by either BATSE or Swift, which may rule out precursor models in which the fireball erupts from a massive stellar envelope.
-
4.
The peaks of the prompt emission shift with the energy band, with the peaks observed in the harder bands preceding the ones observed in the softer bands. This lag is as much as s (between 15–100 keV and 0.2–1 keV). This has often been observed before (e.g., Ford1995:softhard, ); our data show that that this behaviour extends over 3 decades in energy.
-
5.
Strong spectral evolution takes place during the prompt phase. i) We observe the peak energy moving from higher energies to lower energies (Fig. 2a). ii) The spectral evolution follows a “tracking” behaviour (Fig. 1c), with the spectrum being harder when the flux is higher. Furthermore, the photon index achieves a plateau following each peak in the light curve, with each plateau becoming successively softer. During this time interval, the photon index increases by about 1, reaching a value consistent with the later afterglow spectrum () by the end of the last peak. iii) The relative importance of the three main peaks varies with the energy band (Fig. 1a); the third peak in the 0.1–1 keV light curve is actually stronger than the second one, as opposed to what is observed in all the other energy bands.
-
6.
The peaks are much broader in the softer bands (Fig. 1a). This is related to the temporal evolution of the spectrum, and can be accounted for by assuming that the electron spectral index softened with time.
-
7.
We derive a mean rest frame peak and isotropic energy keV and erg. This burst is consistent with the Amati, the Yonetoku, and the Ghirlanda (Amati2002, ; Yonetoku2004, ; Ghirlanda2004, ) relations.
3 The afterglow phase
-
1.
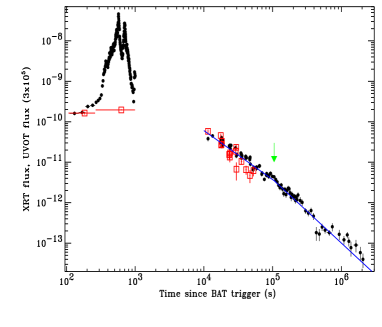
The X-ray afterglow () is modelled with a broken power-law decay with indices , , and a break at s (Fig. 2b).
-
2.
The optical afterglow (data only available for s) is modelled with a power-law decay with index (the optical data are only available for s). An optical break has been reported at a time consistent with the X-ray break Curran2007 , which makes this one of the few well-defined achromatic breaks in the Swift sample (see, Covino2007:swift_breaks, ).
The early part of the afterglow () can be explained well in terms of the standard model. In this case, the optical and X-ray data constrain the cooling frequency between the optical and X-ray bands. In fact, the X-ray and optical spectral indices and differ by , and constrain Hz. The temporal behaviour is fully consistent with this interpretation: both the optical and X-ray decay slopes are consistent with the model prediction: (valid for ) and (valid for ). The latter equation is valid only for a homogeneous external medium (the wind model would require a much steeper ). The electron distribution index is , which is in agreement with the shock theory.
The X-ray decay slope after the break is too shallow for the break being due to a standard, sideways-expanding jet, in which case would be expected (Rhoads1999:beaming, ). The break magnitude may be consistent with a jet which propagates in a wind environment suffering no sideways expansion (for which ). However, the wind model is ruled out by the early-time optical data. A solution which satisfies all the available constraints is a structured jet having a homogeneous core surrounded by power-law wings with energy profile (Panaitescu2005:jets, ). The break magnitude is dependent upon the index (and on the location of ). With the observed values, we infer . The break magnitude below the cooling frequency (i.e. in the optical) is slightly different: . This difference, however, is quite small.
Acknowledgements.
This work was supported at INAF by ASI grant I/R/039/04.References
- (1) \BYGolenetskii S. et al. \INGCN Circ.45992006
- (2) \BYRomano P. et al. \INA&A4562006917
- (3) \BYLazzati D. \INMNRAS3572005722
- (4) \BYFord L. A. et al. \INApJ4391995307
- (5) \BYAmati L. et al. \INA&A390200281
- (6) \BYYonetoku D. et al. \INApJ6092004935
- (7) \BYGhirlanda G., Ghisellini G. \atqueLazzati D. \INApJ6162004331
- (8) \BYCurran P.A. et al. \INThese Proceedings2007
- (9) \BYCovino S. et al. \INThese Proceedings2007
- (10) \BYRhoads J. E. \INApJ5251999737
- (11) \BYPanaitescu A. \INMNRAS3622005921