11email: dporquet@mpe.mpg.de 22institutetext: Laboratory for High Energy Astrophysics, Code 662, NASA Goddard Space Flight Center, Greenbelt, MD 20771, USA 33institutetext: Dept. of Physics and Astronomy, Johns Hopkins University, 3400 N. Charles Street, Baltimore, MD 21218, USA 44institutetext: NASA Postdoc Program Associate 55institutetext: Dept. of Physics, University of Maryland Baltimore County, 1000 Hilltop Circle, Baltimore, MD 21250, USA 66institutetext: Dept. of Physics, University of Oxford, Denys Wilkinson Building, Keble Road, Oxford OX1 3RH, UK 77institutetext: Astrophysics Group, Imperial College London, Blackett Laboratory, Prince Consort Road, London SW7 2AW, UK
An XMM-Newton view of the X-ray flat radio-quiet quasar PG 1416129
Abstract
Aims. The radio-quiet quasar PG 1416129 () exhibits atypical optical and X-ray properties. Between 1990 and 2000, in response to its optical continuum decrease, the “classical” broad component of H almost completely disappeared, with a factor of 10 decrease in the line flux. In addition, the width of the broad component of the H line decreased significantly from 4000 km s-1 to 1450 km s-1. In the X-ray band, this object was observed by Ginga in 1988 to have the hardest quasar photon index, with =1.10.1. We present an XMM-Newton/EPIC observation of PG 1416129 performed in July 2004.
Methods. We analyze the time-averaged pn spectrum of this quasar, as well as perform time-resolved spectroscopy.
Results. We find that during the present XMM-Newton observation, PG 1416129 still has a rather hard photon index, both in the soft (0.2–2 keV) and hard (2–12 keV) energy ranges, compared to radio-quiet quasars (BLS1 and NLS1) but compatible with the photon index value found for radio-loud quasars. This object also shows long-term luminosity variability over 16 years by a factor of three with a variation of photon index from 1.2 to 1.8. In the soft energy band (0.2–2 keV), we found a very weak soft X-ray excess compared to other RQ quasars. The whole time averaged spectrum is fit very well either by X-ray ionized reflection from the accretion disk surface, by a warm absorber-emitter plus power-law, or by a smeared absorption/emission from a relativistic outflow. While no constant narrow Fe K line at 6.4 keV is observed, we find the possible presence of two non-simultaneous transient iron lines: a redshifted narrow iron line at about 5.5 keV (96.4 confidence level according to multi-trial Monte-Carlo simulations) at the beginning of this observation and the appearance of a line at 6.3–6.4 keV (99.1 c.l.) at the end of the observation. These variable lines could be generated by discrete hot-spots on the accretion disk surface.
Key Words.:
galaxies: active – X-rays: galaxies – accretion discs – quasars: individual: PG 14161291 Introduction
PG 1416$-$129 (z ) was one of the three brightest low-redshift
(z0.2) radio-quiet quasars observed during the ASCA mission (Reeves & Turner 2000).
It has a high bolometric luminosity, 1046 erg s-1
(Vestergaard 2002), and a black hole mass of about
3–6 108 (Vestergaard 2002; Hao et al. 2005).
This object has an accretion rate with respect to Eddington of about
0.12 (Hao et al. 2005).
It has been associated with the 2MASS object at
=14h19m0381,
=13∘10′447 (Barkhouse & Hall 2001).
It has strong, broad permitted optical emission lines:
(H)= 6110 km s-1 (Boroson & Green 1992), but
the measurement of this width was contaminated by the presence of
a very broad component, as shown by Sulentic et al. (2000),
who measured FWHM(H)= 4000 km s-1.
This value of the line width led to it being described as
a Broad-Line (BL) AGN (FWHM(H2000 km s-1).
However, observations of this broad-line quasar have
revealed a significant drop-off in its continuum luminosity by
about a factor of four at 4500 Å
between 1990 and 2000 (Sulentic et al. 2000). In response to
this continuum decrease, the “classical” broad component of
H has almost completely disappeared, with a factor of 10
decrease in the line flux (Sulentic et al. 2000).
Additionally, the width of the broad component of the H line
decreased significantly over those 10 years, from 4000 km s-1
to 1450 km s-1.
In the X-ray band, PG 1416129 shows peculiar behavior
compared to other low-redshift quasars. A spectrum obtained
by Ginga in 1988 showed the hardest spectral index (=1.10.1)
of all known quasars in the 2–20 keV energy range (Williams et al. 1992).
The Compton Gamma-ray Observatory/OSSE observations in 1994
showed that PG 1416129 has a very steep
spectrum (=3.20.5) above 50 keV,
and consequently the most dramatic cut-off between 50 keV
and 100 keV (Staubert & Maisack 1996). However, from an ASCA observation in 1994,
Reeves & Turner (2000) found a photon index for this object of =1.780.02,
which is closer to the values found in most radio-quiet low-redshift quasars
(e.g., Porquet et al. 2004a) than the very hard photon index
measured previously with Ginga.
In addition, during this ASCA observation, a possible
Fe K line was detected at =6.54 keV
(=14075 eV) with an F-test probability of 98.3.
This object also shows long-term flux variability as reported in
Table 1. In this paper we report the analysis of the XMM-Newton
observation of PG 1416129 performed in July 2004. In addition to the previous X-ray
observations already published and the present XMM-Newton
observation, we also show the currently unpublished 1998 RXTE data.
Details of the RXTE data analysis are reported in Appendix
A.
| Satellites | Obs date | Lum | Ref | |
|---|---|---|---|---|
| (dd/mm/yyyy) | ||||
| Ginga | 02/02/1988 | 1.180.06 | 1.4 | LT97 |
| Ginga | 21/09/1991 | 1.480.13 | 1.2 | LT97 |
| ASCA | 29/07/1994 | 1.780.02 | 3.0 | RT00 |
| RXTE | 21/08/1998 | 1.170.15 | 1.0 | This work |
| XMM-Newton | 14/07/2004 | 1.560.04 | 0.98 | This work |
2 XMM-Newton observation and data reduction
XMM-Newton observed PG 1416129
on July 14, 2004 (ID 0203770201; orbit 842; exposure time 50 ks).
The EPICMOS cameras (Turner et al. 2001)
operated in the Small Window mode,
while the EPICpn camera (Strüder et al. 2001)
was operated in the standard Full Frame mode.
The data were re-processed and cleaned (net pn time exposure
45ks) using the XMM-Newton SAS version 6.5.0 (Science
Analysis Software) package. Since the effect of pile-up was negligible,
X-ray events corresponding to patterns
0–12 and 0–4 events (single and double pixels)
were selected for the MOS and pn, respectively. Only good X-ray events
(with FLAG=0) were included.
The low-energy cutoff was set to 300 and 200 eV for MOS and pn, respectively.
In this article we present the pn results only,
since the pn-CCD have a better sensitivity over a broader energy range
(0.2–12 keV) compared to the MOS CCDs.
However, we verified that similar results were obtained using the MOS data.
The pn source spectra were extracted
using a circular region of diameter 30′′ centered on
the source position.
PG 1416129 is by far the brightest X-ray source in this
30′ EPIC field-of-view.
Background spectra were taken from a box region
(7.3′ 4′)
on the same CCD as the source (excluding X-ray point sources).
The xspec v11.3 software package (Arnaud 1996) was used for spectral
analysis of the background-subtracted spectrum,
using the response matrices and ancillary files derived from the SAS tasks
rmfgen and arfgen.
The pn spectrum was binned to give a minimum of 50 counts per bin.
The signal to noise ratio was not sufficient
for reliable RGS data analysis, and the OM was blocked during this
observation.
3 XMM-Newton spectral analysis
In all fits, we included both the Galactic column density (=6.80 cm-2, obtained from the coldens program using the compilations of Dickey & Lockman 1990), and a possible additional absorption component located at the quasar redshift (). Note that all fit parameters are given in the quasar’s rest frame, with values of H0=75 km s-1 Mpc-1 and q0=0.5 assumed throughout. The errors quoted correspond to 90 confidence ranges for one interesting parameter (=2.71). Abundances are those of Anders & Grevesse (1989). In the following, we use the updated cross-sections for X-ray absorption by the interstellar medium (tbabs in XSPEC) from Wilms, Allen, & McCray (2000).

3.1 The time averaged spectrum
We found an average pn count rate in the 0.2–12 keV energy range of 1.360.01 cts s-1. First, fitting the overall 0.2–12 keV pn spectrum with a single absorbed power-law model, a moderately acceptable fit was found (= 1.18 for 979 d.o.f.), with =1.750.01. To characterize the hard X-ray continuum, we fit an absorbed power-law model over the 2–5 keV energy range, where the spectrum should be relatively unaffected by the presence of a broad soft excess, a Warm Absorber-Emitter medium, an Fe K emission line, and a contribution above 8 keV from a high energy Compton reflection hump. In this energy range, the data are well fit by a single power-law model with = 1.610.06 (/d.o.f.=346.2/377). This power-law index is similar to values found over the same energy range for radio-loud quasars (=1.74 with a standard deviation of 0.03; Porquet et al. 2004a), but harder than the values commonly seen in radio-quiet quasars: =1.90 (with a standard deviation of 0.27) and =2.37 (with a standard deviation of 0.11) for Broad Line quasars and Narrow Line quasars, respectively (Porquet et al. 2004a). A similar conclusion is found when comparing with the average power law index measured in radio-quiet quasars above 2 keV (= 2 with a dispersion of 0.25, George et al. 2000; =1.890.11, Piconcelli et al. 2005).
Figure 1 displays the spectrum when the power-law model is extrapolated over the 0.2–12 keV broad band energy range. A weak positive residual is seen below 1 keV due to the presence of a soft X-ray excess. In addition, a Fe K complex between about 4.8–5.7 keV (5.4–6.4 keV in the quasar frame) seems to be present.
| Model | Line parameters | /d.o.f. | F-test | |||||
| (keV) | (keV) | (deg) | Flux | (eV) | ||||
| PL | 1.560.04 | – | – | – | – | – | 634.0/621 | – |
| PL + zgauss | 1.570.04 | 6.4 (f) | 0.01 (f) | – | 2.21.2 | 5429 | 624.5/620 | 99.78 |
| PL + zgauss | 1.570.04 | 6.330.05 | 0.10 | – | 2.91.4 | 69 | 619.6/618 | 99.74 |
| PL + diskline(a) | 1.58 | 6.400.05 | – | 22 | 3.91.7 | 10746 | 619.3/618 | 99.77 |
| PL + laor(b) | 1.58 | 6.40 | – | 22 | 4.42.1 | 119 | 621.7/618 | 99.30 |
3.1.1 The soft spectrum: 0.2–2 keV
First we fit the 0.2–2 keV energy range with a single absorbed power-law, and found a good fit with = 2.10.7 1020 cm-2 and a photon index of =1.960.05 (/d.o.f.=364.9/355). This value is compatible within the error bars with =2.20.2 inferred from a ROSAT PSPC observation performed in 1992 (de Kool & Meurs 1994). This value is marginally smaller than the one found in general in radio-quiet quasars (Porquet et al. 2004a; =2.43 with a dispersion of 0.35). The inferred 0.2–2 keV unabsorbed flux is 2.9 10-12 erg cm-2 s-1 (L=1.1 1044 erg s-1). However, adding a narrow (=10 eV) Gaussian line, we found a significant improvement to the fit, with /d.o.f.=339.4/353 (as a comparison, Monte Carlo simulations, as described in 3.2, give 99.9). The energy of the line is 55615 eV and its equivalent width () is 15.9 eV. These parameters are consistent with the position of the He-like O vii triplet between 561–574 eV. We also fit the data assuming two absorption edges, and we again found a significant improvement to the fit, with /d.o.f.=339.9/351 (F-test 99.99). The energies (and optical depths, ) of the two edges are =0.714 keV (=0.160.06) and =0.953 keV (=0.100.05) respectively. The energy of the first edge is consistent with the rest-frame energy of the O vii edge (0.740 keV). The second edge is not compatible with the rest-frame of the O viii edge (0.871 keV) or of Ne ix (1.196 keV), but could be one of these ions with a velocity shift or perhaps a blend of the two edges. It also could be due the presence of absorption lines, for example, the Fe L complex seen in absorption in several AGN (e.g., Sako et al. 2001). Unfortunately the present RGS data do not have good enough S/N to determine the physical nature of this feature. However, as we will discuss below, the whole average spectrum could be equally well explained either by X-ray ionized reflection on the accretion disk surface, by a warm absorber-emitter plus power-law model, or by a smeared absorption/emission from a high velocity outflow.
3.1.2 The Fe K complex
As shown in Fig. 1, there is the presence of a Fe K complex between 5.4 and 6.4 keV in the quasar frame. Therefore, we fit the 2–12 keV energy range with an absorbed power-law continuum and three possible profiles for the iron line; either (i) a simple Gaussian (zgauss in xspec), (ii) a line profile corresponding to emission from a relativistic accretion disk around a non-rotating black hole (diskline; Fabian et al. 1989), or (iii) emission from around a maximally rotating black hole (laor; Laor 1991). The spectral fits were improved by the addition of the iron line, when modeled either by a Gaussian line or by a relativistic accretion disk-line profile, with a significance greater than or equal to 99.3 from an F-test (see Table 2). The line, if modeled by a Gaussian, appears to be more likely narrow (0.11 keV) and produced by neutral to moderately ionized iron, with =6.340.05 keV. If the line is due to a relativistic accretion disk, the inclination of the disk is constrained to be less than about 20∘. The line could be associated with X-ray fluorescence from the molecular torus. However, we will see below with time-resolved spectroscopy that the situation is more complex, with the possible presence of two non-simultaneous transient iron lines at 5.5 ks and 6.3–6.4 keV appearing during the first 5.5 ks and last 16 ks of the observation, respectively.
3.1.3 The broad-band spectrum: 0.2–12 keV
The 0.2–12 keV energy range is well-fit by the combination of a blackbody and a power-law component. We find 2.41020 cm-2, =149 eV and =1.62 (/d.o.f.=1008.7/977). A broken power-law model also gave a good fit, with = 2.91020 cm-2, =2.04, =1.59, and =1.64 keV (/d.o.f.=995.8/977).
In order to obtain a more physical representation of the soft excess, we have also tested multi-temperature disc models, which may be expected if the soft X-ray excess originates via thermal emission from the inner accretion disc in PG 1416129. The diskbb (non-relativistic) and diskpn (relativistic) models were used, together with a power-law to model the hard X-ray emission above 2 keV. Equally good fits are obtained for both models. For the first model, we found =211 eV and =1.600.03 (/d.o.f.=996.0/977), and similar parameters were found for the second model: = 200 eV and =1.600.03 (/d.o.f.=996.3/977). The inner disc temperatures obtained through either of these models are much larger than the temperature at 3 (=2) expected from a standard steady state thin accretion disc, i.e. 8–10 eV, (Shakura & Sunyaev 1973), assuming a black hole mass of about 3–6108 . This result is consistent with the temperature found in other low-redshift AGN, with a 100–200 eV temperature component being too hot to be the direct thermal disk emission as inferred from the soft X-ray spectra (Gierliński & Done 2004; Porquet et al. 2004a; Piconcelli et al. 2005).
The whole spectrum could be explained with a warm absorber/emitter combined with a power law continuum. Therefore, we used a grid of models generated by the xstar (version 21l) photoionization code (Kallman et al. 1996) to fit the EPICpn data. A one zone model was adopted (covering the range of parameters 1log 5 and 21log 24). Solar elemental abundances were assumed. A low turbulence velocity of 200 km s-1 was used, and the covering factor was fixed to unity. The warm absorber column density () was fixed to the lowest value in the xstar grid, 1021 cm-2, while the ionization parameter () was left free. A good fit was obtained (/d.o.f.=1077.6/975) with 1.61019 cm-2, =1.690.02, log =1.90 erg cm s-1. In this model, the photoionized emission from the warm absorber represents about 7 of the total flux in the 0.2–2 keV energy range.

We then tested the possibility that the whole spectrum could be explained by X-ray ionized reflection on the accretion disk surface (reflion model in XSPEC; Ross & Fabian 2005). Ross & Fabian (2005) have shown that this model can explain the overall spectrum from 0.2–12 keV in several AGN, without invoking ad-hoc components such as a blackbody (see also Crummy et al. 2005). One signature of ionized reflection is the soft excess emission which occurs in the 0.2–2 keV band due to lines and bremsstrahlung emission from the hot surface layers. It creates a bump in the relativistically blurred spectrum which, when convolved with the XMM-Newton pn response matrix, is well fit by a blackbody of temperature 150 eV. The iron abundance (AFe) is from Morrison & McCammon (1983) in this model. The reflion model covers a large range of parameters: 30 10000 erg cm s-1 (ionization parameter), 0.1 AFe 10.0 (relative iron abundance), and 1.0 3.0. We also took into account the relativistic effect due to relativistic motion in the inner part of the accretion disc, by blurring the spectrum with a Laor line profile (kdblur; Ross & Fabian 2005; Crummy et al. 2005). In the blurred reflection model, the physical lower limit of the inner radius () was set at 1.235 , i.e. corresponding to the innermost stable orbit around a maximally rotating black hole. We fixed the disc emissivity index to 3. We obtained a very good fit (/d.o.f.=980.9/974) to the data with the following parameters: = cm-2, =3.1 (=), =21.1∘, =0.92, =1.780.04, and =38.0 erg cm-1 s-1 (see Fig. 2). No additional absorption or emission features in the soft band were required. As shown in Fig. 2, the reflection emission is significant in the very soft part of the spectrum, especially near 0.4–0.5 keV (observed frame), where a feature at 556 eV has been detected using a simple power-law plus a narrow Gaussian (see 3.1.1). The fraction of the reflection emission to the total emission is only about 21 in the 0.2–12 keV (similar values are found in the 0.2–2 keV and 2–10 keV energy ranges). The inner radius found here is compatible with a rotating black hole. The fit parameters found here are compatible to those determined in the large sample of type I AGN from Crummy et al. (2005). The power-law index is in the low range value of the sample but not as low than that found for Mrk 359 (=1.490.06), which is an extreme NLS1.
An alternative possibility is that the soft X-ray excess is an
artifact of soft X-ray absorption and emission produced by a high
velocity outflow, as shown by Gierliński & Done (2004) and Schurch & Done (2006),
who model the X-ray spectra of other
PG quasars observed by XMM-Newton.
Therefore we fit the data with smeared ionized absorption and
emission, using the same grid of models generated by the
xstar photoionization code used for the warm
absorber-emitter model used above. We fixed
to 1021 cm-2.
We obtained a very good fit to the data (/d.o.f.=990.8/975),
with a smearing velocity of 0.180.02 c,
=9.01019 cm-2,
log =2.31 erg cm-1 s-1, and
=1.59.
As we will see in the next section, an additional physical
process, such as hot spots due to X-ray flares, is required to
explain the two possible transient Fe K lines observed
(3.2).
| no | Model | (keV) | /d.o.f. | ||
| (eV) | |||||
| 1 | PL | 1.610.11 | 3.20.5 | – | 83.8/97 |
| PL+zgauss | 1.640.11 | – | 5.470.04 | 71.0/95 | |
| 19489 | |||||
| 2 | PL | 1.510.05 | 3.30.2 | – | 98.8/97 |
| 3 | PL | 1.610.06 | 3.10.2 | – | 117.9/97 |
| PL+zgauss | 1.620.06 | – | 6.350.05 | 102.5/95 | |
| 12853 | |||||
| PL+AN | 1.640.06 | – | 6.40 (f) | 95.0/93 | |
| 287100 |
3.2 XMM-Newton time-resolved spectroscopy
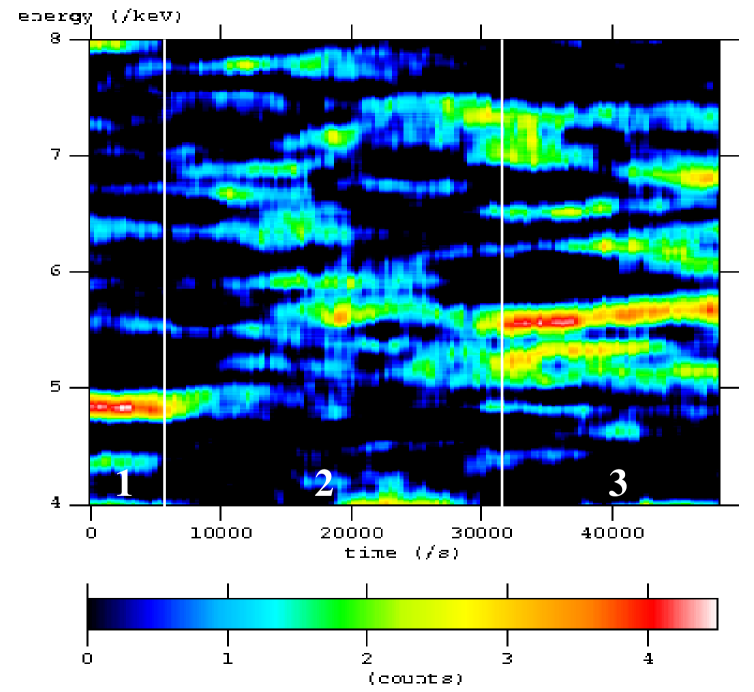
To test possible rapid energy shifts of the iron line, we have created X-ray intensity maps in the energy-time plane using the pn data. Photons from the source cell were accumulated in pixels in the energy-time plane. The pixel distribution was smoothed in energy by the instrumental resolution, using a Gaussian of 140 eV (appropriate for the single plus double events with the latest calibration), and smoothed in time using a top-hat function of width 10 ks. Each time-slice was background-corrected by subtracting a time-dependent background spectrum measured in an off-source region on the same detector chip as the source. The source continuum was modeled as an absorbed power-law, with variable amplitude and slope but time-invariant absorption column density. This continuum was subtracted, leaving positive and negative residuals that comprise noise plus any emission or absorption components on top of the continuum. More information about this method can be found in Turner et al. (2006). The “signal-to-noise” (S/N) map presented in Fig.3 is the ratio of the fluctuation amplitude to the calculated noise.

The highest S/N observed is about 4.5. We observe the presence of an excess
with S/N 3.5 at 5.5 keV in the quasar frame at the
beginning of this observation. Then this feature disappears. At the
end of this observation, there is the presence of an excess near
6.3 keV (in the quasar frame) and then at lower significance
(S/N 3.5)
a hint of a shift to 6.4 keV of the centroid of the line.
In order to characterize these features, which are most probably
associated with Fe K line emission, we have split the observation
into three sub-spectra (the corresponding time ranges are illustrated on
Fig. 3):
- 1. This corresponds to the presence of the 5.5 keV feature with
3.5 (from t=0 ks to t=5.5 ks);
- 2. This corresponds to the absence of any significant long-lived
excess feature (from t=5.5 ks to 32 ks);
- 3. This corresponds to the appearance and presence of the feature
near 6.3–6.4 keV.
First, we rebinned the sub-spectra, grouping every 80 eV (16 channels). This was chosen to sample the resolution of the pn detector (i.e. about 2 spectral bins per resolution element). We then fit them with a power-law continuum over the 2–10 keV energy range. The parameter fits are reported in Table 3 and the spectral fits are displayed in Figure 4. For sub-spectra 1 and 3, an emission feature is observed. For sub-spectrum 1, the addition of a narrow Gaussian line (width fixed to 10 eV) with a centroid energy of 5.5 keV improved the fit. Allowing the line width to vary, we found an upper limit of 94 eV. For sub-spectrum 3, the addition of a narrow Gaussian (width fixed to 10 eV) with a centroid energy of about 6.35 keV also improved the fit. If we allow the line width to be a free parameter, the upper limit is rather large (0.4 keV) due to the presence of the red wing-like feature seen below 6.4 keV (see Fig. 4). A narrow disc annulus at 6.4 keV (=1 , emissivity index fixed to 2) provides a superior fit. The best fit parameters are =1.640.06, =34, =173∘ and =287100 eV (Fig. 5). Letting the value of the accretion disc outer radius free to vary, we find an upper limit of 84 , corresponding to a of the annulus value between 1 and 58 (taking into account the lower limit on ).

As discussed by Protassov et al. (2002) (see also Porquet et al. 2004b), the F-test
can overestimate the true detection significance of a line
if there was no previous expectation of the line.
One must account for the number of resolution elements
over the bandpass of interest. The probability
of detecting a feature at any energy in this range
is obtained using , where is the probability of finding
a feature at an expected line energy (equal to one minus the
null hypothesis probability).
Assuming 21 resolution elements between 4–7 keV,
the significance probabilities for the 5.5 and 6.3 keV lines
become 98.1 and 99.2, respectively.
We also carried out a more rigorous test of the significance
of the lines using Monte Carlo simulations to assess the
likelihood that the lines could be an artefact of photon noise
(e.g., Porquet et al. 2004b). For our null hypothesis, we assumed
that the spectrum is simply an absorbed power-law continuum,
with the same parameters as the absorbed power-law model fit
to the real data. We used the xspec fakeit none command to create
a fake spectrum, and then, to account for the uncertainty in the null
hypothesis model itself, we refit the null hypothesis model and
ran fakeit none a second time on the “re-fit” null hypothesis
model. Both fakeit none commands were run with the photon
statistics appropriate for a 5.5 ksec exposure (segment 1) or
16 ksec exposure (segment 3). We grouped each faked
spectrum, rebinning every 80 eV. We then added a narrow
( = 10 eV) Gaussian to the fit for the 5.5 keV line,
or a diskline annulus, with the values of the inner and outer radii,
emissivity index, and inclination angle fixed to that of the
observed spectrum, for the 6.3 keV line.
We searched over 4.0 to 7.0 keV (observed
frame) in increments of 0.1 keV, fitting separately each time to
ensure that the lowest value of was found. We
compared the minimum value of obtained
with the corresponding of the null hypothesis fit.
This process was repeated 1000 times, yielding
a cumulative frequency distribution of the simulated
expected for a blind line search. The inferred
probabilities to reject the null hypothesis are 98.8 and 99.7
for the 5.5 keV and 6.3 keV lines, respectively.
However, since we have divided the whole observation into three
sub-spectra, the null hypothesis probabilities have to be multiplied
by a factor of three, leading to 96.4 and 99.1 for the
detection confidence level of these transient lines.
While the detection of the 5.4 keV feature is statistically marginal,
it should be noted that the 6.3 keV feature is observed at an energy where a
iron K diskline would be expected a priori.
The three sub-spectra display no significant flux variations:
is consistent with being constant.
As far as the continuum photon index is concerned, sub-spectra 1 and 3
have consistent values, but sub-spectrum 2 is slightly
flatter; the photon index when the diskline annulus model is applied
to sub-spectrum 3 is not consistent at 90 confidence
with that obtained in sub-spectrum 2, where no emission line was found.
However, we can use Monte Carlo simulations to
quantify the expected spread in the measured photon index, given
an assumed intrinsic constant photon index.
Specifically, the null hypothesis model in the
Monte Carlo procedure above assumed a single value
for the intrinsic photon index; using those same simulated
spectra, we find a standard deviation in the
measured photon index of 0.165 (due to the moderate signal/noise).
This is higher than the maximum of 0.13 between the
best-fit photon indices for sub-spectra 3 and 2.
Therefore, there is no evidence
for the appearance of the line (or lack thereof)
to be correlated with values of the photon index.
4 Summary and discussion
In this section, we summarize the main results of our analysis of
the July 2004 XMM-Newton/EPIC observation of PG 1416129.
A X-ray flat RQQ object.
With the present 2004 XMM-Newton observation, we found
that its 2–5 keV power-law index
(1.6) is similar to values found for radio-loud objects
(=1.74 with a standard deviation of 0.03; Porquet et al. 2004a),
but by far much harder than the value commonly seen in radio-quiet quasars:
=1.90 (with a standard deviation of 0.27) and
=2.37 (with a standard deviation of 0.11) for
Broad Line quasars and Narrow Line quasars, respectively (Porquet et al. 2004a).
This result confirms the behavior seen in previous observations,
with the exception of the 1994 ASCA
observation, as
reported in Table 1.
Is PG1416129 a NLS1 ?
PG 1416129 could be associated with the NLS1 class of objects, given the
value of (H) observed in 2000 by
Sulentic et al. (2000).
NLS1s are defined according to the following characteristics:
(H) less than 2000 km s-1; strong optical
Fe ii multiplets;
5007Å/H 3
(Osterbrock & Pogge 1985; Goodrich 1989). The 2000 optical spectrum of PG1416129, however,
showed only a weak Fe ii multiplet, with
5007Å/H13.9
(Sulentic et al. 2000).
steep, soft X-ray excess (Puchnarewicz et al. 1992; Boller et al. 1996);
rapid soft/hard X-ray variability (Leighly 1999).
During the 2004 XMM-Newton
observation, however, neither significant X-ray variability nor a steep soft
excess were observed.
less massive black holes with higher
Eddington ratios, suggesting that they might be in the early stage of
AGN evolution (Grupe 1996; Mathur 2000; Bian & Zhao 2003). As reported in the
introduction, however, this object has a black hole mass of about
36108 , which is higher than the mass found in
typical NLS1s. Furthermore, its accretion rate with respect to
Eddington is only 0.12.
Therefore it appears that PG 1416129 is not a
genuine NLS1 and instead the narrow H width is caused by the
variations in the broad component of this line.
The soft X-ray spectrum.
In addition to its flat 2-10 keV photon index, this object shows
a much weaker soft excess than generally observed for Broad-Line
quasars and Narrow-Line quasars. Some additional features seem to be
present in the 0.2–2 keV energy range. For example, the addition of
a Gaussian emission line at 55615 eV improved the fit very
significantly, with an F-test significance of 99.99. However, we have
obtained a fit with the same statistical quality by adding two absorption
edges. Unfortunately the present RGS data do not have sufficient
signal to noise ratio in order to determine the physical nature of
this feature, if real.
The whole average spectrum is very well fit by a model with
X-ray ionized reflection on the accretion disk surface,
with no additional soft X-ray absorption and/or emission features
required.
However other models, such as absorption
and/or re-emission from a high velocity
outflow (or simple photoionized emission from distant matter)
could also explain the weak soft excess
below 1 keV, as discussed in detail for other PG quasars by Gierliński & Done (2004).
Discovery of two possible transient
Fe K lines
In the time-averaged spectrum, a Fe K complex is seen
between 5.5 and 6.4 keV, with significant residuals at about 6.4 keV.
If the line is due to a relativistic accretion disk, the inclination
of the disk is constrained to be less than about 20∘.
If the line is variable, this would rule out X-ray fluorescence from distant
matter such as the molecular torus.
Indeed, time-resolved spectroscopy has revealed that the emission complex
is more likely due to the presence of two transient
iron lines.
The first iron line has a redshifted energy centered at
5.5 keV and was present during the first 5.5 ks
(167 eV) of this observation with a 96.4
confidence level according to Monte-Carlo simulations (see
3.2); after 5.5 ksec,
it disappears sharply. The second, more significant
transient iron line appears about 32 ks after the beginning of this
observation with a centroid energy at 6.3 keV (250 eV)
and a duration of at least 16 ks with a 99.1 confidence
level according to Monte-Carlo simulations. There is
a hint of a slight shift in its centroid energy
to 6.4 keV during the last 10 ks of the observation.
Other narrow, highly-redshifted iron lines
(4.5–6 keV) in AGN have already been reported: e.g.,
NGC 3516 (Turner et al. 2002),
ESO 113-G010 (Porquet et al. 2004b),
Mrk 766 (Turner et al. 2004),
AX J0447-0627 (Della Ceca et al. 2005),
and PG 1425+267 (Miniutti & Fabian 2006).
Localized spots or narrow annuli which occur on the surface of an
accretion disk following its illumination by flares have been proposed
to explain these features (e.g., Nayakshin 2000; Turner et al. 2002; Dovčiak et al. 2004; Pecháček et al. 2005).
Such lines may arise in the accretion disk,
sporadically illuminated by “hotspots,”
as regions of magnetic reconnection illuminate very
small areas of the accretion flow.
Presumably the hotspot co-rotates with the disk.
While the small line width implies that the emitting region must
be small and
detected only during a fraction of the whole orbit,
large spots, meanwhile, would produce broader features and they would
be prone to
rapid destruction. Here the features appear to be narrow, however
their widths are not strongly constrained.
Indeed, an annulus of up to 58 in size is allowed in
segment 3 of the observation.
If the transient lines are due to hotspots
co-rotating with the disk, a lower limit of 16 ks on the lifetime
of the transient 6.3 keV iron line feature would
correspond to at least 80 and 2 of the whole orbit at
=1.235 and =20 , respectively (assuming a
black hole mass of 3 108 ).
The large of both transient features are consistent with
the X-ray emission being located in a relatively compact region, e.g.,
from X-ray flares.
More complex geometries of the X-ray emitting region can be
considered, e.g., spiral waves propagating across the accretion
disc (e.g., Karas et al. 2001; Fukumura & Tsuruta 2004),
and density inhomogeneities,
which can indicate turbulence driven by magnetorotational instability
(Balbus & Hawley 1991), or photon bubble instabilities (Arons 1992).
As demonstrated by Ballantyne et al. (2004, 2005). Photon bubble
instabilities (which result on time-varying density homogeneities on
scales smaller than the disk thickness) can explain rapid variability
of emission lines, with variations as large as 100 eV that
are independent of the illuminating continuum, as observed
during the present observation.
In addition, scenarios involving non-flat accretion disks, such as
warped/corrugated accretion disks (e.g., Fabian et al. 2002; Miller & Homan 2005),
can be invoked to explain such features. However, as pointed out by
Fabian et al. (2002), even a small corrugation of the accretion disc
may result in 2 and a strong reflection component in the
observed spectrum, as observed in several NLS1 objects (e.g,
1H 0707$-$495). In the case of the present observation of
PG 1416129 such a scenario appears unlikely since neither a steep
spectrum (1.6) nor a strong reflection component
(the fraction of the 0.2–12 keV reflection emission is only about
21 of the total emission, see 3.1.3) are observed.
Acknowledgements.
The XMM-Newton project is an ESA Science Mission with instruments and contributions directly funded by ESA Member States and the USA (NASA). The XMM-Newton project is supported by the Bundesministerium für Wirtschaft und Technologie/Deutsches Zentrum für Luft- und Raumfahrt (BMWI/DLR, FKZ 50 OX 0001), the Max-Planck Society and the Heidenhain-Stiftung. We thank the anonymous referee for fruitful comments and suggestions. D.P. acknowledges grant support from an MPE fellowship.Appendix A RXTE data
PG 1416129 was observed by RXTE on 1998 Aug 21
from 06:25–10:42 UT, 1998 Aug 22 from 06:54–08:06 UT,
and 1998 Aug 23 from 01:37–07:32 UT, for a total of 41.1
ksec. Data were taken using RXTE’s proportional
counter array (PCA; Swank 1998), which consists of five
identical collimated proportional counter units (PCUs).
Data were collected from PCUs 0, 1, and 2, and reduced
using standard extraction methods and FTOOLS v5.3.1
software. Data were rejected if they were gathered less
than 10∘ from the Earth’s limb, if they were obtained
within 30 min after the satellite’s passage through
the South Atlantic Anomaly, if ELECTRON0 0.1,
or if the satellite’s pointing offset was greater
than 002.
As the PCA has no simultaneous background monitoring capability,
background data were estimated by using pcabackest v3.0
to generate model files based on the particle-induced background,
SAA activity, and the diffuse X-ray background. The ’L7-240’
background models appropriate for faint sources were used.
This background subtraction is the dominant source of systematic
error in RXTE AGN monitoring data (e.g., Edelson & Nandra 1999).
Counts were extracted only from the topmost PCU layer to maximize
the signal-to-noise ratio. This reduction yielded
a total of 22.0 ksec of good exposure time.
Response matrices were generated using pcarsp v.8.0.
For the purposes of spectral analysis, data below 3.0 keV were discarded
in order to disregard PCA calibration uncertainties
below this energy. The source was not well detected by the PCA
above 14 keV; photons above this energy were discarded.
Fitting these RXTE data with an absorbed () power-law continuum, we found a good fit with =1.170.15 (/d.o.f.=7.6/25). The inferred 2–10 keV luminosity is 1.0 1044 erg s-1.
References
- Anders & Grevesse (1989) Anders, E. & Grevesse, N. 1989, Geochim. Cosmochim. Acta., 53, 197
- Arnaud (1996) Arnaud, K. A. 1996, in ASP Conf. Ser. 101: Astronomical Data Analysis Software and Systems V, ed. G. H. Jacoby & J. Barnes, 17
- Arons (1992) Arons, J. 1992, ApJ, 388, 561
- Balbus & Hawley (1991) Balbus, S. A. & Hawley, J. F. 1991, ApJ, 376, 214
- Ballantyne et al. (2004) Ballantyne, D. R., Turner, N. J., & Blaes, O. M. 2004, ApJ, 603, 436
- Ballantyne et al. (2005) Ballantyne, D. R., Turner, N. J., & Young, A. J. 2005, ApJ, 619, 1028
- Barkhouse & Hall (2001) Barkhouse, W. A. & Hall, P. B. 2001, AJ, 121, 2843
- Bian & Zhao (2003) Bian, W.-H. & Zhao, Y.-H. 2003, PASJ, 55, 143
- Boller et al. (1996) Boller, T., Brandt, W. N., & Fink, H. 1996, A&A, 305, 53
- Boroson & Green (1992) Boroson, T. A. & Green, R. F. 1992, ApJS, 80, 109
- Crummy et al. (2005) Crummy, J., Fabian, A. C., Brandt, W. N., & Boller, T. 2005, MNRAS, 361, 1197
- de Kool & Meurs (1994) de Kool, M. & Meurs, E. J. A. 1994, A&A, 281, L65
- Della Ceca et al. (2005) Della Ceca, R., Ballo, L., Braito, V., & Maccacaro, T. 2005, ApJ, 627, 706
- Dickey & Lockman (1990) Dickey, J. M. & Lockman, F. J. 1990, ARA&A, 28, 215
- Dovčiak et al. (2004) Dovčiak, M., Bianchi, S., Guainazzi, M., Karas, V., & Matt, G. 2004, MNRAS, 350, 745
- Edelson & Nandra (1999) Edelson, R. & Nandra, K. 1999, ApJ, 514, 682
- Fabian et al. (2002) Fabian, A. C., Ballantyne, D. R., Merloni, A., et al. 2002, MNRAS, 331, L35
- Fabian et al. (1989) Fabian, A. C., Rees, M. J., Stella, L., & White, N. E. 1989, MNRAS, 238, 729
- Fukumura & Tsuruta (2004) Fukumura, K. & Tsuruta, S. 2004, ApJ, 613, 700
- George et al. (2000) George, I. M., Turner, T. J., Yaqoob, T., et al. 2000, ApJ, 531, 52
- Gierliński & Done (2004) Gierliński, M. & Done, C. 2004, MNRAS, 349, L7
- Goodrich (1989) Goodrich, R. W. 1989, ApJ, 342, 224
- Grupe (1996) Grupe, D. 1996, Ph.D. Thesis
- Hao et al. (2005) Hao, C. N., Xia, X. Y., Mao, S., Wu, H., & Deng, Z. G. 2005, ApJ, 625, 78
- Kallman et al. (1996) Kallman, T. R., Liedahl, D., Osterheld, A., Goldstein, W., & Kahn, S. 1996, ApJ, 465, 994
- Karas et al. (2001) Karas, V., Martocchia, A., & Subr, L. 2001, PASJ, 53, 189
- Laor (1991) Laor, A. 1991, ApJ, 376, 90
- Lawson & Turner (1997) Lawson, A. J. & Turner, M. J. L. 1997, MNRAS, 288, 920
- Leighly (1999) Leighly, K. M. 1999, ApJS, 125, 297
- Mathur (2000) Mathur, S. 2000, MNRAS, 314, L17
- Miller & Homan (2005) Miller, J. M. & Homan, J. 2005, ApJ, 618, L107
- Miniutti & Fabian (2006) Miniutti, G. & Fabian, A. C. 2006, MNRAS, 366, 115
- Morrison & McCammon (1983) Morrison, R. & McCammon, D. 1983, ApJ, 270, 119
- Nayakshin (2000) Nayakshin, S. 2000, ApJ, 540, L37
- Osterbrock & Pogge (1985) Osterbrock, D. E. & Pogge, R. W. 1985, ApJ, 297, 166
- Pecháček et al. (2005) Pecháček, T., Dovčiak, M., Karas, V., & Matt, G. 2005, A&A, 441, 855
- Piconcelli et al. (2005) Piconcelli, E., Jimenez-Bailón, E., Guainazzi, M., et al. 2005, A&A, 432, 15
- Porquet et al. (2004a) Porquet, D., Reeves, J. N., O’Brien, P., & Brinkmann, W. 2004a, A&A, 422, 85
- Porquet et al. (2004b) Porquet, D., Reeves, J. N., Uttley, P., & Turner, T. J. 2004b, A&A, 427, 101
- Protassov et al. (2002) Protassov, R., van Dyk, D. A., Connors, A., Kashyap, V. L., & Siemiginowska, A. 2002, ApJ, 571, 545
- Puchnarewicz et al. (1992) Puchnarewicz, E. M., Mason, K. O., Cordova, F. A., et al. 1992, MNRAS, 256, 589
- Reeves & Turner (2000) Reeves, J. N. & Turner, M. J. L. 2000, MNRAS, 316, 234
- Ross & Fabian (2005) Ross, R. R. & Fabian, A. C. 2005, MNRAS, 358, 211
- Sako et al. (2001) Sako, M., Kahn, S. M., Behar, E., et al. 2001, A&A, 365, L168
- Schurch & Done (2006) Schurch, N. J. & Done, C. 2006, ArXiv Astrophysics e-prints
- Shakura & Sunyaev (1973) Shakura, N. I. & Sunyaev, R. A. 1973, A&A, 24, 337
- Staubert & Maisack (1996) Staubert, R. & Maisack, M. 1996, A&A, 305, L41+
- Strüder et al. (2001) Strüder, L., Briel, U., Dennerl, K., et al. 2001, A&A, 365, L18
- Sulentic et al. (2000) Sulentic, J. W., Marziani, P., Zwitter, T., Dultzin-Hacyan, D., & Calvani, M. 2000, ApJ, 545, L15
- Swank (1998) Swank, J. H. 1998, Nuclear Physics B Proceedings Supplements, 69, 12
- Turner et al. (2001) Turner, M. J. L., Abbey, A., Arnaud, M., et al. 2001, A&A, 365, L27
- Turner et al. (2004) Turner, T. J., Kraemer, S. B., & Reeves, J. N. 2004, ApJ, 603, 62
- Turner et al. (2006) Turner, T. J., Miller, L., George, I. M., & Reeves, J. N. 2006, A&A, 445, 59
- Turner et al. (2002) Turner, T. J., Mushotzky, R. F., Yaqoob, T., et al. 2002, ApJ, 574, L123
- Vestergaard (2002) Vestergaard, M. 2002, ApJ, 571, 733
- Williams et al. (1992) Williams, O. R., Turner, M. J. L., Stewart, G. C., et al. 1992, ApJ, 389, 157
- Wilms et al. (2000) Wilms, J., Allen, A., & McCray, R. 2000, ApJ, 542, 914