11email: sp@astro.ox.ac.uk ; silk@astro.ox.ac.uk 22institutetext: Institut d’Astrophysique de Paris, 98 bis Bd Arago, 75014 Paris, France - Unité mixte de recherche 7095 CNRS - Université Pierre et Marie Curie 33institutetext: Jodrell Bank Centre for Astrophysics, Alan Turing Building, School of Physics and Astronomy, The University of Manchester, Manchester M13 9PL, UK
33email: Scott.Kay@manchester.ac.uk
Active galactic nuclei and massive galaxy cores
Abstract
Context. Central active galactic nuclei (AGN) are supposed to play a key role in the evolution of their host galaxies. In particular, the dynamical and physical properties of the gas core must be affected by the injected energy.
Aims. Our aim is to study the effects of an AGN on the dark matter profile and on the central stellar light distribution in massive early type galaxies.
Methods. By performing self-consistent N-body simulations, we assume in our analysis that periodic bipolar outbursts from a central AGN can induce harmonic oscillatory motions on both sides of the gas core.
Results. Using realistic AGN properties, we find that the motions of the gas core, driven by such feedback processes, can flatten the dark matter and/or stellar profiles after 4-5 Gyr. These results are consistent with recent observational studies that suggest that most giant elliptical galaxies have cores or are “missing light” in their inner part. Since stars behave as a “collisionless” fluid similar to dark matter, the density profile both of stars and dark matter should be affected in a similar way, leading to an effective reduction in the central brightness.
Key Words.:
methods: N-body simulations – galaxies: structure – galaxies: active1 Introduction
The cold dark matter (CDM) paradigm (Cole et al. cole (2005) and references therein) has led to a successful explanation of the large-scale structure in the galaxy distribution on scales 0.02 0.15h Mpc-1. The CDM power spectrum on these scales derived from large redshift surveys such as, for instance, the Anglo-Australian 2-degree Field Galaxy Redshift Survey (2dFGRS), is also consistent with the Lyman- forest data in the redshift range 24 (Croft et al. croft (2002)).
In spite of these impressive successes, there are still discrepancies between simulations and observations on scales 1 Mpc. We may mention the large number of sub- subhalos present in simulations but not observed (Kauffmann, White & Guiderdoni kauffmann (1993); Moore et al. 1999a ; Klypin et al. klypin1 (1999); but see Belokurov et al. belokurov (2006) for an observational update), and the excess of massive early-type galaxies undergoing “top-down” assembly with high inferred specific star formation rates relative to predictions of the hierarchical scenario (Glazebrook et al. glazebrook (2004); Cimatti, Daddi & Renzini cimatti (2006)). Here we examine the sharp central density cusp predicted by simulations in dark matter halos and not seen in the rotation curves of low surface brightness galaxies (de Blok et al. blok (2001)) or in bright spiral galaxies (Palunas & Williams palunas (2000); Salucci & Burkert salucci (2000), Gentile gentile (2004)). Little attention has been given to the corresponding situation in massive early-type galaxies, the focus of the present analysis.
Our model is presented as a toy model to justify an in depth study. It is in the same spirit as that developed by Mashchenko, Couchman & Wadsley (mashchenko (2006)) to account for cores in dwarf galaxies. Indeed it has a similar problem: where has the gas gone? But we stress that there are many ways of accounting for this and other objections (we provide more details below). The point we wish to make is that central cores in massive ellipticals are possible tracers of violent AGN activity, and provide an alternative to binary black hole scouring. If AGN are powerful sources of negative feedback that cleans out the gas supply to avoid forming excessively luminous and blue ellipticals, our model is a plausible and even inevitable precursor. These cores are seen in the stellar component, and are likely present in the underlying (although subdominant) dark matter distribution.
Navarro, Frenk & White (nfw1 (1996), nfw2 (1997)) have shown that the spherically-averaged density profiles of simulated halos can be fitted by a simple analytical function, depending on a characteristic density and a characteristic radius :
| (1) |
This profile (dubbed the NFW-profile) is steeper than that of an isothermal sphere at large radii and shallower close to the center. Steeper profiles in the central regions ( -1.5) have been found in high resolution simulations (Moore et al. 1999b ; Ghigna et al. ghigna (2000); Fukushige & Makino fukushige (2001)).
While the “universality” of density profiles of dark halos is still a matter of debate, possibly depending on the merger history (Klypin et al. klypin2 (2001); Ricotti ricotti (2003); Boylan-Kolchin & Ma boylan (2004)) or on the initial conditions (Ascasibar et al. ascasibar (2004)), it could nevertheless be an important key to understanding the mechanism(s) by which these systems relax and attain equilibrium. In a collisionless self-gravitating system, collective mechanisms such as violent relaxation and/or phase mixing certainly play a major role in the relaxation of halos, but density profiles may also be affected by gravitational scattering of dark matter particles in substructures present inside halos (Ma & Bertschinger 2004a ). In fact, recent numerical experiments indicate that this diffusion process may alter significantly the inner density profile of halos, producing a flattening of the original profile within a few dynamical time scales (Ma & Boylan-Kolchin 2004b ). The most detailed study (Ricotti ricotti (2003)) of N-body simulations at different scales concluded that galaxies have shallower density profiles than clusters.
Central cusps seen in simulations could also be understood as a consequence of the inflow of low-entropy material and therefore contain information on the relic entropy of dark matter particles. In fact, high resolution simulations of galaxy-sized CDM halos indicate an increase of the coarse-grained phase-space density Q (defined as the ratio between the density and the cube of 1-D velocity dispersion in a given volume, e.g., ) towards the center (Taylor & Navarro taylor (2001)). Similar results were obtained by Rasia, Tormen & Moscardini (rasia (2003)), who also obtained a power-law variation, e.g., for cluster-size halos, with quite close to the value found by Taylor & Navarro (taylor (2001)), namely, 1.87.
Several solutions have been proposed to explain such discrepancies between observations and numerical simulations. For example, the dark matter (DM) can be “heated” by the baryons by dynamical friction due to self-gravitating gas clouds orbiting near the center of the galaxy (El-Zant, Shlosman & Hoffman el-zant (2001), El-Zant et al. el-zant2 (2004)), by the evolution of a stellar bar (Weinberg & Katz weinberg (2002); Holley-Bockelmann, Weinberg & Katz holley-Bockelmann (2005); Sellwood sellwood (2006)), by the radiation recoil by a black hole (Merritt et al. merrit (2004)) or by random bulk gas motions driven by supernovae feedback, recently suggested by Mashchenko, Couchman & Wadsley (mashchenko (2006)). Other mechanisms have been proposed such as the the transfer of angular momentum from baryonic to dark matter (Tonini, Lapi & Saluccitonini (2006)) or the expulsion of a large fraction of the gas due to feedback activities, causing the dark matter to expand (Gnedin & Zhao gnedin (2002)).
Most of the previous studies consider the scales of dwarf galaxies or those of galaxy clusters in order to interpret the observed DM profiles in these objects which are thought to be dark matter dominated in their inner regions. In the present paper, we focus our attention on the scale of a typical giant elliptical galaxy, and we investigate the effects of a central AGN in its core. Similar but more extreme feedback ideas have been proposed for disk galaxies such as the Milky Way, where massive early outflows were invoked that resulted in homogenizing and heating the inner dark halo (Binney, Gerhard & Silk binney (2001)).
Black holes and associated AGN feedback are generally considered to be active in the centers of giant galaxies. They must represent huge sources of energy and therefore are thought to play a key role in the formation of bright ellipticals (Silk silk (1998)). They can also be responsible for heating the gas core to regulate the cooling flows in both elliptical galaxies (Best et al. 2006a ) and brightest group and cluster galaxies (Dunn & Fabian dunn (2006); Best et al. 2006b ). Although over the past few years, important progress have been done with high spectral resolution using HST, Fuse, Chandra and XMM-Newton, the nature of the interaction between the AGNs and the surrounding intergalactic medium is still poorly understood. However, observations from UV and X-ray absorption lines of bright AGNs seem to suggest their outbursts can induce sonic motions to gas clouds and lead to important biconical mass outflows (see for instance Hutchings et al. hutchings (1998); Bridges & Irwin bridges (1998); Churazov et al. churazov (2004) and references therein). In the present work, we assume that each AGN outburst can induce a bulk motion to the gas core by energy transfer. We then explore the efficiency of this mechanism of gas core bulk motions for flattening the central DM and stellar cusp. This paper is organized as follows: in section 2, we describe our toy model, we present the results in section 3, and in section 4, our main conclusions are summarized.
2 Toy model
We first develop a toy model which consists of building an N-body realization of an isolated, equilibrium model galaxy. A direct method uses the distribution function (DF), which provides the relative probability of a star to have a certain position and velocity, and then use a Monte-Carlo sampling of the DF to generate the N-body realization. Thus, assuming spherical symmetry, we generate a spherical equilibrium DM halo with a Hernquist density profile (Hernquist hernquist (1990)):
| (2) |
where is the total mass of dark matter and the scale radius. In our fiducial model, we use and kpc. For comparison, this profile is identical in the inner parts to an NFW-profile with virial radius kpc ( defines the sphere within which the mean density is equal to 200 times the critical density) and scale radius kpc respectively (see for instance relation 2 between and in Springel, Di Matteo & Hernquist 2005a ). These 2 profiles are compared in figure 1. The choice of using an Hernquist profile is motivated by two main reasons. Firstly, the density declines faster than an NFW-profile in the outer parts of the halo. Thus, for an isolated halo, truncation at the virial radius is not needed. Furthermore, the Hernquist profile has an analytical expression for both the distribution function and the velocity dispersion (Hernquist hernquist (1990)), which is not the case for an NFW-profile. By proceeding in this way, we try to minimize undesirable effects which can lead to unstable equilibrium. Conventionally, the scale radius is given in terms of the concentration parameter . For our fiducial model, we use in good agreement with values found in previous cosmological N-body simulations (Bullock et al. 2001a ; Dolag et al. dolag (2004)).
The gas component follows a Hernquist profile as well with a total gas mass constrained by the baryonic fraction . Its initial temperature profile is chosen so that the gas is initially in hydrostatic equilibrium.
To model the effects of the central AGN on the gas component, we use a simple representation where the outflow takes the form of a collimated jet which causes the gas to expand by compression. Since the resulting detailed shape of the gas is complicated and poorly known, we use the following simplified model of spherical symmetry (spherical symmetry makes the model well-defined with the minimum number of free parameters). We first define a gas core radius which limits the region affected by the AGN activity. We assume its value to be kpc corresponding to less than 10% of the virial radius and includes a few percent of the total mass of the system. Then the gas core is split into 2 parts and due to periodic AGN outbursts, each part has an independent harmonical motion on opposite sides of the AGN. The frequency and the amplitude of the oscillations depend on the frequency of the AGN activity, on the energy transfer between the AGN and the gas, and on the physical properties of the gas (viscosity, temperature, local density, etc…). To simplify matters, we assume that i) the frequency of the AGN emission matches the frequency of the oscillations of the gas and ii) the amplitude of motions of a specific model corresponds to a fractional displacement of the scale radius. Finally, we have also studied, in a second experiment, how our results are affected when a stellar component is included.
3 Results
3.1 Adiabatic gas
We carry out each simulation with the public code GADGET2 (Springel 2005b ) where dark matter particles and gas particles have been used. The value of the softening length is kpc for all experiments and the baryonic fraction is taken to . Although the gas is supposed to have a central core, our representation of a Hernquist profile will not affect our results since the relevant parameter is the total mass of the core gas. In our study, its resulting value is taken to be , i.e. 1% of the total mass of the system.

The strongest effects are expected to occur when the velocities of the gas particles are close to the velocity dispersion of dark matter. Then, in our fiducial model, we consider that each injection of energy by the AGN produces a gas bulk motion with an initial velocity of km/s, corresponding to the velocity dispersion of dark matter at radius kpc. Since the escape velocity at kpc is about 900 km/s, this ensures that the two moving parts of the gas core are always bound to the system. Then, we let the system evolve during Gyr which corresponds to about 20 times the dynamical time of the gas core. Figure 1 shows the DM density profile at Gyr for an unperturbed system (). The whole system seems to be in a very stable equilibrium since the estimated densities at different radii match well those of the initial density profile.
To study the time evolution of the degree of cuspiness of each model, we use a simple estimator defined by
| (3) |
where is the estimated density at the radius kpc compared to the theoretical value . represents the number of measures used for the estimation of . Typically, we took points separated within logarithmic bins of equal width. It is worth mentioning than for each time-step we have estimated the mass center of the DM component by using a friend-of-friends algorithm (Davis et al. davis (1985)). The value of the linking length is 0.05 in units of the mean interparticle separation, corresponding to evaluating the center of mass of the 5000 DM particles. Figure 2 shows the evolution of our estimator for 6 specific amplitudes of the oscillations. First, when the system is at rest, namely and , is constant and close to 0 as expected. This experiment is used to check the stability of the equilibrium of our system and to estimate the maximum numerical error. The positive values are mostly due to the lack of resolution in the very inner parts of the halo () which can lead to underestimates or overestimates of the density. For both and , in spite of erratic fluctuations, on average, a small increase of is observed. On the contrary, for , and , increases faster but no significant differences can been seen between the 3 scenarios.

However, two important remarks can be made. Firstly, the strongest effects occur when where the DM particles seem to enter into resonance. Secondly, the value of oscillates with the same frequency as the gas oscillations. This phenomenon can be clearly seen for where the period of the oscillations is Gyr. This suggests that the shape of the inner profile continuously evolves over time through different phases.
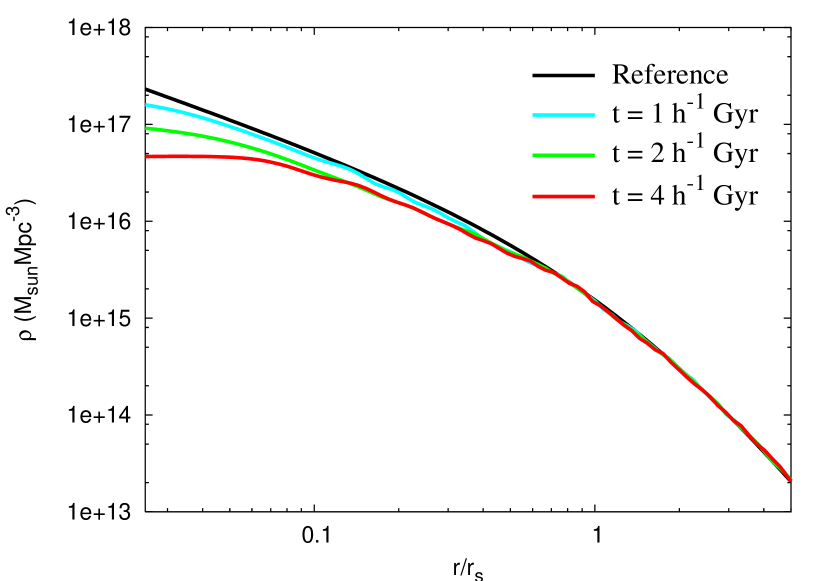
Next, we consider the case . Figure 3 represents the evolution of the DM density profile at and Gyr. We notice that the DM cusp is progressively flatten. At Gyr, the DM profile can be decomposed into a flat central part () and a steeper outer part until it converges to the original slope at . In this case, the derived density profile cannot be well fitted by a Burkert profile (Burkert burkert (1995)).

Figure 4 shows the evolution of the time evolution of when the velocity of the gas is either small ( km/s) or high ( km/s) compared to the velocity dispersion of the dark matter. In both case, an increase of is observed but the effects are quite small, in good agreement with what we expect. It is interesting to notice that for km/s, the three peaks correspond to 1, 2 and 3 oscillation periods respectively (the period of the oscillation is about Gyr). At these specific times, the effects on the DM profile are negligible.
3.2 Including a stellar distribution
One way to improve our model is to include the formation of the elliptical galaxy itself; dissipation of the gas (from radiative cooling processes) and subsequent star formation leads to a steeper initial DM density profile due to adiabatic contraction. We achieve this by building new initial conditions resulting from the merger of 4 sub-haloes; this is done in order to boost the star formation rate (SFR) and form a giant galaxy in a relatively short period.
Each sub-halo has a mass of and the same density profiles as discussed in section 2. Additionally, we give each sub-halo angular momentum by setting the spin parameter, (where is the angular momentum, is the total energy of the halo and is its mass), and the specific angular momentum distribution, , as expected from cosmological -body simulations (Bullock et al. 2001b ). The 4 respective centers of mass are initially placed at rest in a cross configuration, of length kpc. Each opposing pair has oppositely orientated angular momentum vectors in order to avoid an excessive amount of rotation after the merger event.
Before repeating our previous experiment, we first let the above configuration evolve for 6.5 Gyr. During the first 1.5 Gyr (which captures the merger event), we turn on radiative cooling and star formation, then allow the system to relax for the remaining time. Cooling and star formation were introduced in the manner of Katz, Weinberg & Hernquist katz (1996). The cooling prescription allowed each gas particle with K to cool at constant density for the duration of each timestep, assuming a metallicity, . Each gas particle with was then deemed eligible for star formation and we adopted the usual SFR prescription , where and refer to the stellar and gas density respectively, is the dynamical time of the gas and the star formation efficiency (this value is quite high to boost the SFR). Rather than spawning new (lighter) star particles, we implemented the above prescription in a probabilistic fashion. Assuming a constant dynamical time across the timestep, the fractional change in stellar density, . We drew a random number, , from the unit interval and converted a gas particle to a star if .
After 1.5 Gyr, a galaxy with stellar mass, formed with 75 per cent of the stars being born within the first Gyr. During the next 5 Gyr, we let the system relax to make sure that our new initial conditions are stable. It is worth mentioning that our aim here is not to perform a detailed study of the formation of an elliptical galaxy (which is poorly understood), but to construct a sensible starting point in order to assess the gross effect of forming the galaxy (i.e. from dissipation) on our previous results, as well as the effect on the stellar distribution itself, which like the dark matter, is a collisionless fluid.
From our new initial conditions, we perform the same simulation and analysis as described in the previous section. We use here and km/s corresponding to the average of the initial velocity dispersion of dark matter in the inner part. We justify shutting off cooling and star formation by assuming that the AGN activity balances cooling in our relaxed system, as suggested by Best (2006a ). Although a significant fraction of gas has been converted into stars, the mass of the gas at kpc is still substantial () due to the subsequent inflow of hot gas from the outer part of the halo.
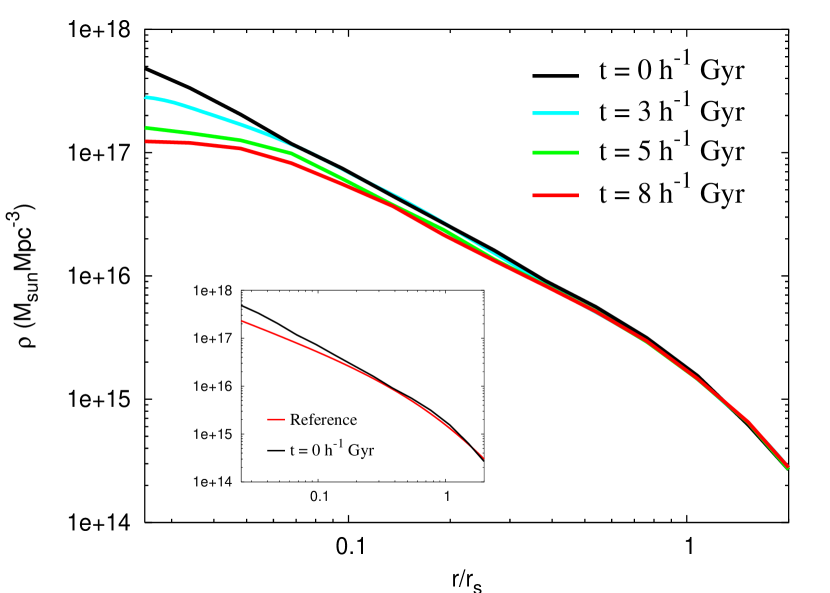
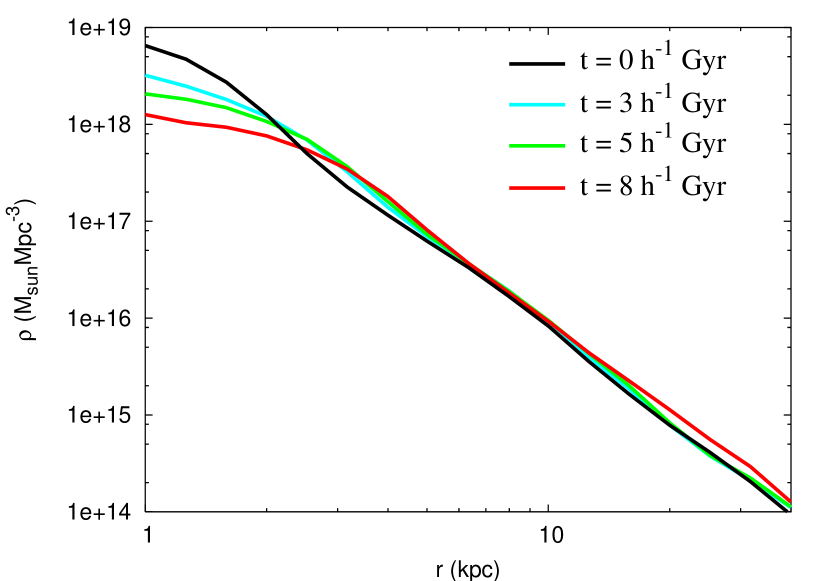
Figure 5 shows the evolution of the DM density profile at , and Gyr. The DM cusp is again progressively flattened but a longer time is needed to obtain an effect of similar magnitude to the model with no stars. However, no significant variation is found between 5 and 8 Gyr suggesting that most of the effect happens during the first 5 Gyr. It is also interesting to note that a similar effect is found with the stellar density profile, as shown in Fig. 6. In particular, we found a significant deficit of stars within kpc. Here again, noticeable effects are found during the first 5 Gyr.
Before drawing any conclusions, we need to check if other physical mechanisms are susceptible to play a role in the flattening of the DM profile. In particular, after the phase of galaxy formation from baryonic collapse and/or sub-haloes merger, residual clumps of gas are expected to exist and move through the virialized regions of the halo. If these structures are much more massive than DM particles and survive long enough from tidal interactions, then their orbital energy can be transfered to DM through dynamical friction. Consequently, the distribution of DM should be affected, especially in the inner part. This effect was clearly identified and characterized by El-Zant, Shlosman & Hoffman (el-zant (2001)) and El-Zant et al. (el-zant2 (2004)) for both galaxy and clusters of galaxies. They found that the dynamical friction induced on clumps of gas with at least a mass of 0.01 percents of the total mass of the system can flatten the DM cusp after a few Gyr.
In order to investigate if the mechanism proposed by El-Zant et al. (2001, 2004) is operating in our model, we have measured the clumpiness of gas present in our initial conditions. To do that, potential sub-structures have been identified by a friend-of-friend algorithm. We used different values of the linking length and, for each of them, we have estimated the number of sub-structures by using the following procedure. First, once a structure is identified, the total energy of each particle is computed, with respect to the centre of mass, and those with positive energy are removed. The procedure is repeated with the new centre of mass, computed according to its usual definition, until no unbound particles are found. Then, only structures with at least particles of gas, corresponding to objects with a mass greater than 10 times the DM particle mass (or 0.002 percents of the total mass of the system), were retained.
We found that whatever the linking length, only one bound structure satisfying the above criteria is found at most (i.e the center of the halo itself). This proves that no bound sub-structures exist and that the gas is distributed in a smooth way (similar result is found for the stellar component). This is not surprising since we used a simplified prescription for the star formation in which the efficiency was quite high and no standard criterion on the overdensity of the gas has been taken into account. Moreover, we let the whole system relax during 5 Gyr after the merger event. Therefore, the lack of clumpiness of gas in our numerical model allows us to ignore the influence of dynamical friction. However, there is no denying that in reality, inhomogeneities and clumpiness of gas are expected to be present and so the dynamical friction acting on them may not be negligible. Assessing which mechanism will dominate is beyond the scope of the present paper as our aim was to provide a plausible alternative mechanism, however we note that the effect found by El-Zant et al. (el-zant2 (2004)) at small fractions of the scale radius and after a period of 4 Gyr, seems to have a similar amplitude to our result. We can therefore reasonably think that some combination of dynamical friction acting on baryonic clumps and the mechanism proposed in this paper would significantly affect the slope of the inner DM profile.
4 Discussion and Conclusions
More and more observations indicate that the DM profiles of dwarf galaxies have a central DM core, in contradiction with results of numerical simulations. On the contrary, clusters tend to have a central cusp suggested by recent studies combining strong and weak lensing (see for instance, Limousin et al. limousin (2006); Leonard et al. leonard (2007); Umetsu, Takada, & Broadhurst umetsu (2007)) even exception can be found (Sand, Treu & Ellis sand (2002)). In this paper, we focus our attention on intermediate scales corresponding in particular to massive early-type galaxies. These are known to contain a central SMBH, whose mass scales with the spheroid velocity dispersion. The growth phase of this SMBH must have been nearly contemporaneous with the epoch of spheroid star formation. Which came first is controversial and not known, but it is eminently plausible that strong AGN activity occurs when the bulk of the spheroid stars have formed. For example, the epoch of activity of AGN as studied via hard x-rays yields a comoving growth rate that peaks at the same epoch as that of the cosmic star formation rate at . The most massive spheroids are most likely already in place. Nevertheless, the presence of SMBHs of mass at high redshift () presents some challenges to this theoretical model since it’s not clear at all how can such massive objects and their host halos (with probably a mass greater than ) can form so early in a CDM cosmology. One possible solution is that intermediate mass black holes form as remnants of Population III stars in the first generation of clouds (Spaans & Silk spaans (2006)). Then, accretion is the preferred mechanism given that the quasar luminosity function matches the local BH mass function for plausible accretion efficiency (Yu & Tremaine yu (2002)). As far as the most massives halos being in place, yes, if they are rare as seems to be the case at high redshift. It’s interesting to note that recent cosmological simulations from Li et al. li (2007) of formation of high redshift quasar from hierarchical galaxy mergers seems to favor this scenario.
Using N-body equilibrium systems, we have used a simple description of the AGN activity in which the energy transfer generates a harmonic bulk motion on both sides of the gas core. We then investigate the impact of this mechanism on the DM core profile. For a typical giant galaxy of total mass , we find that particularly strong effects occur when i) the initial velocity of the gas bulk motion is close to the velocity dispersion of the dark matter and ii) when the amplitude of the oscillations of the bulk motions extends over half the scale radius. In this case, the DM cusp progressively flattens after Gyr (with or without a stellar distribution) but cannot be well fitted by a Burkert profile. However, the effects obtained are not negligible and our model can be easily improved. For example, One could imagine that the direction and the efficiency of the outbursts do not remain constant in time. On the other hand, if we believe that ellipticals form by major mergers, then these merger events may lead to formation of black hole binaries. Binaries provide an alternative DM and stellar core heating mechanism. In this case, the combination of two AGN feedback modes may enhance the observed effects. Finally, the combination with other physical mechanisms may also improve the scenario. In particular, the dynamical friction acting on clumps of gas is expected to have a strong contribution, as shown by El-Zant, Shlosman & Hoffman (el-zant (2001)) and El-Zant et al. (el-zant2 (2004)). Taking into account this process, the effects obtained in the paper should be amplified.
Our fiducial model is not unreasonable. For instance, Voit & Donahue (voit (2005)) claim that AGN outbursts of about erg/s, lasting for at least yr and occurring every yr are required in order to explain the inner entropy profile in cooling-flow clusters. This equates to an energy outburst of erg, comparable to the total kinetic energy periodically injected into the gas core, assuming km/s. The frequency of the AGN emission is also in good agreement with the frequency of the gas motions since yr and yr respectively for km/s and km/s, using . Furthermore, it’s worth mentioning that in the present case, the dynamical time of the core gas is comparable to the time between outbursts, taking a mean density of gas of in the central part. The displaced amount of gas is then expected to relax and sink toward the center between 2 successive outbursts. Or, in a more realistic scenario, as gas is displaced (in a bi-conical nature), fresh gas can fall in perpendicular to the jet axis on the same timescale. This can justify our assumption that the frequency of the AGN outbursts is equal to the frequency of the gas oscillations. Physically, this assumption seems reasonable since the two times are expected to be similar, as it is the accretion of core gas that drives the outbursts. However, we cannot totally exclude the possibility that either the length of an outburst is longer than the gas response time or the frequency of the outbursts is larger than the one used in our fiducial model. In both alternatives, the oscillations would be damped and the mechanism proposed inefficient. To finish, dark matter haloes and galaxies are continuously accreting matter. The corresponding gas merging/infall are responsible to drive the AGN activity which is proved to be sporadic with 10% duty cycle. Each outflow expels important amount of gas which becomes a potential source of material for future BH accretion. According to these physical mechanisms, the periodical quasar activity is expected to be maintained during a long period, probably over several Gyr, timescale required for our mechanism to operate.
Our astrophysical justification for this timescale is the following. Ellipticals most likely form by many minor mergers (Bournaud, Jog & Combes bournaud (2007)). The major merger rate is too low. These are inevitably distributed over a few Gyr. If the gas supply in each merging event feeds the AGN as well as enhances star formation, we inevitably expect the AGN activity and growth to be spread out, e.g. with a duty cycle of 10% over many dynamical times. The downsizing of AGN activity (and associated growth) supports such prolonged activity for typical ellipticals, with only the most massive forming early by major mergers.
Moreover, it has been shown that the brightness profiles of nearly all ellipticals could be well fitted with Sérsic of index (see for instance, Caon, Capaccioli & D’Onofrio caon (1993)). However, some recent studies have suggested that most giant ellipticals exhibit “missing light” at small radii with respect to the inward extrapolation of the Sérsic profile (see Graham graham (2004) or Ferrarese et al. ferrarese (2006)). Such observations are believed to be the consequences of dissipative galaxy formation mechanisms such as those involving AGN energy feedback. In particular, massive SMBH binary tidal scouring to produce the observed mass deficit was advocated by Milosavljević & Merritt (milosavljevic (2003)). We note here that AGN-induced gas bulk motions are equally likely, if not more natural, as a ubiquitous accompaniment to the gas-rich phase of massive spheroid formation. Our model assumes a substantial gas component not only during spheroid formation but also over the next Gyr of AGN activity. This constitutes a serious issue for all CDM models since gas infall is predicted. But as mentioned above, gas is expelled and or/induce to form stars at high efficiency as infrered from ultra-luminous infrared galaxies (ULIRGs) and submillimeter galaxies (SMGs). Wind are observed as well as high-efficiency star formation in these objects and an increasing frequency of AGN beyond z of 1. It is at least 20% locally and given the different duty cycles for star formation and AGN. The feedback is likely to always be important.
Indeed, in order to account for the correlation between SMBH mass and spheroid velocity dispersion, the period of SMBH growth by accretion (the case for accretion growth is powerfully argued by Yu & Tremaine yu (2002)) must be followed by gas expulsion associated with SMBH-driven outflows. It is reasonable to argue that the expulsion phase is preceded by a phase when SMBH are subdominant with respect to the canonical relation but are still capable of driving bulk flows of the gas supply associated with sporadic, fueling-driven outbursts. Quenching of star formation by AGN activity, widely considered to play a role in massive elliptical formation, provides a plausible means of maintaining the gas bulk motions over several dynamical times. Since stars behave as a “collisionless” fluid similar to dark matter, one should expect that AGN activities will affect not only the DM density profile but also the star density profile, confirmed by our results. In this case, the brightness in the inner part should be altered, in good agreement with observational studies such as Graham (graham (2004)) and Ferrarese et al. (ferrarese (2006)).
Finally, we draw a parallel between giant galaxies and galaxy clusters. Indeed, Chandra observations have revealed the presence of cold fronts in many galaxy clusters (see for instance Markevitch et al. 2000, 2002; Vikhlinin, Markevitch & Murray vikhlinin (2001); Mazzotta et al. mazzotta (2001)). These cold fronts are supposed to be due to the presence of a dense, cold gas cloud moving with respect to a hotter one. Some observations suggest that such cold clouds have “sloshing” motions around the center of the cluster, believed to be the consequences of either a recent major merger event or feedback processes from a central AGN. In fact, our model cannot be applied on such scales. Indeed, for a typical galaxy cluster of , the velocity dispersion of DM in the central part is more than 1000 km/s. Then to obtain similar effects to our giant galaxy model, about times more energy is required. It seems unrealistic that one or even a few AGNs located near the center of the cluster can provide such an amount of energy and induce gas bulk motions in a coherent way. However for massive galaxies, the situation is quite different. Not only are the energetics favourable, but the bipolar nature of the AGN outburst must inevitably exert dynamical feedback during the gas-rich phase of spheroid formation.
Acknowledgements.
S. P. acknowledges support from a PPARC rolling grant. It is a pleasure to thank the anonymous referee, as well as L. Ferrarese and A. Graham for their useful comments which have significantly improved this paper. S. P. also wants to thank J. Magorrian, A. Eyre, G. Mamon, J.A. de Freitas Pacheco and T. Sousbie for interesting conversations.References
- (1) Ascasibar Y., Yepes G., Gottlober S. & Muller V., 2004, MNRAS 352, 1109
- (2) Belokurov, V. et al. 2006, ApJ submitted, astro-ph/0608448
- (3) Best, P. N., Kaiser, C. R., Heckman, T. M., & Kauffmann, G. 2006a, MNRAS, 368, L67
- (4) Best, P. N. et al., 2006b, astro-ph/0611197
- (5) Binney, J., Gerhard, O., & Silk, J. 2001, MNRAS, 321, 471
- (6) Bournaud, F., Jog, C. J., & Combes, F. 2007, ArXiv e-prints, 709, arXiv:0709.3439
- (7) Boylan-Kolchin M. & Ma C.-P., 2004, MNRAS 349, 1117
- (8) Bridges, T. J., & Irwin, J. A. 1998, MNRAS, 300, 967
- (9) Bullock, J. S., Kolatt, T. S., Sigad et al., 2001a, MNRAS, 321, 559
- (10) Bullock, J. S., Dekel, A., Kolatt, T. S. et al., 2001b, ApJ, 555, 240
- (11) Burkert, A. 1995, ApJl, 447, L25
- (12) Caon, N., Capaccioli, M., & D’Onofrio, M. 1993, MNRAS, 265, 1013
- (13) Churazov, E., Forman, W., Jones, C., Sunyaev, R., Bohringer, H. 2004, MNRAS, 347, 29
- (14) Cimatti, A., Daddi, E., & Renzini, A. 2006, A&A, 453, L29
- (15) Cole, S., et al. 2005, MNRAS, 362, 505
- (16) Croft R. A. C. et al., 2002, ApJ 581, 20
- (17) Davis, M., Efstathiou, G., Frenk, C. S., & White, S. D. M. 1985, ApJ, 292, 371
- (18) de Blok W. J. G., McGaugh S. S., Bosma A. & Rubin V. C., 2001, ApJ 552, L23
- (19) Dolag, K., Bartelmann, M., Perrotta et al., 2004, A&A, 416, 853
- (20) Dunn, R. J. H., & Fabian, A. C. 2006, MNRAS, 1294
- (21) El-Zant, A., Shlosman, I., & Hoffman, Y. 2001, ApJ, 560, 636
- (22) El-Zant, A. A., Hoffman, Y., Primack, J., Combes, F., & Shlosman, I. 2004, ApJ, 607, L75
- (23) Ferrarese, L., et al. 2006, ApJS, 164, 334
- (24) Fukushige T. & Makino J., 2001, ApJ 557, 533
- (25) Gentile, G. et al., 2004, MNRAS, 351, 903
- (26) Ghigna S., Moore B., Governato F., Lake G., Quinn T. & Stadel J., 2000, ApJ 544, 616
- (27) Glazebrook K. et al, 2004, Nat 430, 181, astro-ph/0401037
- (28) Gnedin, O. Y., & Zhao, H. 2002, MNRAS, 333, 299
- (29) Graham, A. W. 2004, ApJL, 613, L33
- (30) Hernquist, L. 1990, ApJ, 356, 359
- (31) Holley-Bockelmann, K., Weinberg, M., & Katz, N. 2005, MNRAS, 363, 991
- (32) Hutchings, J. B., et al. 1998, ApJl, 492, L115
- (33) Katz, N., Weinberg, D. H., & Hernquist, L. 1996, ApJS, 105, 19
- (34) Kauffmann G., White S. D. M. & Guiderdoni B., 1993, MNRAS 264, 201
- (35) Klypin A., Kravtsov A. V., Valenzuela O. & Prada F., 1999, ApJ 522, 82
- (36) Klypin A., Kravtsov A. V., Bullock J. S. & Primack J. R., 2001, ApJ 554, 903
- (37) Leonard, A., Goldberg, D. M., Haaga, J. L., & Massey, R. 2007, astro-ph/0702242
- (38) Limousin, M., et al. 2006, astro-ph/0612165
- (39) Li, Y., et al. 2007, ApJ, 665, 187
- (40) Ma C.-P. & Bertschinger E., 2004a, ApJ 612, 28
- (41) Ma C.-P. & Boylan-Kolchin M., 2004b, PRL 93, 021301
- (42) Markevitch, M., et al. 2000, ApJ, 541, 542
- (43) Markevitch, M., Gonzalez, A. H., David et al, 2002, ApJl, 567, L27
- (44) Mashchenko, S., Couchman, H. M. P., & Wadsley, J. 2006, Nature, 442, 539
- (45) Mazzotta, P. et al., 2001, ApJ, 555, 205
- (46) Merritt, D. et al., 2004, ApJl, 607, L9
- (47) Milosavljević, M., & Merritt, D. 2003, ApJ, 596, 860
- (48) Moore B., Ghigna S., Governato F., Lake G., Quinn T., Stadel J. & Tozzi P., 1999a, ApJ 524, L19
- (49) Moore B., Quinn T., Governato F., Stadel J. & Lake G., 1999b, MNRAS 310, 1147
- (50) Navarro J. F., Frenk C. S. & White S. D. M., 1996, ApJ 462, 563
- (51) Navarro J. F., Frenk C. S. & White S. D. M., 1997, ApJ 490, 493
- (52) Palunas P. & Williams T.B., 2000, AJ 120, 2884
- (53) Rasia E., Tormen G. & Moscardini L., 2003, ApJ 351, 237
- (54) Ricotti M., 2003, MNRAS 344, 1237
- (55) Salucci, P., & Burkert, A. 2000, ApJl, 537, L9
- (56) Sand, D. J., Treu, T., & Ellis, R. S. 2002, ApJ, 574, L129
- (57) Sellwood, J. A. 2006, ApJ submitted, astro-ph/0610468
- (58) Silk, J., & Rees, M. J. 1998, A&A, 331, L1
- (59) Spaans, M., & Silk, J. 2006, ApJ, 652, 902
- (60) Springel, V., Di Matteo, T., & Hernquist, L. 2005a, MNRAS, 361, 776
- (61) Springel, V. 2005b, MNRAS, 364, 1105
- (62) Taylor J. E. & Navarro J. F., 2001, ApJ 563, 483
- (63) Tonini, C., Lapi, A., & Salucci, P. 2006, ApJ, 649, 591
- (64) Umetsu, K., Takada, M., & Broadhurst, T. 2007, astro-ph/0702096
- (65) Vikhlinin, A., Markevitch, M., & Murray, S. S. 2001, ApJ, 551, 160
- (66) Voit, G. M., & Donahue, M. 2005, ApJ, 634, 955
- (67) Weinberg, M. D., & Katz, N. 2002, ApJ, 580, 627
- (68) Yu, Q., & Tremaine, S. 2002, MNRAS, 335, 965