A detection of the donor star of Aquila X-1 during its 2004 outburst?
Abstract
Phase-resolved high resolution optical spectroscopy has revealed narrow N III and He II emission lines from the soft X-ray transient Aquila X-1 during its 2004 outburst that move as a function of the orbit consistent with the phasing of the donor star. Under the assumption that these lines come from the irradiated side of the donor star, we can constrain its velocity to 2478 km s-1, and derive a mass function of 1.230.12 . Estimates for the rotational broadening based on the emission components suggest a possible massive neutron star of 1.6 (at 95% confidence). However, an updated ephemeris and additional high resolution spectroscopy of Aql X-1 during a future outburst are warranted in order to confirm that the narrow lines indeed originate on the donor star surface, and reliably characterise the system parameters of this important X-ray binary. Spectra taken during the end of the outburst show that the morphology of the emission lines changed dramatically. No donor star signature was present anymore, while the presence of narrow low-velocity emission lines became clear, making Aql X-1 a member of the slowly growing class of low-velocity emission line sources.
keywords:
accretion, accretion disks – stars:individual (Aquila X-1) – X-rays:binaries.1 Introduction
Low mass X-ray binaries (LMXBs) are systems where a compact object, either a neutron star or black hole, accretes material via Roche-lobe overflow from a low mass (1) companion. Soft X-ray transients (SXTs) are an important sub-class of the LMXBs. Contrary to the persistent LMXBs, that always accrete material at high rates, they occasionally have short outbursts (weeks up to months) before returning back to quiescence. These systems are especially interesting for the prospect of quiescent studies of the mass donor, since they provide the only direct method to obtain orbital solutions and system masses for LMXBs (e.g. Charles & Coe 2005). Such system parameter studies are usually not possible during an outburst because the photospheric emission from the companion star is swamped by the emission from the X-ray irradiated disk. Unfortunately, in quiescence many SXT companion stars are too faint (22-23) to allow kinematic studies. This has substantially hampered detailed interpretation of their evolution, and our ability to construct compact object mass distributions.
Aql X-1 is a SXT that shows one of the shortest recurrence times, making it one of the most intensively studied systems. Aql X-1 shows quasi-periodic outbursts, with approximately one year intervals (Priedhorsky & Terrell 1984). During such an outburst it shows Type I X-ray bursts, indicating that the compact object is a neutron star (Koyama et al. 1981; Czerny et al. 1987). Its optical counterpart was detected by Thorstensen et al. (1978) during an outburst at a magnitude of 17. An 18.97 hr periodic modulation in the optical was observed during an outburst, which was interpreted as the orbital period (Chevalier & Ilovaisky 1991). In quiescence the counterpart fades to 21.6, but is only 0.46′′ away from a =19.26 star (Chevalier et al. 1999), severely hampering kinematic studies of Aql X-1. Despite intense studies there are currently no strong constraints on the system parameters.
Photometric observations show that the light curve is double humped during quiescence, changing to single humped in outburst (e.g. Welsh et al. 2000; Chevalier & Ilovaisky 1991,1998; Shahbaz et al. 1998). This is interpreted as ellipsoidal variations from the Roche-lobe filling donor star in quiescence, changing in outburst to reflection due to heating of the side of the secondary facing the neutron star. This suggests that during an outburst the optical light is dominated by the irradiated side of the secondary (Welsh et al. 2000). The spectrum of Aql X-1 in quiescence, after careful deconvolution of the spectrum of the contamination star, shows absorption features that can be associated with a K6-M0 V star, as well as emission lines typical for LMXBs (Chevalier et al. 1999).
In this paper we will explore the possibility to determine the system parameters of Aql X-1 during an outburst using narrow Bowen fluorescence lines. This technique was first applied to Sco X-1 (Steeghs & Casares 2002). Narrow emission line components coming from the irradiated companion star, especially in the Bowen blend (a blend of N III 4634/4640 Å and C III 4647/4650 Å lines), were used to trace its orbital motion and determine the mass function. Since then, this technique has led to the discovery of donor star signatures in other persistent LMXBs such as X 1822371, 4U 163653 and 4U 173544 (Casares et al. 2003, Casares et al. 2006), or transient sources where the optical counterpart is too faint in quiescence, such as GX 3394 (Hynes et al. 2003a).

2 observations and data reduction
From May until June 2004 Aql X-1 was in outburst (see Fig. 1), and we were able to obtain a total of 28 spectra using the FORS-2 spectrograph attached to the VLT/UT4 (Yepun Telescope) at Paranal Observatory (ESO). In Table 1 we give an overview of all the observations. The spectra were taken with the 1400V volume-phased holographic grism, and a slit width of 0.7′′, giving a wavelength coverage of 4514-5815 Åwith a resolution of 70 km s-1 (FWHM). The seeing during these observations varied between 0.5 and 2.1 arcsec. During daytime He, Ne, Hg and Cd arc lamp exposures were taken for the wavelength calibration scale.
| Date | No. | Exp. | Orb. phases | |
|---|---|---|---|---|
| (dd-mm-yy) | (mag) | (s) | ||
| 26-05-04 | 16.3 | 1 | 900 | 0.91 |
| 27-05-04 | 16.3 | 8 | 600 | 0.88-0.90,0.14-0.17 |
| 28-05-04 | 16.3 | 11 | 900 | 0.17, 0.30-0.43 |
| 18-06-04 | 17.5 | 8 | 674 | 0.76-0.84 |
We de-biased and flat-fielded all the images and used optimal extraction techniques to maximise the signal-to-noise ratio of the extracted spectra (Horne 1986). The pixel-to-wavelength scale was determined using a 4th-order polynomial fit to 20 reference lines resulting in a dispersion of 0.64 Åpix-1 and rms scatter 0.05 Å. We also corrected for velocity drifts due to instrumental flexure (always 5 km s-1) by cross-correlating the sky spectra using a small region around the [O I] sky line at 5577.4. We thus realigned all spectra using this single skyline as the zero point.
3 Data analysis

Fig. 2 shows the average spectrum of both the 26-28 May 2004 run (bottom) and the 18 June 2004 observations (top). We note that the spectra are dominated by high excitation emission lines, notably from He II 4686, He II 5411, H and the Bowen region 4630-4650, as expected from an X-ray binary during outburst. Comparing the two spectra in Fig. 2, and especially the close-ups of the most important emission lines in Figs. 3&4, the first thing we notice is that the morphology of the emission lines has changed significantly. During the 26-28 May 2004 run the emission lines consist of a broad component (most likely coming from the accretion disk), and a narrow component that shows a significant velocity shift between the individual spectra (these components are clearest in Fig. 3). On the other hand, during the 18 June 2004 observations the lines are exceptionally narrow (see Table 2), and both the broad base and the moving component have disappeared. In order to quantify the change in emission lines, we have listed the equivalent widths, ratio of peak flux over continuum flux and FWHM of the main lines derived from average spectra of the May and June 2004 observations in Table 2. Furthermore, we have also indicated the magnitude, as determined by Maitra & Bailyn (2005), in Table 1. The only line that has broadened a little compared to previous observations is H. However, we do note that the He II 4859 emission line from the Pickering series is also present (see Fig. 4), and could contribute to this broadening, as was also the case in the LMXB XTE J2123058 (Hynes et al. 2001). Most importantly, the narrow lines in the June data do not show any orbital motion, despite phase coverage of 0.1 near the orbital conjunction. A close inspection of the individual May 2004 spectra shows that these weak and narrow stationary lines are also present but swamped by the much stronger disk and moving components. Although these narrow lines are obscured most of the time by the moving lines, the data is consistent with them being present in all spectra. Unfortunately, since we do not have an absolute flux calibration for the spectra, it is not clear if the line flux from these stationary components has evolved between May and June 2004.
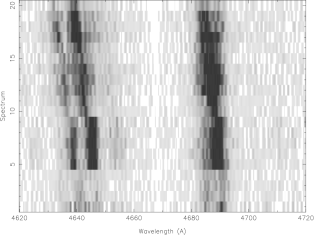
Taking a closer look at the region around the Bowen 4630-4650 emission in the individual spectra (see Fig. 3), we notice that it is dominated by narrow emission lines from N III 4640/4634. Curiously, there is no indication of the presence of narrow C III lines , as was the case in e.g. Sco X-1 (Steeghs & Casares 2002), but we do note that also in other LMXBs the N III Bowen lines are stronger than the C III lines (e.g. Casares et al. 2006). Fig. 5 shows that these N III lines are moving, and we interpret this as orbital motion of a confined region in the system. Furthermore, a close inspection of He II 4686 shows that there is a strong narrow component (making up 30% of the total line flux) that appears to be moving in phase with the narrow Bowen lines (see Fig. 5). Given that the off-set between the narrow He II and Bowen lines does not change between the spectra strengthens our identification of the narrow Bowen lines as N III.
In order to estimate the orbital phases of our spectra we started with the orbital period derived by Chevalier et al. (1998) and phase zero by Welsh et al. (2000). Phase zero is defined as the minimum in the photometric lightcurve, which is expected to correspond to inferior conjunction of the secondary if the photometric lightcurve is indeed dominated by its emission. Unfortunately, this phasing does not match up with the published phase zero by Chevalier et al. (1991). The differences between these zero points is 0.1 orbital phase, while the error suggests only a difference of 0.04 orbital phase. Since we cannot be certain what causes this discrepancy, we used a weighted average of both ephemerides (assuming all quoted errors are correct) to derive the orbital phase for our spectra. We show the results in Table 1. In order to estimate the phase uncertainty, we use a combination of the weighted formal error of two ephemerides (0.05 orbital phase) plus a systematic error of 0.09 orbital phase derived from the difference between the formal and observed error between the 2 ephemerides. This gives a total minimum phase uncertainty on our spectra of 0.1 orbital phase.
| Line | May 2004 | June 2004 | |
|---|---|---|---|
| H | |||
| EW (Å) | 0.520.01 | 1.470.04 | |
| / | 1.20.1 | 1.40.1 | |
| FWHM (km s-1) | 4476 | 56113 | |
| He II | |||
| EW (Å) | 3.490.02 | 2.260.06 | |
| / | 1.30.1 | 1.60.1 | |
| FWHM (km s-1) | 5395 | 1536 | |
| Bowen | |||
| EW (Å) | 6.260.03 | 4.060.07 | |
| / | 1.30.1 | 1.30.1 | |
| FWHM (km s-1) | 91911 | 9961 | |
| 1 For a single narrow Bowen line only. | |||
In order to determine the radial velocity for each spectrum we fitted Gaussians to the two narrow N III lines plus narrow component of He II 4686 simultaneously, where the rest-wavelength of each Gaussian and their separation were fixed. We then determined the off-set from their rest-wavelength using a minimum technique. We also determined the off-set using each line individually, but the differences are negligible. However, the presence of the narrow stationary lines could have an influence on our estimated off-sets, especially close to orbital phases 0.5 and 1.0 where they blend with the moving lines.

Fig. 6 shows our radial velocity measurements as a function of orbital phase. Note that due to observing conditions we have averaged the 4 spectra around orbital phase 0.9 into two bins to increase the signal to noise. For illustration purposes we also included the 18 June spectra (indicated with filled circles and labeled as ’18 Jun’), where we used the narrow, stationary, lines to determine the off-set. Fitting a sine curve to the measurements, with the orbital period taken as fixed, it is clear that the 18 June lines do not originate from the same source in the binary frame, and we therefore do not include them in our radial velocity fits. From a fit through the resulting points we derived a velocity semi-amplitude of =2478 km s-1, a mean velocity of =3010 km s-1 and phase zero of =0.880.05. We determined the errors on the fit by scaling the errors on the individual radial velocities by a factor of 4 such that a =1 is achieved. Note that phase zero was a free parameter, and does not include any systematic uncertainty in the ephemeris used which is expected to be of order 0.1. We do notice a small jump in the radial velocities around orbital phase 0.33, due to the narrow stationary lines that are starting to blend with the wing of the moving components, but excluding these points did not change the results of our fit.

A close inspection of the broad component of He II 4686 shows that it moves in anti-phase with the narrow component. However, depending on the orbital phase either the wings or the core is dominated by the narrow component. We have tried to subtract this narrow component, but were not able to do this reliably and could therefore not measure the radial velocities for the broad component from this line. Instead, we investigated the other prominent emission lines and noted that the only line where a narrow component is not the dominating feature was H. However, also for this line we have to be cautious since there is some contamination from He II as shown in Fig. 8. We applied the double Gaussian technique to the wings of this line (Schneider & Young 1980). As we moved away from the line core, we noted that the velocity semi-amplitude was stable at =685 km s-1, the zero-phase was at =0.350.05 and the mean velocity around =13020 km s-1 (while keeping the orbital period fixed again). These values appear to be consistent with those from the broad component in He II 4686, and indeed show a 0.5 phase difference between the broad and narrow components. However, we do note that the difference in mean velocity between the narrow and broad lines is consistent with the difference between H and He II 4859, suggesting that the latter is contributing significantly to the blend. Furthermore, we also note that formally the fit is not acceptable (=458 for 36 d.o.f.), showing that we must treat this result with caution.
4 Donor Star Detection
We have detected narrow N III fluorescence lines in the optical spectrum of Aql X-1 during outburst that are very similar to the donor star fluorescence features observed in other systems. Having derived the radial velocity curve for these features, we will now discuss the likelihood of these tracing the irradiated donor in Aql X-1. These lines are a dominant feature of the Bowen blend, as was also the case in GX 3394, Sco X-1, X 1822371, V801 Ara and V926 Sco (Hynes et al. 2003a, Steeghs & Casares 2002, Casares et al. 2003+2006). In these X-ray binaries the narrow lines are thought to originate on the surface of the companion star. This is nicely illustrated in the eclipsing LMXB X 1822-371. Here, the origin of the narrow Bowen lines can unambiguously be claimed due to the excellent agreement between the photometric and spectroscopic ephemerides (Casares et al. 2003). For the non-eclipsing LMXBs one has to rely on ephemerides based on determining the minima from lightcurves that are quite variable and far from sinusoidal. Again, when the number of cycles is large enough one also finds an excellent agreement with the spectroscopic ephemerides, as was the case for V801 Ara, and also explained the apparent difference between the photometric and spectroscopic phasing in V926 Sco (Casares et al. 2006). We therefore think that the most likely place of origin of the narrow lines observed in Aql X-1 is also on the surface of the companion star.
Unfortunately, due to the rather large uncertainty in the phasing (0.1 orbital phase), we cannot rule out the possibility that the narrow lines in Aql X-1 do not originate on the companion star. However, for the other two potential regions where these lines could originate, the accretion stream or impact point, it is not clear if it could produce such narrow emission lines as observed in Aql X-1. Comparing the Doppler maps of several LMXBs for which a signature of these regions is observed, namely EXO 0748678, X 1822371 and XTE J1118480, shows that the stream is observed either in absorption or the region is too extended to produce such narrow lines (Pearson et al. 2006, Casares et al. 2003, Torres et al. 2002). Furthermore, also in cataclysmic variables the accretion stream or impact point are commonly observed, but again they are very broad and do not tend to have sinusoidal radial velocity curves. We therefore think that the surface of the companion star is the most likely place of origin for these N III narrow lines, although an up-dated ephemeris and a Doppler map of the Bowen region are needed to confirm this.
4.1 Curious Features
Narrow Bowen components have now been observed in growing list of X-ray binaries (e.g. Steeghs & Casares 2002, Casares et al. 2003, Casares et al. 2006), and we can now also add Aql X-1 to that list. Interestingly, the narrow lines in Aql X-1 show a strong similarity with those observed in GX 3394, also an X-ray transient but with a black hole primary that was confirmed by the observation of the narrow Bowen components (Hynes et al. 2003a). In GX 3394 the narrow components were of a comparable strength to those in Aql X-1 and also dominate the Bowen region, while there was also an indication that a narrow component was contaminating the He II emission (Hynes et al. 2003a).
From the Bowen/He II radial velocity curve we have estimated a systemic velocity of 3010 km s-1, while H gives a value of 13020 km s-1. This is most likely due to the presence of He II 4859, and would suggest that it is dominating the blend. Such contamination has been observed in other X-ray binaries such as XTE J2123058 (Hynes et al. 2001). However, this does mean that we will have to be very careful with associating this semi-amplitude with the orbital motion of the neutron star, since this could also be distorted due to the blending of different components. Such caution is further enhanced by the fact that observations of, for example, X 1822371 by Cowley et al. (2003) have shown that measuring the semi-amplitude of the compact object from emission lines can only give a first order approximation. A full orbital phase coverage of a non-blended line that will not have a strong narrow component during a future outburst of Aql X-1 will be needed to estimate the -velocity of the neutron star.
The most curious feature of Aql X-1 is the change of the emission lines during the June 2004 observations. Such a dramatic change in the morphology of the emission lines has been observed before in the X-ray nova GRO J042232 (Shrader et al. 1996). When the source hardened in X-rays the He II 4686 and the Bowen lines were suddenly greatly reduced in intensity while H and H became much stronger. This change was interpreted as the “turning on” of the hard X-ray component. Although, no hard X-ray/soft gamma ray observations were performed for Aql X-1 around the time of our observations in order to test this (Bird, private comm.), the soft X-ray lightcurve (Fig. 1) does indicate a large change in the accretion activity between the May and June observations.
Even if such “turning on” of the hard X-ray component occurred in Aql X-1 it is still strange that we do not observe the donor star anymore in the June 2004 observations. Since these observations were performed during the final stages of the outburst, i.e. a few days before it went back into quiescence (Maitra & Bailyn 2005), a large fraction of the inner accretion disk might already have disappeared. This could have stopped the production of UV photons that are needed in the Bowen fluorescence process (McClintock et al. 1975), and thereby terminating the narrow lines coming from the companion. Unfortunately, this scenario cannot be verified with the limited spectral information that is contained in the ASM data. Another suggestion could be that the opening angle of the accretion disk has increased between the different observations, and is screening the donor star at the end of the outburst (see also Sect. 4.2).


The other curious feature of Aql X-1 is the narrow, stationary lines that are present in both the May and June observations. These narrow lines do not show any change in radial velocity between the observed spectra, and have a mean velocity of more or less 30 km s-1, which is interestingly comparable to the systemic velocity derived from the lines that arise on the donor star. Aql X-1 is not the first source where such low velocity emission lines are observed. For example, in the dwarf novae IP Peg, SS Cyg and U Gem among others (see Unda-Sanzana et al. 2006 for an overview) also show such low velocity emission lines (Steeghs et al. 1996, Unda-Sunzana et al. 2006). Also in the LMXB Ser X-1 such unusually narrow and stationary lines were present (Hynes et al. 2003b). This makes Aql X-1 another LMXB to become a member of the group that shows these low velocity emission lines, and clearly indicates that these lines are a long-lived and common feature that are independent of the spectral state of the source. Currently there is no satisfactory explanation for these low velocity emission lines, but it is becoming apparent that these lines are present in many compact binaries. Therefore, a convincing explanation should be sought. However, it is clear from Aql X-1 that they are not connected to the companion, contrary to the narrow and moving lines observed in the May 2004 spectra.
4.2 System parameters
If we assume that we have detected a signature of the companion star, what can we say, in combination with previous observations, about the components of Aql X-1? We know that the compact object is a neutron star due to the presence of type I X-ray bursts (Koyama et al. 1981), leading to a mass of the compact object 3.1. Based on photometry and spectroscopy of the optical counterpart of Aql X-1 (correcting for the interloper star at a distance of 0.46 arcsec) Chevalier et al. (1999) determined the spectral type of the secondary as K6-M0. Although several constraints on the inclination exist, and even contradict each other (Shahbaz et al. 1997, 1998, Garcia et al. 1999, Welsh et al. 2000), most were determined before it was known that the optical counterpart consisted of a blend of two stars (Chevalier et al. 1999). Shahbaz et al. (1997) determined an inclination of 50∘ using the width of the H line, while Garcia et al. (1999) argued that the inclination must be 70∘ based on the amplitude of the variations in the outburst lightcurve. Finally, Welsh et al. (2000) used the de-blended optical data to determine that the inclination is 36∘, while the absence of dips or eclipses gives an upper-limit on the inclination of 70-80∘ (Paczynski 1971).


From Fig. 6 we have determined a velocity of 2478 km s-1. However, since the narrow lines are expected to arise on the surface of the donor star, this value will be a lower-limit on the centre of mass velocity of the secondary. Without using any other constraint on Aql X-1 we can determine that the mass function =1.230.12, only slightly smaller than the canonical value of a neutron star (1.4). We note that an inclination 73∘, which would be consistent with all other observations, pushes the mass of the neutron star in Aql X-1 above this canonical value.
Following Casares et al. (2006) we decided to use the width of the emission lines to estimate a lower limit to the rotational broadening, , of the donor star. If we assume a synchronously rotating companion, this gives an estimate of and via =0.462 (Wade & Horne 1988). In order to estimate we created an average spectrum in the rest frame of the narrow components, and the He II 4686 and H regions are shown in Fig. 8. From this spectrum we estimated the FWHM of the N III 4634.12 line at 147.836.7 km s-1 (we did not use N III 4640.64 since it is blended with N III 4641.85). We also estimated the FWHM of N III 4634.12 in all individual spectra and find an average of 135.714.8 km s-1. We do note that there was no detectable systematic change in FWHM as a function of orbital phase. However, these values do include the effect of the intrinsic broadening due to the instrumental resolution of 70 km s-1. To take this into account we broadened a strong line in our arc spectrum using a Gray rotational spectrum (Gray 1992) until we reached the observed FWHM. We assumed no limb-darking since the fluorescence lines occur in optically thin conditions. We found that a rotational broadening of 9615 km s-1 is required.
We have to be very careful with our estimate for the rotational broadening. First of all, we assumed that all the emission of the narrow component is coming from the companion. However, we do note a variation in line strength (see Fig. 5) and there might also be other broadening mechanisms, as was most likely the case in GX 3394 (Hynes et al. 2003a). In this source the widths of emission lines were too high (270-350 km s-1) to be due to rotational broadening only, and we cannot exclude that some other broadening mechanisms are also present in Aql X-1. Furthermore, we also should take into account the effect of smearing due to the orbital motion on the emission lines. We estimated that it should be at maximum 20 km s-1 for Aql X-1, and therefore smeared our arc-line by this amount. We noticed that this changed our estimates on the rotational broadening by 0.6 km s-1, small enough to be discarded. Finally, since the rotational broadening is close to the spectral resolution (70 km s-1), the optimal found could be very sensitive to the assumed template. We therefore also used the [O I] 557.4 sky-line of all the individual spectra to determine the rotational broadening in this way. We notice that the variation in seeing has a small effect on the estimate for the broadening, but it was always 2 km s-1. Although the difference between the sky-line and arc-line is negligible, high resolution spectra of a full orbit will be needed to unambiguously determine the rotational broadening. Bearing in mind these caveats, let us investigate the implications of our estimates on the neutron star mass.
Combining of 9615 km s-1 with the so-called -correction (that allows us to estimate the centre of mass velocity of the secondary using ) we can determine both and (Muñoz-Darias et al. 2005). However, we do note that this -correction is (weakly) dependent on the inclination of the system, but strongly dependent on the opening angle of the accretion disk, both of which are unknown. We used the fourth order polynomial fits given by Muñoz-Darias (2005) to determine the -correction (and also the corrected mass ratio ) that gives the lowest estimate for the neutron star mass. We did notice that this is a monotonically decreasing function with opening angle, i.e. the largest opening angle gives the smallest -correction and therefore the smallest neutron star mass. On the other hand, the largest disk opening angle does give the largest mass ratio . Assuming that =2478 km s-1, we estimate that 0.58 at 95% confidence (a disk opening angle of 18∘) corresponding to 2.20.3, larger than the canonical neutron star mass. However, we do stress again that high-resolution spectra are needed to verify this result, but also note that thus far we have assumed no -correction (and thus underestimated ) or taken into account the inclination, both of which will only increase the mass of the neutron star.
Let us in addition speculate that the velocity derived from Fig. 7 (685 km s-1) gives a first order estimate for the orbital motion of the neutron star. In this case (=0.28) is close to that determined above (if is close to the centre of mass velocity ), and leads to a (maximum) disk opening angle of 16∘. Since Aql X-1 does not show eclipses, we can follow Paczynski (1974, 1983) to estimate an upper-limit on the inclination using =0.46(1+)-1/3. This leads to 65∘ and together with =0.28 gives an estimate on the neutron star mass of 2.7M⊙, suggesting a rather massive neutron star. Unfortunately, since we cannot trust the derived radial velocity of the primary we cannot unambiguously conclude this, but if the velocity could be confirmed and the inclination of the system constrained, it would then place strong limits on the equation of state of neutron star material (e.g. Lattimer & Prakash 2001).
While estimating the -correction for the different disk opening angles, we did notice that an angle of 14-15∘ gives a minimum mass for the neutron star 3.1. This suggests that already for opening angles slightly smaller than the maximum opening angle derived above, the compact object in Aql X-1 will exceed the maximum mass for a neutron star. Since we know that the compact object is a neutron star, this could mean that the opening angle during the May observations is close to the allowed maximum. If the opening angle of the accretion disk was slightly larger during the time of our June observations (either due to an asymmetry in the accretion disk or a real increase), this would completely screen the donor star and no narrow components would be observed anymore, explaining their absence during the observations at the end of the outburst.
5 Conclusion
We conclude that we have detected narrow emission lines in the Bowen region and He II 4686 during an outburst of Aql X-1, that we interpret as coming from irradiated side of the donor star. If correct, this allows us to constrain its orbital velocity for the first time. This leads to a hard mass function for the neutron star of =1.230.12, and for an inclination 73∘ exceeds the mass of a canonical 1.4 neutron star. If we can trust the rotational broadening that we determined, the width of the emission lines places a lower limit on the mass of the primary of 1.6 (at 95% confidence). This suggests that Aql X-1 harbours a more massive neutron star, warranting future observations exploiting the Bowen fluorescence lines in order to improve the constraints on its binary parameters.
Better phase-coverage of the entire outburst with high-resolution spectra together with an updated ephemeris would not only constrain the orbital velocity of the compact object, but also help in understanding how the structure of the accretion disk evolves, and further our understanding of the nature of the low-velocity lines. Given the difficulty of observing Aql X-1 in quiescence, this paper shows that high resolution optical spectroscopy could be a promising way forward.
Acknowledgements
We cordially thank the director of the European Southern Observatory for granting Director’s Discretionary Time (Obs Id 273.D-5026). Based on data collected at the European Southern Observatory Paranal, Chile (Obs Id 073.D-0819). We thank the anonymous referee for helpful comments to this manuscript. RC thanks Sergio Ilovaisky for useful discussions, and Tony Bird for creating an INTEGRAL lightcurve of Aql X-1. We would like to thank the ASM/RXTE teams at MIT and GSFC for provision of the on-line ASM data. We acknowledge the use of MOLLY and DOPPLER developed by T.R. Marsh. RC acknowledges a Marie Curie Intra-European fellowship (MEIF-CT.2005-024685). JC acknowledges support from the Spanish Ministry of Science and Technology through the project AYA2002-03570. DS acknowledges a Smithsonian Astrophysical Observatory Clay Fellowship as well as support through NASA GO grant NNG06GC05G.
References
- Casares (2003) Casares J., Steeghs D., Hynes R.I, Charles P.A., O’Brien K., 2003, ApJ, 590, 1041
- Casares (2006) Casares, J., Cornelisse, R., Steeghs, D., Charles, P.A., Hynes, R.I., O’Brien, K.O., Strohmayer, T., 2006, MNRAS, in press, [astro-ph/0610086]
- Charles (2003) Charles P.A., & Coe M.J. 2005, in “Compact Stellar X-ray Sources”, eds. W.H.G. Lewin and M. van der Klis, in press, [astro-ph/0308020]
- Chevalier (1991) Chevalier, C., & Ilovaisky, S.A. 1991, A&A, 251, L11
- Chevalier (1998) Chevalier, C., & Ilovaisky, S.A. 1998, IAUC, 6806
- Chevalier (1999) Chevalier, C., Ilovaisky, S.A., Leisy, P., & Patat, F. 1999, A&A, 347, L51
- Chevalier (1999) Cowley, A.P., Schmidtke, P.C., Hutchings, J.B., Crampton, D. 2003, AJ, 125, 2163
- Czerny (1987) Czerny, M.,Czerny, B., & Grindlay, J.E. 1987, ApJ, 312, 47
- Garcia (1999) Garcia, M.R., Callanan, P.J., McCarthy, J., Eriksen, K., & Hjellming, R.M. 1999, ApJ, 518, 422
- Gray (1992) Gray, D.F., 1992, “The Observation and Analysis of Stellar Photospheres”, CUP 20
- Horne (1986) Horne K. 1986, PASP, 98, 609
- Hynes (2001) Hynes, R.I., Charles, P.A., Haswell, C.A., Casares, J., Zurita, C., & Serra-Ricart, M. 2001, MNRAS 324, 180
- Hynes (2003) Hynes R.I., Steeghs D., Casares J., Charles P.A., O’Brien K. 2003a, ApJ, 583, L95
- Hynes (2003) Hynes, R.I., Charles, P.A., van Zyl, L., Barnes, A., Steeghs, D., O’Brien, K. & Casares, J. 2003b, MNRAS, 348, 100
- Koyama (1981) Koyama, K., Inoue, H., Makishima, K., Matsuoka, M., Murakami, T., Oda, M., Osgawara, Y., et al. 1981, ApJ, 247, L27
- Lattimer & Prakash (2001) Lattimer, J.M., & Prakash, M. 2001, ApJ 550, 426
- Maitra & Bailyn (2005) Maitra, D., Bailyn, C. 2005, ATel, 450
- MarshHorne (1988) Marsh T.R., Horne K., 1988, MNRAS 235, 269
- McClintock (1975) McClintock, J.E., Canizares, C.R., Tarter, C.B. 1975, ApJ, 198, 641
- Munoz (1988) Muñoz-Darias, T., Casares, J., & Martines-Pais, G. 2005, ApJ, 635, 502
- Paczynski (1971) Paczynski B., 1971, Ann. Rev. A&A, 9, 183
- Paczynski (1974) Paczynski, B., 1974, A&A, 34, 161
- Paczynski (1983) Paczynski, B., 1983, ApJ, 273, L81
- Pearson (2006) Pearson, K.J., Hynes, R.I., Steeghs, D., Jonker, P.G., Haswell, C.A., King, A.R., O’Brien, K., Nelemans, G, Mendez, M. 2006, ApJ, 648, 1169
- Priedhorsky & Terell (1984) Priedhorsky, W.C., Terell, J. 1984, ApJ 280, 661
- Schneider (1980) Schneider D.P., Young P., 1980, ApJ, 238, 946
- Steeghs (1996) Steeghs, D., Horne, K., Marsh, T.R., & Donati, J.F., 1996, MNRAS, 281, 626
- Steeghs (2002) Steeghs D., Casares J., 2002, ApJ, 568, 273
- Shahbaz (1997) Shahbaz, T., Casares, J., & Charles, P.A. 1997, A&A 326, L5
- Shahbaz (1998) Shahbaz, T., Thostensen, J.R., Charles, P.A., & Sherman, N.D. 1998, MNRAS, 296, 1004
- Shrader (1996) Shrader, C.R., Wagner, R.M., Hjellming, R.M., & Starrfield, S.G. 1996, A&AS, 120, 261
- Thorstensen (1978) Thorstensen, J., Charles, P.A., & Bowyer, S. 1978, ApJ, 220, L131
- Torres (2002) Torres, M.A.P., Callanan, P.J., Garcia, M.R., McClintock, J.E., Garnavich, P., Balog, Z., Berlind, P., Brown, W.R., Calkins, M., Mahdavi, A. 2002, ApJ, 569, 423
- Undo-Sanzana (2006) Undo-Sanzana, E., Marsh, T.R., & Morales-Rueda, L., 2006, MNRAS, in press
- Wade (2003) Wade R.A., Horne K., 1988, ApJ, 324, 411
- Welsh (2000) Welsh, W.F., Robinson, E.L., & Young, P. 2000, AJ, 120, 943