Effects of the turbulent ISM on radio observations of quasars
Abstract:
In radio bands, the study of compact radio sources can be affected by propagation effects through the Interstellar Medium. These are usually attributed to the presence of turbulent intervening plasma along the line of sight. In this talk, two of such effects are presented. The line of sight of B 2005+403 passes through the heavily scattered region of Cygnus, which causes substantial angular broadening of the source images obtained at frequencies between 0.6 GHz and 8 GHz. At higher frequencies, however the intrinsic source structure shines through. Therefore, multi-frequency VLBI observations allow to study the characteristics of the intervening material, the source morphology and the ”coupling” of them in forming the observed image.
This article is based upon the published paper of Gabányi et al. For more details see [6].
1 Introduction
The propagation of radio waves through the ionized interstellar medium causes several effects, such as Faraday rotation and depolarization of polarized emission, dispersion of pulsar signals, scatter broadening of compact radio sources and intensity fluctuations caused by diffractive (DISS) and refractive (RISS) interstellar scintillation (ISS). The detailed study of scatter broadening in compact radio sources can lead to a better understanding of the interstellar medium.
The other prominent propagation effect addressed here is the so-called Intraday Variability (IDV, [8]), and the question of how it is related to the interstellar scintillation. IDV surveys show that a large fraction (up to 30 %) of all compact flat spectrum radio sources show this effect, which is characterized by variability amplitudes of up to % and variability timescales ranging from less than one hour to several days (e.g. [10], [12] and references therein). If interpreted via source intrinsic incoherent emission processes, such short variability timescales imply – via the light travel time argument – apparent brightness temperatures of K, far in excess of the inverse-Compton limit ([9]). With the assumption of relativistic Doppler-boosting the brightness temperatures can be reduced, which however would imply uncomfortably large Doppler boosting factors of .
Alternatively, IDV in the radio-bands is also explained extrinsically via scintillation of radio waves in the turbulent interstellar medium (ISM) of our Galaxy (e.g. [15]). The main problem in this interpretation is that it cannot explain the observed radio-optical broad-band correlations seen in at least some sources ([14]). The recent detection of diffractive ISS in the source J 1819+3845 leads to micro-arcsecond source sizes and brightness temperatures of K, which again require Doppler boosting factors of ([13]). It is therefore likely that the IDV phenomenon involves both, a combination of source intrinsic and extrinsic effects (e.g. [11]).
We present measurements for the scatter broadened quasar B 2005+403, combining Very Long Baseline Interferometry (VLBI) and flux density variability measurements obtained at various frequencies. The scatter broadening observed in the VLBI images at the lower frequencies is measured and yields further constraints to the properties of the intervening ISM. Additional parameters for the ISM are obtained from the IDV monitoring of the source, performed with the Effelsberg 100 m telescope.
B 2005+403 is a flat spectrum quasar (, with ; [1]) at a redshift of ([2]). It is located close to the Galactic plane at = , = behind the Cygnus super-bubble region. Earlier studies showed that interstellar scattering affects the VLBI image of the source, causing angular broadening at frequencies below 5 GHz (see [4] and references therein). The high value of the scattering measure (SM = 111The Scattering Measure is the path integral over the coefficient of the electron density fluctuation wavenumber spectrum.), derived for the line of sight of B 2005+403 by [5], reflects the strong influence of the interstellar medium.
2 VLBI data and data reduction
The VLBI observations of B 2005+403 were performed at frequencies between GHz and GHz.
After correlation at the VLBI correlators in Socorro (NRAO) or Bonn (MPIfR), a priori amplitude calibration using system temperature measurement and fringe-fitting were performed using the standard AIPS analysis tasks. Editing, phase and amplitude self-calibration and imaging were performed using AIPS and the Caltech DIFMAP packages.
To study the scattering effects following [5], we measured the total angular source size as a function of observing frequency by fitting the visibility data of B 2005+403 at all frequencies with one Gaussian component within DIFMAP.
3 Propagation effect I: Scatter broadening of B 2005+403
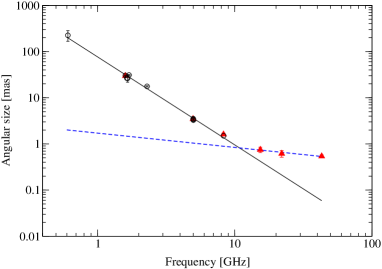
The angular source size of B 2005+403 versus frequency is plotted in Fig. 1, using our data and including the previous measurements from the literature. The corresponding values are given in Table 1. To quantify the scatter broadening, which dominates at lower frequencies, a power law was fitted to the size-frequency relation in the frequency range from GHz to GHz, yielding . This fit is shown as the black line in Figure 1. (Excluding the data point at 8 GHz does not change the slope significantly, yielding: .) Above 8 GHz, the extrapolated scattering size becomes smaller than the measured source size. This indicates that towards higher frequencies scattering effects are less dominant and that the intrinsic structure of the sources shines through. The differences between the extrapolated scattering size and the measured source size at all three frequencies (15 GHz, 22 GHz, and 43 GHz) are of the order of 0.4 mas.
To characterize the frequency dependence of the intrinsic source size, a power law was fitted to the size-frequency relation above 8 GHz, yielding: . The dashed blue line in Fig. 1 shows this fit. With this line, it was possible to obtain an upper limit on the intrinsic source size at lower frequencies where direct size measurements with VLBI are not possible. Hence a lower limit on the brightness temperature could also be calculated. Below 8 GHz, the intrinsic source sizes are in the range of mas. The corresponding lower limits to the brightness temperatures at 1.6 GHz, 5 GHz and 8 GHz are K, K, and K, respectively. These numbers are in accordance with typical brightness temperatures measured with VLBI and neither strongly violate the inverse-Compton limit nor do they indicate excessive Doppler-boosting.
The size of the scattering disk at a given frequency can be estimated via the deconvolution formula: . From the power law fit, the scattering size at 1 GHz is mas. Following [16] and assuming a Kolmogorov turbulence, the scattering measure can be calculated. The derived SM of is in good agreement and consistent with the previous measurement of [5], though with much improved accuracy.
3.1 Propagation effect II: IDV behaviour of B 2005+403
| Source name | |||||
|---|---|---|---|---|---|
| GHz, % | |||||
| B 2005+403 | |||||
| NGC 7027 | |||||
| B 2021+614 | |||||
| GHz, % | |||||
| B 2005+403 | |||||
| NGC 7027 | |||||
In November and December 2003 the flux-density variability of B 2005+403 was monitored with the Effelsberg 100 meter radio telescope with high time resolution. In Table 2, the results from these measurements are summarized: To characterize the variability amplitudes and their significance, we follow the methods described in [10]. Column 2 of the table gives the average flux density, col. 3 the rms standard deviation, col. 4 the modulation index (), col. 5 the variability amplitude (defined as , where is the modulation index of a source regarded to be stationary during the observation) and col. 6 the reduced . A value of is only given, if the test gives a higher than 99.9 probability for significant variations.
The variability amplitude of B 2005+403 decreases with frequency. Formally we measure a modulation index of % at 1.67 GHz and of % at 5 GHz. At this frequency the detection of IDV is marginal. We note that the model of refractive interstellar scintillation in the weak regime predicts a decrease of the modulation index with increasing frequency ([15]). This is consistent with our observations.
The source size and the apparent brightness temperature can be determined from the interstellar scintillation model, assuming that the main reason for the observed variability is the motion of the Earth through the scintillation pattern. In this scenario the variability time-scale in days is ([15]): .
Cordes and Lazio modeled the electron density turbulences of the Milky Way (NE2001, [3]). They assumed a distance of 2.35 kpc to the scattering “clump” responsible for the angular broadening of B 2005+403. The characteristic variability time-scales derived from the light curves is less than a day in B 2005+403. A screen located at kpc distance cannot explain the observed short variability time-scale. With a scattering size of mas at 1.6 GHz, a screen distance of 2.35 kpc and typical Galactic velocities of km/s, one would expect to see variations on time-scales days.
To reproduce a variability time-scale of day at 1.6 GHz within the aforementioned model, the following constraints for the scattering size and the screen distance are obtained: mas kpc. For the measured scattering size of mas, this leads to an unreasonably nearby screen of pc. The only way out of this dilemma is a smaller scattering size. Adopting a minimum screen distance of at least 10 pc as required for the interpretation of the ultra fast scintillators ([13] and references therein), one obtains mas.
An upper limit on the distance of the screen is obtained from the restriction of the source size via the inverse-Compton limit of K. The requirement that the brightness temperature be lower than this leads to a source size of , where Jy is adopted from Table 2 and for the Doppler factor and is in the units of GHz. Approximating with this size and a relative screen velocity in the range km/s, leads to an upper limit of the screen distance in the range pc.
4 Conclusion
The observed IDV in B 2005+403 can be explained with a screen located at a distance less than or equal to pc that can be characterized by a scattering size of mas. The corresponding scattering measure at 1.6 GHz then is in the order of . These values are considerably lower than the scattering measure of the more distant screen, which is thought to be responsible for the scatter broadening in B 2005+403. Therefore the observed IDV is not caused by this distant screen. Most likely, one has to assume multiple scattering by at least two spatially and physically very different plasma screens. In this scenario, the first screen leads to a significant scatter broadening of the source image, which then by the second screen leads to only very weak scattering due to large quenching effects (). This quenched scattering ([15]) by the second screen can explain the relatively low variability amplitudes of %, observed in the IDV experiments at 5 GHz and 1.6 GHz. Quantitatively, this can be verified using equation (20) of [7], which relates the variability index, the scattering measure, the effective source size and the screen distance. With the parameters from above, a modulation index of % is obtained, in good agreement with the observations.
References
- [1] R. H. Becker, R. L. White, A. L. Edwards, A new catalog of 53,522 4.85 GHz sources ApJS 75 (1991).
- [2] A. Boksenberg, S. A. Briggs, R. F. Carswell, 2005+403 - A QSO near the galactic plane, MNRAS 177 (1976).
- [3] J. M. Cordes, T. J. W. Lazio, NE2001. I. A New Model for the Galactic Distribution of Free Electrons and its Fluctuations preprint, astro-ph/0207156 (2002).
- [4] K. M. Desai, A. L. Fey, Anisotropic Interstellar Scattering toward the Cygnus Region, ApJS 133 (2001).
- [5] A. L. Fey, S. R. Spangler, R. L. Mutel, VLBI angular broadening measurements in the Cygnus region ApJ 337 (1989).
- [6] K. É. Gabányi, T. P. Krichbaum, S. Britzen, et al., High frequency VLBI observations of the scatter-broadened quasar B2005+403 A&A 451 (2006)
- [7] J. Goodman, Radio scintillation of gamma-ray-burst afterglows, New Astronomy 2 (1997).
- [8] D. S. Heeschen, T. P. Krichbaum, C. J. Schalinski, et al., Rapid variability of extragalactic radio sources AJ 94 (1987).
- [9] K. I. Kellermann, I. I. K. Pauliny-Toth, The Spectra of Opaque Radio Sources ApJ 155 (1969).
- [10] A. Kraus, T. P. Krichbaum, R. Wegner, Intraday variability in compact extragalactic radio sources., A&A 401 (2003).
- [11] T. P. Krichbaum, A. Kraus, L. Fuhrmann, et al., Intraday Variability in Northern Hemisphere Radio Sources PASA 19 (2002).
- [12] J. E. J. Lovell, D. L. Jauncey, H. E. Bignall, First Results from MASIV: The Microarcsecond Scintillation-induced Variability Survey, AJ 126 (2003).
- [13] J.-P. Macquart, A. G. de Bruyn, Diffractive Interstellar Scintillation of the Quasar J1819+3845 at 21cm, A&A 446 (2006).
- [14] A. Quirrenbach, A. Witzel, S. Wagner, et al., Correlated radio and optical variability in the BL Lacertae object 0716+714, ApJ 372 (1991).
- [15] B. J. Rickett, T. J. W. Lazio, F. D. Ghigo, Interstellar Scintillation Observations of 146 Extragalactic Radio Sources, ApJS 165 (2005).
- [16] J. H. Taylor, J. M. Cordes, Pulsar distances and the galactic distribution of free electrons, ApJ 411 (1993).