X-ray and optical variability of the ultraluminous X-ray source NGC 1313 X-2
Abstract
We present an analysis of recent XMM-Newton and HST archive data of the ultraluminous X-ray source NGC 1313 X-2. Quasi-simultaneous observations taken with XMM-Newton, HST and VLT allow us to study both the X-ray light curve and its correlation with the optical emission of the two proposed ULX counterparts. At the end of December 2003 the source experienced a short, but intense flare, reaching a maximum luminosity of erg/s. At the same time, the optical flux of both the suggested counterparts did not show pronounced variations (%). Assuming that the ULX emission is isotropic and taking X-ray reprocessing into account, the optical data for one of the proposed counterparts are consistent with it being an early type, main sequence star of losing matter through Roche-lobe overflow onto a black hole at an orbital separation corresponding to a period of days.
1 Introduction
When, at the beginning of the 1980s, point-like, off-nuclear X-ray sources in the field of nearby galaxies were first detected (see, e.g., Fabbiano 1989), it was immediately recognized that their luminosity was unusually large. If physically associated with their host galaxies, these sources would have an isotropic luminosity in excess of the Eddington limit for a object. Nowadays, more than 150 ultraluminous X-ray sources (ULXs) are known (see e.g. Roberts & Warwick 2000; Colbert & Ptak 2002; Swartz et al. 2004; Liu & Bregman 2005).
It is estimated that a significant fraction of ULXs are interacting supernovae or background AGNs ( 50%; see Foschini et al. 2002b; Masetti et al. 2003; Swartz et al. 2004). However, the X-ray variability of many of them is similar to that observed in Galatic X-ray binaries (see e.g. La Parola et al. 2001; Colbert & Ptak 2002; Swartz et al. 2004; Zampieri et al. 2004, hereafter Z04). The recent detection of a 62 days modulation in the light curve of M 82 X-1, interpreted as the orbital period of the system, provided a direct confirmation of the binary nature of at least some ULXs (Kaaret, Simet & Lang, 2006a, b). Moreover, ULX spectral properties share similarities with those of Galactic black hole X-ray binaries (BHXRBs, e.g. Foschini et al. 2002a). In several cases the spectrum can be well reproduced by a multicolor disk (MCD) blackbody plus a power law (PL), although the temperature of the MCD component is often much lower than that observed in BHXRBs (e.g. Miller et al. 2003, 2004; Feng & Kaaret 2005). For the brightest ULXs, a possible curvature above 2-3 keV has been recently reported and more sophisticated spectral models appear to give better agreement with observations (Stobbart et al., 2006).
All these properties along, in some cases, with the detection of stellar-like optical counterparts (Roberts et al. 2001; Goad et al. 2002; Liu et al 2002, 2004; Kaaret et al. 2004; Z04; Kaaret 2005; Mucciarelli et al. 2005, hereafter M05; Soria et al. 2005), strongly suggest that a sizeable fraction of ULXs are accreting X-ray binaries. The present debate is focussed on understanding what type of binaries they are. Many of the ULX properties can be explained if they do not emit isotropically (King et al., 2001; King, 2002; King & Pounds, 2003) or are dominated by emission from a relativistic jet (Körding et al., 2002; Georganopoulos et al., 2002; Kaaret et al., 2003). Another possibility is that they are truly emitting above the Eddington limit for , either because accretion proceeds through a slim disk (Ebisawa et al., 2003; Kawaguchi, 2003) or because the compact object is an Intermediate Mass Black Hole (IMBH) with a mass in excess of (e.g. Colbert & Mushotzky 1999; Miller et al. 2003; Patruno et al. 2005, 2006). Despite the inherent difficulties due to the low counting statistics, X-ray timing analysis has been attempted in some ULXs and led to the detection of a quasi periodic oscillation in the power density spectrum of M 82 X-1. This may represent a powerful, independent method to measure the black hole mass (Strohmayer & Mushotzky, 2003; Fiorito & Titarchuk, 2004; Dewangan et al., 2006; Mucciarelli et al., 2006).
Multiwavelength observations are an unvaluable tool to investigate the nature of ULXs. Radio emission, when present, gives important clues about the geometry, energetics and lifetime of ULXs (Kaaret et al., 2003; Miller et al., 2005). Optical observations are crucial to identify ULX counterparts and to study the properties of putative ULX binary systems. Up to now only a very small number of ULXs have been convincingly associated with stellar objects of known spectral type (e.g. Liu et al 2002, 2004; Kaaret et al. 2004; M05). All these ULXs are hosted in young stellar environments or star-forming regions and their optical counterparts have properties consistent with those of massive stars. Some ULXs are also associated with extended optical emission nebulae (Pakull & Mirioni, 2002; Pakull, Grisé & Motch, 2006).
NGC 1313 X-2 is a well studied ULX. The X-ray variability, high (isotropic) luminosity and presence of a soft X-ray spectral component make it a prototypical object. Furthermore, the presence of an emission nebula (Pakull & Mirioni 2002; Ramsey et al. 2006; Z04) and the detection of optical counterpart(s) (Z04; M05) provide a considerable amount of information on the ULX environment, available only for a very limited number of objects. Here we present a systematic study of the X-ray and optical variability of NGC 1313 X-2 based on archive data of the XMM-Newton satellite, and the ESO VLT and HST telescopes. Observations are reported in § 2 and results in § 3, where also a model for the optical emission is presented. Discussion follows.
2 Observations
2.1 X-ray observations
XMM-Newton observed NGC 1313 in 9 exposures taken between 2000 and 2004. All the observations are listed in Table 1. A detailed analysis of the October 2000 data of NGC 1313 X-2 have been performed by Z04 (see also Turolla et al. 2006). Here we report results from an analysis of the EPIC pn exposures of the 8 more recent observations. Data reduction and extraction have been carried out with standard software (XMM-SAS v. 6.0.0). All the observations are affected by solar flares. The good time intervals left after subtraction of the high background periods (when the total off-source count rate above 10 keV is 1.0 counts s-1 for EPIC pn) are reported in Table 1. For the analysis we consider all the exposures with a good time interval longer than 1 ks. After performing standard cleaning of the event lists, we extracted source counts from a circle of 40 centered on the position of NGC 1313 X-2 (Z04). The background counts were extracted from a circle of 50 on the same CCD.
The spectral analysis was carried out within XSPEC (v. 11.2.0). A two-component model consisting of an absorbed multicolor disk blackbody (MCD) plus a power law (PL) has been employed throughout, as it is routinely done for BHXRBs. Previous applications of the same spectral model to a number of ULXs, including NGC 1313 X-2 (Miller et al. 2003, 2004; Cropper et al. 2004; Kong et al. 2005; Z04) gave a satisfactory fit to the data. The absorbing column density inferred from the different datasets is consistent with a constant value. We then performed again the fits fixing to the average value weighted by the exposure time (cm-2). For consistency, we also repeated the analysis of the 2000 EPIC pn spectrum of NGC 1313 X-2 following the procedure described above. The results from the spectral fits are reported in Table 2. The XMM-Newton fluxes were consistently derived from the parameters of the spectral fits and are reported, with the corresponding luminosities, in Table 2 (a distance of 3.7 Mpc was assumed for the host galaxy; Tully 1988). The errors have been estimated from the maximum and minimum values of the flux, obtained varying the fit parameters systematically.
2.2 Optical observations
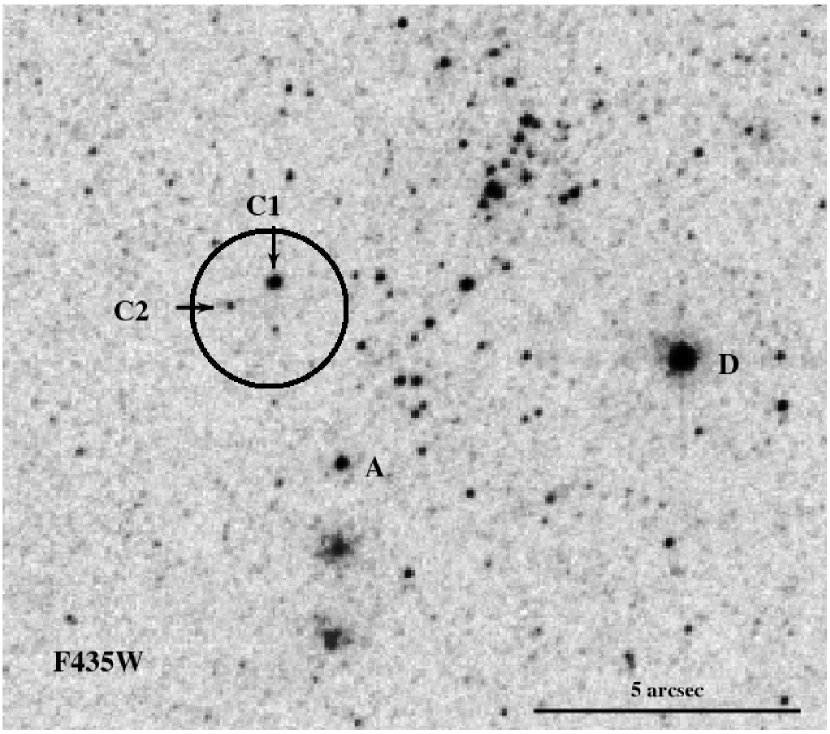
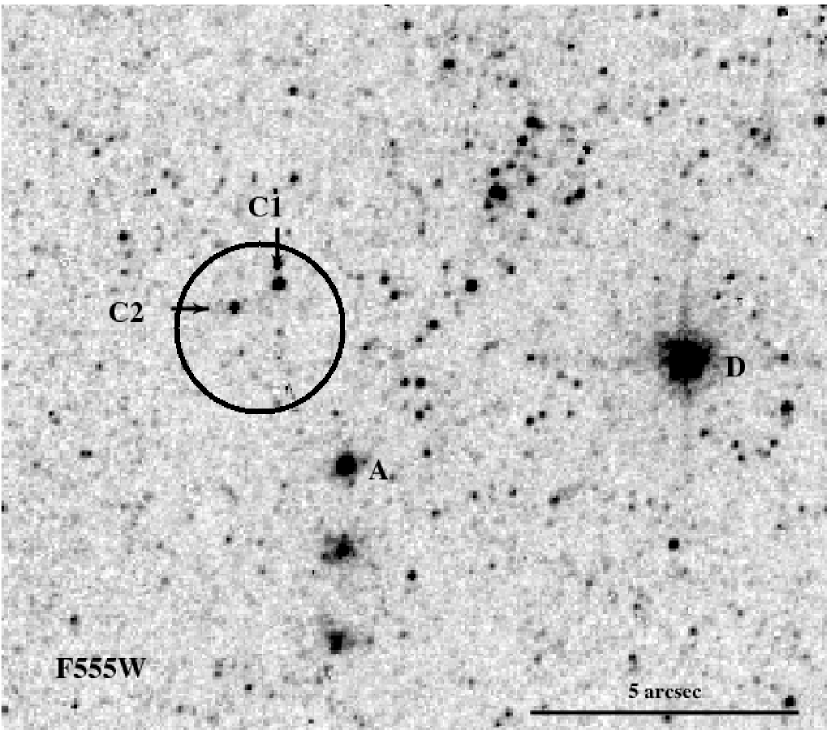
B, V and R images and spectra of NGC 1313 X-2 were taken with VLT+FORS1 in December 2003. The results were presented by M05. HST images of this field were also obtained with ACS in two epochs (see Figure 1). The optical observations were performed in parallel with the XMM-Newton pointings. The observation log of the VLT and HST images considered here are reported in Table 1. Aperture photometry was performed on the drizzled calibrated data (reduced by the HST pipeline) and transformed to the Cousins system following Sirianni et al. (2005) (see Table 3).
The uncertainty on the HST magnitudes are dominated by the calibration error ( 0.03 mag for the HST photometry of point sources), including filter transformation. As a further check of the internal consistency of the HST photometry, we compared the magnitudes of thirteen field stars obtained in the two epochs. The difference is significant only for one source in the sample ( 0.3 mag). Excluding this source, the variability of which is probably intrinsic, the magnitude changes are randomly scattered around zero, with a mean absolute deviation of 0.04 mag.
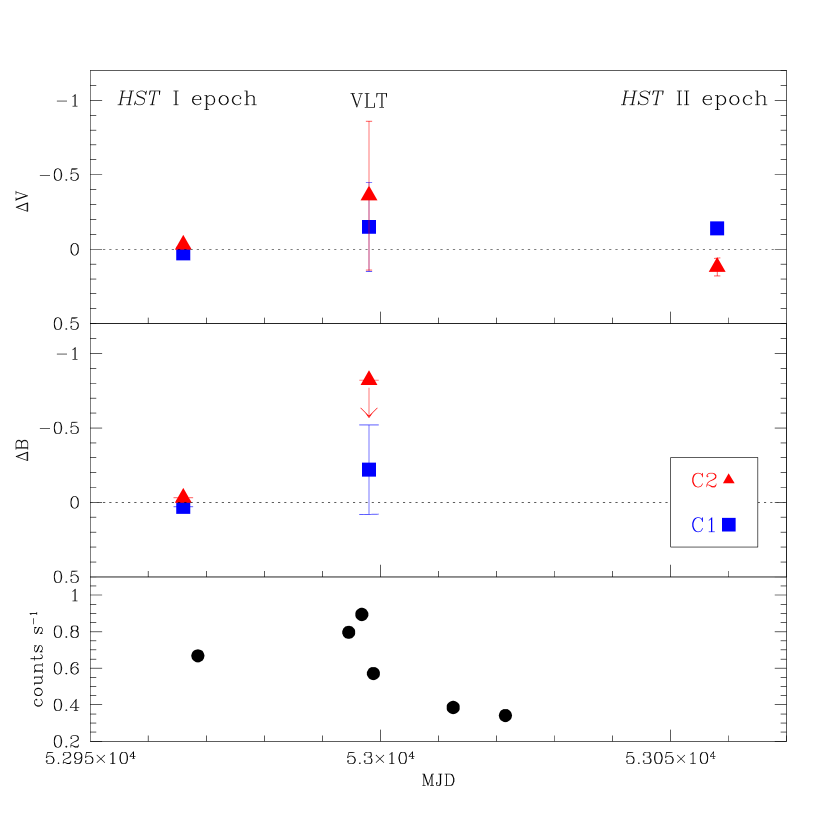
The HST images clearly confirm that two distinct objects are present inside the X-ray error box of NGC 1313 X-2 (see Figure 1), as first shown by M05 on the basis of VLT data. If we assume (Z04), taking Galactic absorption into account (the Cardelli et al. 1989 extinction law with has been adopted throughout), the unreddened colors inferred from the 1st HST epoch are (B-V) and 1.46 for C1 and C2, respectively (see Table 3). The color for object C1 is consistent with that derived from VLT data ((B-V); M05). On the basis of the HST photometry, the color of object C2 is close to that of a K3-K4 supergiant. For both objects, there is evidence of variability in the V band between the two HST epochs ( mag, Figure 2; see also Ramsey et al. 2006).
3 X-ray and optical variability
3.1 X-ray light curve
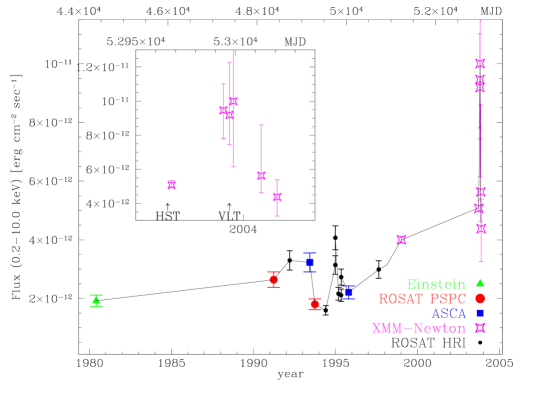
Figure 3 shows the (unabsorbed) X-ray flux for all the available observations of NGC 1313 X-2. The XMM-Newton data were derived from the best fitting spectral models (see Table 2), while the Einstein, ROSAT and ASCA data are taken from Z04.
Until 2000 NGC 1313 X-2 exhibited variability up to a factor of two on a timescale of months, with a maximum luminosity of erg s-1 (Z04). Around December 25, 2003 (observation 6 in Table 1), the source produced an intense flare, reaching a maximum unabsorbed flux of erg cm-2 s-1 (Table 2). At the distance of NGC 1313 this corresponds to an intrinsic luminosity of erg s-1. Clearly this value depends on the adopted spectral model and hence should be taken with care (see e.g. the slighty smaller values recently obtained for the October 2000 observation by Stobbart et al. 2006 adopting a more sophisticated spectral model). We also measured the fluxes of another ULX in the field (NGC 1313 X-3), known to be an interacting supernova (SN 1978K), in order to check if the significant luminosity increase was real or artificially produced by residual systematic effects between the two observations. The flux of the supernova (erg cm-2 s-1) is consistent with a constant, within the uncertainties (the variation is 20%). Hence we conclude that the luminosity increase of NGC 1313 X-2 is significant and fully qualifies NGC 1313 X-2 as a bright ULX.
From the observed maximum luminosity (erg s-1) and assuming isotropic emission, the black hole mass obtained setting ( is Eddington luminosity) is , about 2 times larger than that previously estimated by Z04. Sub-Eddington accretion would imply an even larger mass.
3.2 X-ray spectral changes
The spectra of numerous ULXs, including NGC 1313 X-2, are well described by a MCD+PL model, similarly to those observed in Galactic BHXRBs. In fact, there is also some evidence of a closer similarity, inasmuch as some ULXs appear to show state transitions (Makishima et al., 2004; Winter et al., 2005). In the following we summarize the main results of an analysis of the X-ray spectral variability of NGC 1313 X-2. The most significant result is that the slope of the PL component seems to correlate with the flux, i.e. at higher fluxes the spectrum hardens (see Table 2). This behavior was already noticed by Z04 on the basis of a comparison between two ASCA observations and is opposite to that usually shown by Galactic BHXRBs. A similar correlation was also observed in a few ULXs in the Antennae galaxy by Fabbiano et al. (2003). The MCD component is important in the Oct 2000 and in the 2003 pointings with higher counting statistics (observations 4 and 5 in Table 1). Although there is some evidence of intrinsic variability of the thermal component, no definite conclusion can be reached at present because of the insufficient statistics. Finally, we note that the flux of the MCD component is comparable to that of the PL component (see Table 2).
3.3 Modeling the optical emission
In order to study the optical emission properties of objects C1 and C2 and compare them with the HST+VLT photometry, we implemented a model to compute the optical spectrum of a binary system with an IMBH taking irradiation effects into account. Our calculation relies on the same assumptions discussed in Copperwheat et al. (2005), who recently presented a thorough investigation of the infrared-through-optical emission properties of X-ray binaries with IMBHs. More specifically, we assume that accretion onto the IMBH is fuelled by a massive companion filling its Roche lobe and that the X-ray emission is isotropic; the consequences of introducing some degree of beaming are discussed later on. A standard Shakura-Sunyaev disk (e.g. Frank, King & Raine 2002) is assumed and both the X-ray irradiation of the companion (including the effects of disk shadowing) and the self-irradiation of the disk are accounted for. Following Copperwheat et al. (2005), radiative transfer at the donor and disk surfaces is treated assuming a plane-parallel atmosphere in radiative equilibrium, illuminated by the X-ray flux emitted from the innermost part of the accretion disk (see also Wu et al. 2001). In order to keep our treatment simple, the companion star is taken to be spherical, neglecting the effects produced by the Roche lobe geometry and also those related to the (possible) deformation induced by radiation pressure. Limb and gravity darkening were not included.
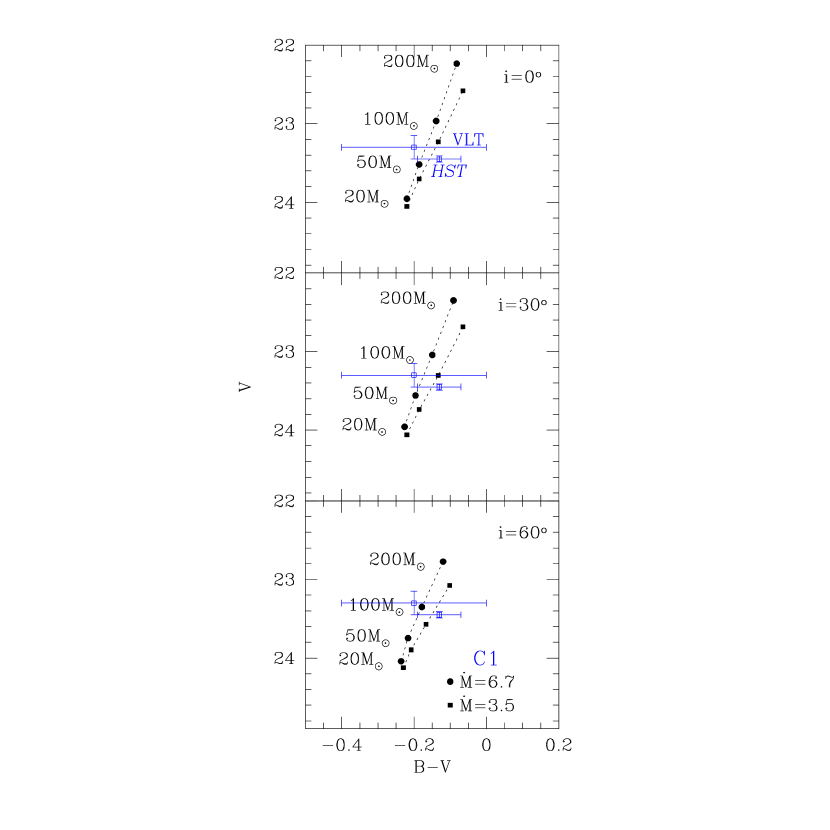
The model depends on the masses of the two components, the binary period (which, in turn, fixes the orbital separation), the accretion rate and the (unirradiated) temperature of the donor, in addition to the inclination angle and the orbital phase. The accretion efficiency and the albedo of the surface layers were chosen to be (where is the Schwarzschild radius and is the inner disk radius) and (e.g. de Jong, van Paradijs & Augusteijn 1996). Following Copperwheat et al. (2005), we took the hardness ratio . The absorption parameters in the same two spectral bands were selected as and . The V and B magnitudes of the (irradiated) disk plus donor have been computed for several values of the parameters of the binary. Each sequence of models, at fixed inclination angle , accretion rate and donor mass , corresponds to a track in the color-magnitude diagram (CMD; B-V vs. V here) along which the BH mass varies. Only inclination angles smaller than are considered because eclipsing effects of the accretion disk on the donor (and viceversa) have not been taken into account. On the other hand, from the available data there is no positive evidence for eclipses of the X-ray source or the donor in NGC 1313 X-2. The mass and luminosity class of the donor fix its (unirradiated) surface temperature . Different tracks have been obtained varying the orbital period which, in turn, determines the Roche lobe radius. The maximum allowed period is that for which the Roche lobe radius is equal to the donor radius. The computed tracks are compared with the optical (unreddened) magnitudes and colors of objects C1 and C2 for both the VLT and HST observations in § 3.4.
3.4 Objects C1 and C2
In order to constrain the parameters of the binary, we used the optical binary emission model introduced in Section 3.3. One of the 2003 XMM-Newton pointings of NGC 1313 X-2 is within 2-3 days from the 1st HST epoch, while another is close to the VLT observation. These two XMM-Newton observations are those of 2003 November 25 and December 23; the latter was preferred to the observation of December 25 because of the higher statistics. It is therefore of interest to compare the V and B magnitudes of objects C1 and C2 in these two epochs. The variation of the unabsorbed X-ray flux between the same epochs is 80% (see Table 2). At the same time, however, the V and B band magnitudes of C1 do not show significant evidence of variability. The relative photometric error between the HST and VLT data as measured on a sample of field stars is in fact mag (see Figure 2). A similar conclusion is reached also for object C2. Again, the magnitude change between the HST and VLT epochs is always smaller than the relative photometric error ( mag for objects fainter than V=24; see again Figure 2).
As an initial guess for the donor parameters in our model we use the values inferred on the basis of VLT photometry (M05): an O9-B0 V star of , K for C1, and a G-K I star of , K for C2. As mentioned above, this is consistent with what inferred from the HST photometry. The donor star in the case of of object C1 is assumed to be on the zero age main sequence and in contact with the Roche lobe (i.e. its radius is equal to the Roche lobe radius). Possible evolutionary effects or disturbances caused by the intense mass transfer are not accounted for. Results for object C1 are shown in Figure 4 for two different values of , chosen in such a way to match the XMM-Newton flux measured in the two observations of 2003 November 25 and December 23. The tracks on the CMD diagram are in agreement with the observed V band magnitude and (B-V) color of object C1 for d, and K (corresponding to an early B main sequence star). Taking into account for current uncertainties on both color and magnitude, the companion mass and temperature, and the orbital period may vary in the ranges , , and d, respectively. If the donor makes contact with its Roche lobe and , the orbital period becomes a function only of the donor radius (or mass). In fact, when combining together the III Kepler’s law and the expression for the Roche lobe radius (Frank, King & Raine, 2002), the dependence on disappears. As shown in Figure 4, the VLT and HST photometric points intersect the corresponding tracks at about the same value of the IMBH mass. This value increases with increasing inclination angle. Results shown in Figure 4 refer to orbital phase zero (superior conjunction). The variation in the V (B) band between the 1st HST epoch and the VLT one is (), consistent (within the errors) with what observed. Thus, although in these systems X-ray irradiation is very intense, the induced optical variability is not very large owing to the high intrinsic emission of the massive B donor. The calculation for phases 0.25 and 0.5 gives results similar to those obtained for phase 0, typically within 0.15 mag. Thus, this is the expected amplitude of the modulation possibly induced by the orbital motion. It is interesting to note that this result is consistent with the degree of variability observed in the V band between the two HST observations ( mag; see Figure 2).
A direct comparison of the three cases illustrated in Figure 4 shows that relatively large values of the inclination angle () are required in order to obtain the correct optical flux for a BH mass . At lower inclination angles (top and middle panels of Figure 4), the black hole masses needed to reproduce the optical magnitudes and color of object C1 are too small for the X-ray flux to be below the Eddington limit (if the emission is isotropic). Therefore, unless the Eddington limit can be circumvented, the binary system is expected to have a significant inclination angle. We note that, for any value of , the BH mass inferred from Figure 4 is always . This absolute lower limits for is still compatible with a very small beaming (). In this case the general picture discussed above reasonably continues to hold. On the other hand, if the ULX emission is more seriously beamed, the BH mass could be smaller: for a beaming factor 1/6, can be as small as without exceeding the Eddington limit. In this case, we expect no X-ray irradiation of both the disk and the companion, being the emission collimated away from the orbital plane. To test this possibility we computed a new sequence of models, following the same procedure outlined above, but switching off the disk/donor irradiation. It turns out that it is possible to reproduce the correct magnitude and color, although the donor is now less massive and cooler. However, this implies that the star is too small to fill its Roche lobe and thus accretion can not proceed through Roche lobe overflow. Wind accretion may still be possible, although it seems unlikely that it can produce the required value of .
The situation for object C2 is reversed. We explored the parameter space by varying the donor mass and orbital period, but did not find any combination of values which could reproduce the data in the framework of isotropic emission. In particular, X-ray irradiation causes the (B-V) color to always exceed the observed one. On the other hand, a massive and very extended K-type supergiant (, K, days) would have properties consistent with those of object C2 if the black hole mass is . This of course requires a (moderate) beaming. We checked that a beaming factor of is enough and that the companion fills its Roche lobe. The optical magnitudes are correctly reproduced because the (unirradiated) disk contribution becomes negligible in comparison with the star intrinsic luminosity. However, in this case practically no variation in the optical is expected in response to an increase of the accretion rate, and the predicted magnitudes of C2 are constant. This is in contrast with the evidence of variability observed in the V band between the two HST observations ( mag; see Section 2.2 and Figure 2), although some variations may be induced also by the orbital ellipsoidal modulation of the donor (which we did not take into account).
4 Discussion
Although present data do not allow to reach a definite conclusion on the actual counterpart of the ULX NCG 1313 X-2, some firm points may be derived from the analysis presented in the preceeding sections. If C1 is the counterpart, as it seems more likely, our model indicates that this is an IMBH X-ray binary with a relatively massive main sequence donor which fills its Roche lobe. Taking a black hole mass of , as required to account for the observed X-ray flux in terms of isotropic emission, the donor mass is in the interval (taking photometric uncertainties into account, § 3.4). This is larger than the maximum main sequence mass of the parent stellar association, , estimated using multicolor photometry and isochrone fitting by Pakull, Grisé & Motch (2006) and Ramsey et al. (2006). However, considering that the lower bound for the donor mass is , the difference is small. We note also that, if C1 is the counterpart and C2 belongs to the same stellar association, the estimated masses of the two stars correctly places them on (or close to) and out of the main sequence, respectively. If the counterpart is C2 then the source is a binary formed by a late type, massive supergiant and a stellar mass black hole with beamed X-ray emission. However, this scenario has some shortcomings. First, it predicts little if no optical variability, and this is in apparent contrast with the variations seen in the two HST observations. Second, the duration of the supergiant phase for a star is very short (a few), making the possiblity of catching the binary is such an evolutionary stage not very likely (Patruno & Zampieri, 2006). Third, the accurate astrometry of the field made possible by the cross-identification on the Chandra and HST images of a background galaxy appears to strengthen the association of NGC 1313 X-2 with object C1, ruling out object C2 (J.-F. Liu, private communication).
For object C1, an orbital modulation of amplitude is expected because of orbital inclination and X-ray irradiation effects. This modulation is superimposed to a comparable variation caused by changes in the irradiating X-ray flux ( mag). In this respect, it is interesting to note that similar variations in the observed B band VLT+Subaru photometry of object C1 have been recently reported also by Pakull, Grisé & Motch (2006), consistent with our findings. In principle, with a sufficient and suitably spaced number of observations, the orbital modulation can be singled out and measured with large area ground telescopes or HST. The detection of this modulation would lead to the unambiguous determination of the orbital period of the binary. This, in turn, would allow us to definitely discriminate between C1 and C2 and, most importantly, to constrain the mass ratio of NGC 1313 X-2 and, eventually, the mass of the black hole.
References
- Cardelli et al. (1989) Cardelli, J.A., Clayton, G.C. & Mathis, J.S. 1989, ApJ, 345, 245
- Colbert & Mushotzky (1999) Colbert, E.J.M., & Mushotzky, R.F. 1999, ApJ, 519, 89
- Colbert & Ptak (2002) Colbert, E.J.M., & Ptak, A.F. 2002, ApJS, 143, 25
- Copperwheat et al. (2005) Copperwheat, C., Cropper, M., Soria, R., & Wu, K. 2005, MNRAS, 362, 79
- Cropper et al. (2004) Cropper, M. et al. 2004, MNRAS, 349, 39
- de Jong, van Paradijs & Augusteijn (1996) de Jong, J.A., van Paradijs, J., & Augusteijn, T. 1996, A&A, 314, 484
- Dewangan et al. (2006) Dewangan, G.C., Titarchuk, L., & Griffiths, R.E. 2006, ApJ, 637, L21
- Ebisawa et al. (2003) Ebisawa, K. et al. 2003, ApJ, 597, 780
- Fabbiano (1989) Fabbiano, G. 1989, ARA&A, 27, 87
- Fabbiano et al. (2003) Fabbiano, G. et al., 2003, ApJ, 584, 5
- Feng & Kaaret (2005) Feng, H., & Kaaret, P. 2005, ApJ, 633, 1052
- Fiorito & Titarchuk (2004) Fiorito, R., & Titarchuk, L., 2004, ApJ, 614, L113
- Foschini et al. (2002a) Foschini, L. et al. 2002a, A&A, 392, 817
- Foschini et al. (2002b) Foschini, L., Ho, L.C. & Masetti, N. 2002b, A&A, 396, 787
- Frank, King & Raine (2002) Frank, J., King, A., & Raine, D.J. 2002, Accretion Power in Astrophysics (Cambridge, Cambridge University Press)
- Georganopoulos et al. (2002) Georganopoulos, M., Aharonian, F.A., & Kirk, J.G. 2002, A&A, 388, L25
- Goad et al. (2002) Goad, M.R. et al. 2002, MNRAS, 335, L67
- Kaaret et al. (2003) Kaaret, P., Corbel, S., Prestwich, A.H., & Zezas, A. 2003, Science, 299, 365
- Kaaret et al. (2004) Kaaret, P., Ward, M.J., & Zezas, A. 2004, MNRAS, 351, 83
- Kaaret (2005) Kaaret, P. 2005, ApJ, 629, 233
- Kaaret, Simet & Lang (2006a) Kaaret, P., Simet, M.G., & Lang, C.C. 2006a, Science, 311, 491
- Kaaret, Simet & Lang (2006b) Kaaret, P., Simet, M.G., & Lang, C.C. 2006b, ApJ, 646, 174
- Kawaguchi (2003) Kawaguchi, T. 2003, ApJ, 593, 69
- King et al. (2001) King, A.R. et al. 2001, ApJ, 552, 109
- King (2002) King, A.R. 2002, MNRAS, 335, L13
- King & Pounds (2003) King, A.R., & Pounds, K.A. 2003, MNRAS, 345, 657
- Kong et al. (2005) Kong, A.K.H., Rupen, M.P., Sjouwerman, L.O. & Di Stefano, R. 2005, in Proceedings of the XXII Texas Symposium on Relativistic Astrophysics, Stanford University, in press (astro-ph/0503465)
- Körding et al. (2002) Körding, E., Falcke, H. & Markoff, S. 2002, A&A, 382, L13
- La Parola et al. (2001) La Parola, V. et al. 2001, ApJ, 556, 47
- Liu et al (2002) Liu, J., Bregman, J.N., & Seitzer, P. 2002, ApJ, 580, 31
- Liu et al (2004) Liu, J., Bregman, J.N., & Seitzer, P. 2004, ApJ, 602, 249
- Liu & Bregman (2005) Liu, J., & Bregman, J.N. 2005, ApJS, 157, 59
- Makishima et al. (2004) Makishima, K. et al. 2004, AAS, 204
- Masetti et al. (2003) Masetti, N. et al. 2003, A&A, 406, L27
- Miller et al. (2003) Miller, J.M., Fabbiano, G., Miller, M.C. & Fabian, A.C. 2003, ApJ, 585, L37
- Miller et al. (2004) Miller, J.M., Fabian, A.C. & Miller, M.C. 2004, ApJ, 607, 931
- Miller et al. (2005) Miller, N.A., Mushotzky, R.F., & Neff, S.G. 2005, ApJ, 623, L109
- Mucciarelli et al. (2005) Mucciarelli P. et al. 2005, ApJ, 633, 101 (M05)
- Mucciarelli et al. (2006) Mucciarelli, P. et al. 2006, MNRAS, 365, 1123
- Pakull & Mirioni (2002) Pakull, M.W., & Mirioni, L. 2002, in Proc. ESA Symp., New Visions of the X-ray Universe in the XMM-Newton and Chandra Era, eds. F. Jansen et al. (ESA SP-488) (astro-ph/0202488)
- Pakull, Grisé & Motch (2006) Pakull, M.W., Grisé, F., & Motch, C. 2006, IAUS, 230, 293
- Patruno et al. (2005) Patruno, A., Colpi, M., Faulkner, A., Possenti, A. 2005, MNRAS, 364, 344
- Patruno et al. (2006) Patruno, A., Portegies Zwart, S., Dewi, J. & Hopman, C. 2006, MNRAS, 370. L6
- Patruno & Zampieri (2006) Patruno, A., & Zampieri, L. 2006, MNRAS, submitted
- Ramsey et al. (2006) Ramsey, C.J. et al. 2006, ApJ, 641, 241
- Roberts & Warwick (2000) Roberts, T.P., & Warwick, R.S. 2000, MNRAS, 315, 98
- Roberts et al. (2001) Roberts, T.P. et al. 2001, MNRAS, 325, L7
- Sirianni et al. (2005) Sirianni, M. et al. 2005, PASP, 117, 1049
- Soria et al. (2005) Soria, R. et al. 2005, MNRAS, 356, 12
- Stobbart et al. (2006) Stobbart, A.M., Roberts, T.P., Wilms, J. 2006, MNRAS, 368, 397
- Strohmayer & Mushotzky (2003) Strohmayer, T.E., Mushotzky, R.F., 2003, ApJ, 586, L61
- Swartz et al. (2004) Swartz, D.A., Ghosh, K.K., Tennant, A.F., & Wu, K. 2004, ApJS, 154, 519
- Tully (1988) Tully, R.B. 1988, Nearby Galaxies Catalog (Cambridge: Cambridge University Press)
- Turolla et al. (2006) Turolla, R. et al. 2006, in AdSpR, 38, 1374
- Winter et al. (2005) Winter, L.M., R.F. Mushotzky and C.S.Reynolds Collaboration, 2005, AAS, 207, 90.05
- Wu et al. (2001) Wu, K., Soria, R., Hunstead, R.W., & Johnston, H.M. 2001, MNRAS, 320, 177
- Zampieri et al. (2004) Zampieri, L. et al. 2004, ApJ, 603, 523 (Z04)
| Instrument | Obs. Id. | Date | Exposure | GTIaaGood Time Intervals in which the total off-source count rate above 10 keV is 1.0 counts s-1. | Filter | |
|---|---|---|---|---|---|---|
| 1 | XMM-Newton EPIC pn | 0106860101 | 2000-10-17 | 31637s | 20600s | Medium |
| 2 | XMM-Newton EPIC pn | 0150280101 | 2003-11-25 | 8365s | 1087s | Thin |
| 3 | XMM-Newton EPIC pn | 0150280201 | 2003-12-09 | 5620s | 0s | Thin |
| 4 | XMM-Newton EPIC pn | 0150280301 | 2003-12-21 | 10334s | 8272s | Thin |
| 5 | XMM-Newton EPIC pn | 0150280401 | 2003-12-23 | 14094s | 3600s | Thin |
| 6 | XMM-Newton EPIC pn | 0150280501 | 2003-12-25 | 15282s | 1668s | Thin |
| 7 | XMM-Newton EPIC pn | 0150280701 | 2003-12-27 | 16666s | 0s | Thin |
| 8 | XMM-Newton EPIC pn | 0150280601 | 2004-01-08 | 14756s | 7696s | Thin |
| 9 | XMM-Newton EPIC pn | 0150281101 | 2004-01-16 | 7034s | 4208s | Thin |
| VLT+FORS1 | 2003-12-24 | 8402 | B | |||
| VLT+FORS1 | 2003-12-25 | 6002 | V | |||
| HST+ACS(I epoch) | 2003-11-22 | 5802 | F555w | |||
| HST+ACS | 2003-11-22 | 6304 | F435w | |||
| HST+ACS(II epoch) | 2004-02-22 | 6004 | F555w |
| Date | Count rate | FluxbbUnabsorbed flux in units of erg cm-2 s-1 | ccRatio of the (unabsorbed) fluxes of the MCD and PL components. | ddUnabsorbed luminosity, in units of erg s-1, for a distance of 3.7 Mpc | [keV] | |||
|---|---|---|---|---|---|---|---|---|
| 1 | 2000-10-17 | 0.24 | 4.00 | 0.93 | 6.52 | 0.16 | 2.3 | 1.24/75 |
| 2 | 2003-11-25 | 0.67 | 5.07 | – | 8.30 | – | 2.3 | 1.06/44 |
| 4 | 2003-12-21 | 0.80 | 9.46 | 0.63 | 15.43 | 0.13 | 1.9 | 1.11/144 |
| 5 | 2003-12-23 | 0.89 | 9.19 | 0.94 | 14.99 | 0.15 | 1.8 | 0.99/140 |
| 6 | 2003-12-25 | 0.56 | 10.0 | 0.87 | 16.31 | 0.15 | 2.1 | 0.99/42 |
| 8 | 2004-01-08 | 0.39 | 5.63 | 0.47 | 9.18 | 0.13 | 2.5 | 0.82/67 |
| 9 | 2004-01-16 | 0.34 | 4.38 | 0.45 | 7.14 | 0.17 | 2.3 | 1.01/66 |
| Filter | C1 | C2 | |
|---|---|---|---|
| HST I epoch | B | 23.720.04 | 26.020.04 |
| VLT | B | 23.500.15 | 25.2 |
| HST I epoch | V | 23.750.04 | 24.460.04 |
| VLT | V | 23.600.15 | 24.100.15 |
| HST II epoch | V | 23.610.04 | 24.570.04 |
| HST I epoch | B-V | -0.030.06 | 1.560.06 |
| VLT | B-V | -0.10.2 | 1.1 |