Age constraints for an M31 globular cluster from SEDs-fit
Abstract
We have constrained the age of the globular cluster S312 in the Andromeda galaxy (M31) by comparing its multicolor photometry with theoretical stellar population synthesis models. This is both a check on the age of this globular cluster, as well a check on our methodology. Main-sequence photometry has been the most direct method for determining the age of a star cluster. S312 was observed as part of the Beijing-Arizona-Taiwan-Connecticut (BATC) Multicolor Sky Survey from 1995 February to 2003 December. The photometry of BATC images for S312 was taken with 9 intermediate-band filters covering Å. Combined with photometry in the near-ultraviolet (NUV) of GALEX, broad-band and infrared of 2MASS, we obtained the accurate spectral energy distributions (SEDs) of S312 from Å. A quantitative comparison to simple stellar population models yields an age of Gyr, which is in very good agreement with the previous determination by main-sequence photometry. S312 has a mass of , and is a medium-mass globular cluster in M31. By analysis of errors of ages determined based on the SED fitting method of this paper, secure age constraints are derived with errors of Gyr for ages younger than 9 Gyr. In fact, the theoretical SEDs are not sensitive to the variation of age for ages greater than Gyr. Therefore, for globular clusters as old as the majority of the Galactic GCs, our method do not distinguish them accurately. We emphasize that our results show that even with multiband photometry spanning NUV to , our age constraints from SED fitting are distressingly uncertain, which has implications for age derivations in extragalactic globular cluster systems.
Subject headings:
galaxies: individual (M31) – galaxies: star clusters – galaxies: stellar content1. Introduction
Galactic globular clusters (GCs), which are thought to be among the oldest stellar objects in the Universe, provide vitally important information regarding the minimum age of the Universe and the early formation history of our Galaxy. The most direct method for determining the age of a star cluster is main-sequence photometry, since the turn-off is mostly affected by age (see Puzia et al., 2002b, and references therein). However, this method has only been applied to the Galactic GCs and globular clusters in the satellites of the Milky Way (e.g., Rich et al., 2001) before Brown et al. (2004). Generally, extragalactic globular cluster ages are inferred from composite colors and/or spectroscopy. S312, first detected by Sharov (1973) (No.19), then by Sargent et al. (1977) (No.312=S312) and Battistini et al. (1987) (No.379=Bo379), is among the first extragalactic globular clusters whose age was accurately estimated by main-sequence photometry (Brown et al., 2004). Brown et al. (2004) obtained the color-magnitude diagram (CMD) below the main-sequence turnoff for S312 using the extremely deep images of M31 with the Advanced Camera for Surveys (ACS) on the (HST). Brown et al. (2004) estimated an age of 10 Gyr for S312 by the quantitative comparison to isochrones of VandenBerg et al. (2006).
This cluster was also observed as part of the galaxy calibration program of the Beijing-Arizona-Taiwan-Connecticut (BATC) Multicolor Sky Survey (e.g., Fan et al., 1996; Zheng et al., 1999) in 9 intermediate-band filters. Combined with photometry in NUV of GALEX, broad-band and infrared of the Two Micron All Sky Survey (2MASS), we obtained the accurate SEDs of S312 in 17 filter bands from Å.
Since the pioneering work of Tinsley (1968, 1972) and Searle (1973), evolutionary population synthesis modelling has become a powerful tool to interpret integrated spectrophotometric observations of galaxies and their subcomponents, such as star clusters (Anders et al., 2004). The evolution of star clusters is usually modelled by means of a simple stellar population (SSP) approximation. An SSP is defined as a single generation of coeval stars formed from the same progenitor molecular cloud (thus implying a single metallicity), and governed by a given initial mass function (IMF). Globular clusters, which are bright and easily identifiable, are typically characterized by homogeneous abundance and age distributions. For example, Barmby & Huchra (2001) compared the predicted SSP colors of three stellar population synthesis models to the intrinsic broad-band colors of Galactic and M31 GCs, and found that the best-fitting models match the clusters’ SEDs very well indeed.
In this paper, we constrain the age of S312 by comparing observational SEDs (Sect. 2) with population synthesis models in Sect. 3. Our independently-constrained result is in very good agreement with the previous determination of Brown et al. (2004). We give discussions and summarize our results in Sect. 4.
2. Optical and infrared observations of GC S312
2.1. Historical observations of GC S312
S312 was first detected by Sharov (1973), who searched 25 M31 globular clusters and cluster candidates using plates taken with the 80/120/240-cm Schmidt telescope of the Radio Astrophysical Observatory of the Latvian Academy of Sciences. Since that time, Sargent et al. (1977) and Battistini et al. (1987) confirmed S312 to be an M31 globular cluster.
2.2. Archival images of the BATC sky survey
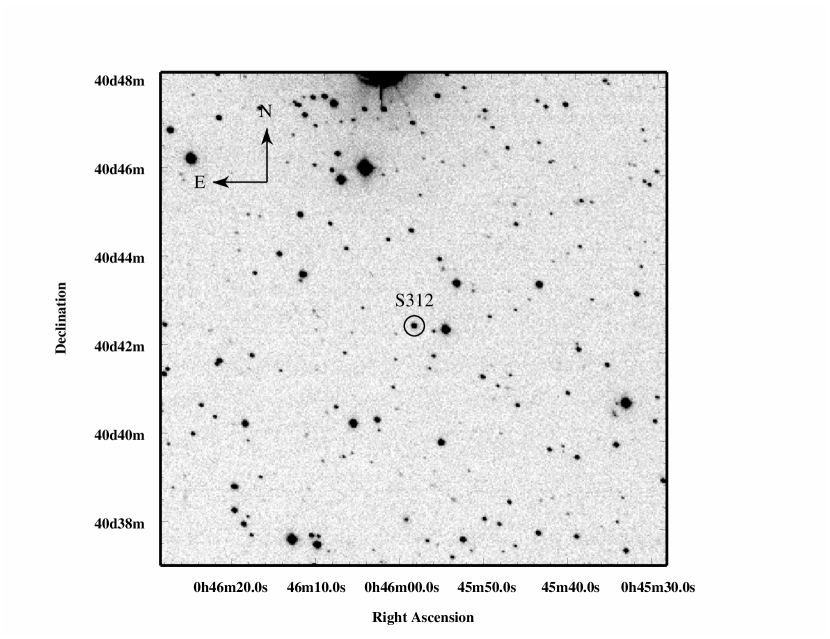
Observations of S312 were obtained by the BATC 60/90cm Schmidt telescope located at the XingLong station of the National Astronomical Observatory of China (NAOC). This telescope has 15 intermediate-band filters covering the optical wavelength range of Å, and is specifically designed to avoid contaminations from the brightest and most variable night-sky emission lines. Descriptions of the BATC photometric system can be found in Fan et al. (1996). The finding chart of GC S312 in the band (centered on 5795 Å) of the BATC system with the NAOC 60/90cm Schmidt telescope is illustrated in Figure 1.
We extracted 125 images of M31, taken in 9 BATC filters from the BATC survey archive during 1995 February–2003 December. Table 1 contains the log of observations. Multiple images of the same filter were combined to improve the image quality.
2.3. Intermediate-band photometry of S312
Since S312 is located in the M31 halo, it is easy to do the photometry. The intermediate-band magnitudes of S312 are determined on the combined images with the standard aperture photometry, i.e. the PHOT routine in DAOPHOT (Stetson, 1987). The BATC photometric system calibrates the magnitude zero level similar to the spectrophotometric AB magnitude system. For the flux calibration, the Oke-Gunn primary flux standard stars HD 19445, HD 84937, BD +26∘2606, and BD +17∘4708 taken from Oke & Gunn (1983), were observed during photometric nights (Yan et al., 2000). The results of well-calibrated photometry of S312 in 9 filters are summarized in the fifth column of Table 1.
2.4. GALEX, broad-band and 2MASS photometry of S312
In order to constrain the age of S312 accurately, we use as many photometric data points covering as large a wavelength range as possible. M31 field was observed as part of the Nearly Galaxy Survey (NGS) carried out by Galaxy Evolution Explorer (GALEX) in two UV bands: far-ultraviolet (FUV) and near-ultraviolet (NUV) (see details from Rey et al., 2005, 2006). Rey et al. (2006) presented the photometric data for 485 and 273 M31 GCs in GALEX NUV and FUV, respectively. S312 was not detected in FUV from Rey et al. (2006, also S.-C. Rey, priv. comm.). Using the CCD imaging of 0.9m telescope at the Kitt Peak National Observatory, Reed, Harris & Harris (1994) presented CCD integrated magnitudes and color indices for 41 globular clusters and cluster candidates in the outer halo of M31 including S312. Battistini et al. (1987) presented photometry from the photographic plates for their most sample globular clusters and candidates including S312, however they did not give photometric uncertainties. In this paper, for S312, we adopted CCD photometry of Reed, Harris & Harris (1994), and photographic photometry of Battistini et al. (1987) with a photometric uncertainty of 0.08 mag as suggested by Galleti et al. (2004).
As pointed out by Worthey (1994), the age-metallicity degeneracy in optical broad-band colors is , implying that the composite spectrum of an old stellar population is indistinguishable from that of a younger but more metal-rich population (and vice versa) (also see MacArthur et al., 2004). de Jong (1996) showed that this degeneracy can be partially broken by adding 2MASS infrared photometry to the optical colors. Cardiel et al. (2003) found that inclusion of an infrared band can improve the predictive power of the stellar population diagnostics by times over using optical photometry alone. Wu et al. (2005) also showed that the use of near-infrared colors can break the age-metallicity degeneracy. At the same time, as Kissler-Patig et al. (2002) and Puzia et al. (2002a) indicated that near-infrared photometry is less sensitive to interstellar extinction with respect to the classical optical bands, it provides useful complementary information that can help to disentangle the age-metallicity degeneracy (also see Galleti et al., 2004).
In this paper, we add photometry from the 2MASS Point Source Catalogue (PSC) to broad- and intermediate-band optical, and ultraviolet photometry to constrain the age of S312 to the highest possible accuracy. 2MASS presents and complete homogeneous photometry of 99.998 % of the sky down to (completeness 99 % for ). The near-ultraviolet, broad-band and 2MASS photometric data points of S312 are listed in Table 2.
3. Stellar population of S312
3.1. Stellar populations and synthetic photometry
As a check on the age of S312, and also on a check of our methodology, we compare its spectral energy distributions with theoretical stellar population synthesis models. We used the SSP models of Bruzual & Charlot (2003) (hereafter BC03), which have been upgraded from the Bruzual & Charlot (1993, 1996) version, and now provide the evolution of the spectra and photometric properties for a wider range of stellar metallicities. BC03 provide 26 SSP models (both of high and low resolution) using the 1994 Padova evolutionary tracks, 13 of which were computed using the Chabrier (2003) IMF assuming lower and upper mass cut-offs of and , respectively. The other 13 were computed using the Salpeter (1955) IMF with the same mass cut-offs. In addition, BC03 provide 26 SSP models using the 2000 Padova evolutionary tracks. However, as Bruzual & Charlot (2003) pointed out, the 2000 Padova models, which include more recent input physics than the 1994 models, tend to produce worse agreement with observed galaxy colors. These SSP models contain 221 spectra describing the spectral evolution of SSPs from yr to 20 Gyr. The evolving spectra include the contribution of the stellar component at wavelengths from 91Å to m. In this paper, we adopt the high-resolution SSP models computed using the 1994 Padova evolutionary tracks and a Salpeter (1955) IMF111We note that because of the slow SED evolution of SSPs at ages in excess of a few Gyr, all of the most commonly used spectral synthesis models agree very well at these ages. Therefore, the choice of IMF is only important for estimating the photometric mass of the cluster, and does not affect the determination of the age of S312.. We note that although the current best constraint of the age of the Universe is of order 13.7 Gyr, the SSP models and the stellar evolutionary tracks that form their basis have been calculated for ages up to 20 Gyr. It is not straightforward to correct for this discrepancy; one would need to recalculate all stellar evolutionary tracks for all metallicities.
Since our observational data are integrated luminosites through our set of filters, we convolved the BC03 SSP SEDs with the BATC intermediate-, GALEX NUV-, broad-band and 2MASS filter response curves to obtain synthetic ultraviolet, optical and near-infrared photometry for comparison. The synthetic filter magnitude can be computed as
| (1) |
where is the theoretical SED and the response curve of the filter of the BATC, GALEX, and 2MASS photometric systems. Here, varies with age and metallicity.
3.2. Reddening and metallicity of S312
To obtain the intrinsic SEDs of S312, the photometry must be dereddened. Barmby et al. (2000) determined the reddening for each individual cluster using correlations between optical and infrared colours and metallicity and by defining various “reddening-free” parameters using their large database of multi-colour photometry. Barmby et al. (2000) found that the M31 and Galactic GC extinction laws, and the M31 and Galactic GC colour-metallicity relations are similar to each other. They then estimated the reddening to M31 objects with spectroscopic data using the relation between intrinsic optical colours and metallicity for Galactic clusters. For objects without spectroscopic data, they used the relationships between the reddening-free parameters and certain intrinsic colours based on the Galactic GC data. Barmby et al. (2000) compared their results with those in the literature and confirmed that their estimated reddening values are reasonable, and quantitatively consistent with previous determinations for GCs across the entire M31 disc. In particular, Barmby et al. (2000) showed that the distribution of reddening values as a function of position appears reasonable in that the objects with the smallest reddening are spread across the disk and halo, while the objects with the largest reddening are concentrated in the galactic disk. Therefore, we adopted the reddening values from Barmby et al. (2000, also P. Barmby, priv. comm.) for S312 to be as Rey et al. (2006) did. The values of extinction coefficient are obtained by interpolating the interstellar extinction curve of Cardelli et al. (1989).
The SEDs for clusters are significantly affected by the adopted metallicity, especially for old clusters. So, only if the metallicity is known, the age of a cluster can be constrained accurately. Huchra et al. (1991) derived metallicities for 150 M31 globular clusters including S312, using the strengths of six absorption features in the cluster integrated spectra. The metallicity of S312, obtained by Huchra et al. (1991), is . Holland et al. (1997) used WFPC2 photometry to construct deep color-magnitude diagrams for S312, and the shape of the red giant branch gave an iron abundance of . In this paper, we adopt for comparison as Brown et al. (2004) did.
3.3. Comparison of the age scale
Before constraining the age of S312, we compare the age scale between the Padova 1994 evolutionary tracks (Bertelli et al., 1994) used by BC03 and the 2006 vandenBerg isochrones (VandenBerg et al., 2006) used in Brown et al. (2004). As an example, we only draw the isochrones with 10 Gyr and the solar metallicity. Figure 2 shows the isochrones between effective temperaure and bolometric magnitudes. It is clear that the matching is very good in the main sequence (MS) and the subgiant branch (SGB). As we know, the main-sequence photometry focuses on the upper end of the MS and SGB, since uncertainties in models of stars on the red giant branch (RGB) are large. So, if Brown et al. (2004) had fitted the color-magnitude diagram (CDM) of S312 with the Padova 1994 evolutionary tracks, its age would have been close to 10 Gyr.

3.4. Fit results
We use a minimization test to examine which BC03 SSP models are most compatible with the observed SEDs, following
| (2) |
where is the integrated magnitude in the filter of a theoretical SSP at age , presents the intrinsic integrated magnitude in the same filter and
| (3) |
Here, is the observational uncertainty, and is the uncertainty associated with the model itself, for the filter. Charlot et al. (1996) estimated the uncertainty associated with the term by comparing the colors obtained from different stellar evolutionary tracks and spectral libraries. Following Wu et al. (2005), we adopt in this paper.
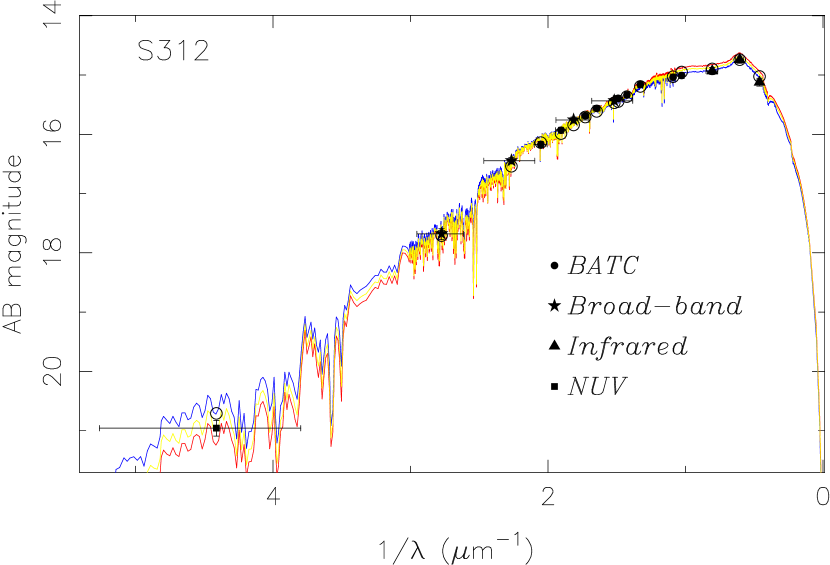
The BC03 SSP models include six initial metallicities, , , , , (solar metallicity), and . Spectra for other metallicities can be obtained by linear interpolation of the appropriate spectra for any of these metallicities. For S312, whose metallicity and reddening values were published by other authors, the cluster age is the sole parameter to be estimated (for a given IMF and extinction law, which we assume to be universal). In Figure 3, we show the intrinsic SEDs of S312, the integrated SEDs of the best-fitting model, and the spectra of the best-fitting model superimposed the 3-sigma spectra. The best reduced of 18.23 is achieved with an age of Gyr, which is in very good agreement with the previous determination (10 Gyr) of Brown et al. (2004) by main-sequence photometry. From Figure 3, we can see that, the 3-sigma spectra deviate clearly from best-fitting ones, i.e. these three spectra clearly separate. This indicates that we can constrain the age of S312 with errors of about 3 Gyr.
3.5. Mass of S312
Star cluster masses can be estimated by comparing the measured luminosity in band with the theoretical mass-to-light ratios. These ratios are a function of the cluster age and metallicity. BC03 calculated these ratios for a range of metallicities. Mass-to-light ratios for other metallicities can be obtained by linear interpolation of the appropriate ratios for any of these metallicities. For and 9.5 Gyr, we derived the mass-to-light ratio in broad-band to be . Based on its present luminosity, mag and the extinction, , its intrinsic luminosity is mag [assuming the Cardelli et al. (1989) Galactic reddening law; mag]. From this, we determine the mass of S312 to be . Comparing with 037-B327 [ M⊙ (Barmby et al., 2002) or M⊙ (Ma et al., 2006)] and G1 [ M⊙ (Meylan et al., 2001)] in M31 and Cen [M⊙ (Meylan, 2002)] in the Milky Way, the most massive clusters in the Local Group, S312 is only a medium-mass globular cluster.
3.6. Comparison with SSP models based on the 2000 Padova evolutionary tracks
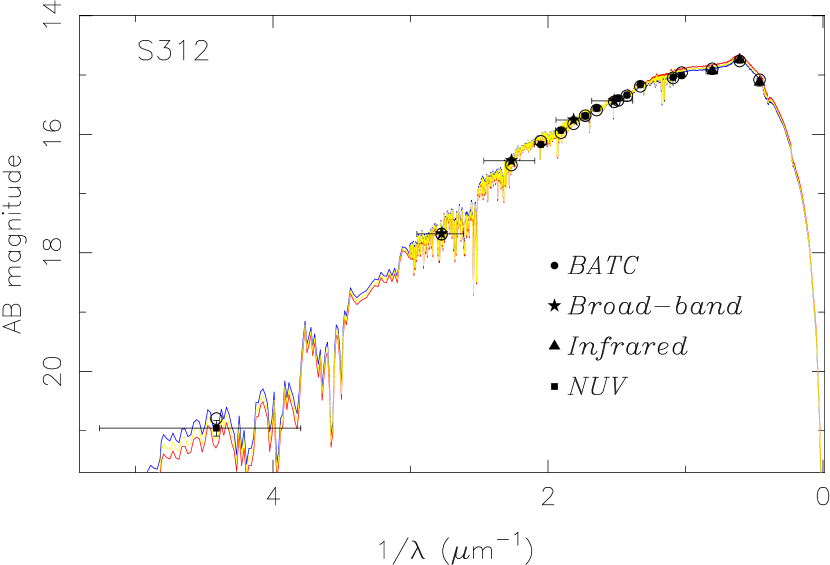
As discussed in Section 3.1, BC03 provide two sets of SSP models based on the 1994 and 2000 Padova evolutionary tracks, respectively. In Section 3.4, we adopted the SSP models based on the 1994 Padova evolutionary tracks to constrain the age of S312. However, it is interesting to show what the best fit is based on the 2000 Padova models. Using the 2000 Padova models, we fitted the intrinsic SEDs of S312 again, it is surprised that the fitting is very good with the best reduced of 9.71, but, the age of Gyr is older than 10 Gyr of Brown et al. (2004) by main-sequence photometry. In Figure 4, we plot the intrinsic SEDs of S312, the integrated SEDs of the best-fitting model and the spectra of the best-fitting model superimposed the 3-sigma spectra based on the 2000 Padova evolutionary tracks. This figure also showed that, the 3-sigma spectra deviate from best-fitting ones much. As things stand now, without having other clusters to compare, there is a problem that an SED-fitting based on the older isochrones (the 1994 Padova) constrains the age of S312 in agreement with the main-sequence turnoff fit, while the newer isochrones (the 2000 Padova) give an older age constraint of S312. These are therefore issues that one needs to keep in mind in the context of more recent input physical parameters of the 2000 Padova evolutionary tracks as indicated by Bruzual & Charlot (2003). In fact, Bruzual & Charlot (2003) have illustrated the influence of the stellar evolution prescription on the predicted photometric evolution of an SSP for solar metallicity as an example in their Figure 2, which showed models computed using the 1994 Padova, the Geneva and the 2000 Padova evolutionary tracks. From Figure 2 of Bruzual & Charlot (2003), we can see that, at late ages, the color is significantly bluer in the 2000 Padova model than in the 1994 Padova model. The reason for this is that the giant-branch temperature in the 2000 Padova tracks has not been tested against observational calibrations (see Bruzual & Charlot, 2003, and references therein). So, it is certain that an SED-fitting based on the 2000 Padova model gives an older age for S312 than the age we obtained from the 1994 Bruzual & Charlot (2003) models.
3.7. Overview of age constraint by photometry in different bands
In section 3.4, we constrain the age of S312 based on the integrated photometric measurements in GALEX NUV, broad-band , 9 intermediate-band filters of BATC and infrared of 2MASS. These photometries constitute the accurate SEDs of S312 from Å. In order to constrain the age of S312 accurately, we use as many photometric data points covering as large a wavelength range as possible. In this section, we investigate which passbands actually constrain the age. The results show that, except for NUV, a lack of any band does not result in great problems in constraining the age of S312, the dispersions in the recovered age are smaller than 0.5 Gyr. The reason may be that, for S312, whose metallicity and reddening values were published by other authors, the cluster age is the sole parameter to be constrained. If we constrain the age and metallicity of S312 simultaneously, the importance of the or will appear. As Anders et al. (2004) pointed out that, the age deviations from the input values for the combinations without the or bands are caused by an insufficiently accurate determination of the cluster metallicity, i.e. the or plays a major role in determining the metallicity. Missing or -band information leads to underestimates of metallicity, thereby causing ages to be adjusted improperly. The results also show that, a lack of NUV results in problems in constraining the age of S312, the dispersion in the recovered age is 2.5 Gyr, which reflects that the NUV flux point shows promise of being useful determination of age. A lack of all bands bluer than or of all bands redder than results in great problems in constraining the age of S312, the dispersions in the recovered age are 4.25 or 7.25 Gyr, respectively.

4. Summary and discussion
In this paper, we constrain the age of the M31 globular cluster S312 by comparing its multicolor photometry with theoretical stellar population synthesis models. This is both a check on previous results, and a check on our methodology of applying age constraints via our SEDs of stellar systems. Multicolor photometric data are from GALEX NUV, broadband , 9 intermediate-band filters and 2MASS , which constitute the SEDs covering Å. Our result is in very good agreement with the previous determination (10 Gyr) of Brown et al. (2004) main-sequence photometry. We also estimate the mass of S312, which shows that it is a medium-mass globular cluster in M31. Since no other clusters can be available to confirm our SEDs-fitting method of constraining ages of globular clusters, a large sample of globular clusters, whose ages are derived based on our SEDs-fitting method, may boost confidence in the dataset and in our SEDs-fitting method. Fan et al. (2006) obtain age constraints for 91 M31 globular clusters, based on the same sources of photometric data (not including GALEX NUV), the same theoretical stellar synthesis models and the same fitting methods. Figure 5 shows a plot of age errors (1 spread) as a function of age based on the data of Fan et al. (2006). It is clear that the absolute age errors increase significantly with increasing age, and derived ages with errors of Gyr are available for ages younger than 9 Gyr.
Fan et al. (2006) argue for peaks in the age distribution at 3 and 8 Gyr, in addition to the expected complement of Milky Way-like “old” globular clusters. While their results have considerable scatter, they show a noticeable lack of young, metal-poor globular clusters, or old and very metal-rich globular clusters, which might be consistent with an age metallicity relationship.
At the same time, the results of this paper also indicate that, despite having such good multicolor photometry, we still cannot get solid age constraints from SEDs fitting even with NUV to photometry. This has implications for attempting to learn the ages of distant cluster systems.
References
- Anders et al. (2004) Anders, P., Bissantz, N., Fritze-v. Alvensleben, U., & de Grijs, R. 2004, MNRAS, 347, 196
- Barmby et al. (2000) Barmby P., Huchra J., Brodie J., Forbes D., Schroder L., Grillmair C., 2000, AJ, 119, 727
- Barmby & Huchra (2001) Barmby, P., & Huchra, J. P. 2001, AJ, 122, 2458
- Barmby et al. (2002) Barmby, P., Perrett, K. M., & Bridges, T. J. 2002, MNRAS, 329, 461
- Battistini et al. (1987) Battistini, P., Bonoli, F., Braccesi, A., Federici, L., Fusi Pecci, F., Marano, B., & Börngen, F. 1987, A&AS, 67, 447
- Bertelli et al. (1994) Bertelli, G., Bressan, A., Chiosi, C., Fagotto, F., & Nasi, E. 1994, A&AS, 106, 275
- Brown et al. (2004) Brown, T. M., et al. 2004, ApJ, 613, L125
- Bruzual & Charlot (1993) Bruzual, A. G., & Charlot, S. 1993, ApJ, 405, 538
- Bruzual & Charlot (1996) Bruzual, A. G., & Charlot, S. 1996, unpublished
- Bruzual & Charlot (2003) Bruzual, A. G., & Charlot, S. 2003, MNRAS, 344, 1000
- Cardelli et al. (1989) Cardelli, J. A., Clayton, G. C., & Mathis, J. S. 1989, ApJ, 345, 245
- Cardiel et al. (2003) Cardiel, N., Gorgas, J., Sánchez-Blázquez, P., Cenarro, A. J., Pedraz, S., Bruzual, A. G., & Klement, J. 2003, A&A, 409, 511
- Chabrier (2003) Chabrier, G. 2003, PASP, 115, 763
- Charlot et al. (1996) Charlot, S., Worthey, G., & Bressan, A. 1996, ApJ, 457, 625
- de Jong (1996) de Jong, R. S. 1996, A&A, 313, 377
- Fan et al. (1996) Fan, X., et al. 1996, AJ, 112, 628
- Fan et al. (2006) Fan, Z., Ma, J., de Grijs, R., Yang Y., & Zhou X. 2006, MNRAS, 371, 1648
- Galleti et al. (2004) Galleti, S., Federici, L., Bellazzini, M., Fusi Pecci, F., & Macrina, S. 2004, A&A, 426, 917
- Holland et al. (1997) Holland, S., Fahlman, G. G., & Richer, H. B. 1997, AJ, 114, 1488
- Huchra et al. (1991) Huchra, J. P., Brodie, J. P., & Kent, S. M. 1991, ApJ, 370, 495
- Kissler-Patig et al. (2002) Kissler-Patig, M., Brodie, J. P., & Minniti, D. 2002, A&A, 391, 441
- Ma et al. (2006) Ma, J., de Grijs, R., Yang, Y., Zhou, X., Chen, J., Jiang, Z., Wu, Z., & Wu, J. 2006, MNRAS, 368, 1443
- MacArthur et al. (2004) MacArthur, L. A., Courteau, S., Bell, E., & Holtzman, J. A. 2004, ApJS, 152, 175
- Meylan et al. (2001) Meylan, G., Sarajedini, A., Jablonka, P., Djorgovski, S. G., Bridges, T., & Rich, R. M. 2001, AJ, 122, 830
- Meylan (2002) Meylan, G. 2002, in: Extragalactic Star Clusters, Geisler, D., Grevel, E. K., & Minniti, D., eds., (ASP: San Francisco), IAUS, 207, 555
- Oke & Gunn (1983) Oke, J. B., & Gunn, J. E. 1983, ApJ, 266, 713
- Puzia et al. (2002a) Puzia, T. H., Saglia, R. P., Kissler-Patig, M., Maraston, C., Greggio, L., Renzini, A., & Ortolani, S. 2002a, A&A, 395, 45
- Puzia et al. (2002b) Puzia, T. H., Zepf, S. E., Kissler-Patig, M., Hilker, M., Minniti, D., & Goudfrooij, P. 2002b, A&A, 391, 453
- Rey et al. (2005) Rey, S.-C., et al. 2005, ApJ, 619, L119
- Rey et al. (2006) Rey, S.-C., et al. 2006, ApJS, in press (astro-ph/0612203)
- Rich et al. (2001) Rich, R. M., Shara, M. M., & Zurek, D. 2001, AJ, 122, 842
- Reed, Harris & Harris (1994) Reed, L. G., Harris, G. L. H., & Harris, W. E. 1994, AJ, 107, 555
- Salpeter (1955) Salpeter, E. E. 1955, ApJ, 121, 161
- Sargent et al. (1977) Sargent, W. L. W., Kowal, C. T., Hartwick, F. D. A., & van den Bergh, S. 1977, AJ, 82, 947
- Searle (1973) Searle, L., Sargent, W. L. W., & Bagnuolo, W. G. 1973, ApJ, 179, 427
- Sharov (1973) Sharov, A. S. 1973, SvAL, 17, 174
- Stetson (1987) Stetson, P. B. 1987, PASP, 99, 191
- Tinsley (1968) Tinsley, B. M. 1968, ApJ, 151, 547
- Tinsley (1972) Tinsley, B. M. 1972, ApJ, 178, 319
- VandenBerg et al. (2006) VandenBerg, D. A., Bergbusch, P. A., & Dowler, P. D. 2006, ApJS, 162, 375
- Worthey (1994) Worthey, G. 1994, ApJS, 95, 107
- Wu et al. (2005) Wu, H., Shao, Z. Y., Mo, H. J., Xia, X. Y., & Deng, Z. G. 2005, ApJ, 622, 244
- Yan et al. (2000) Yan, H. J., et al. 2000, PASP, 112, 691
- Zheng et al. (1999) Zheng, Z. Y., et al. 1999, AJ, 117, 2757
| Filter | (Å) | FWHM(Å) | Magnitude | |
|---|---|---|---|---|
| 4925 | 390 | 11 | 17.81(0.021) | |
| 5270 | 340 | 12 | 17.23(0.016) | |
| 5795 | 310 | 7 | 16.40(0.012) | |
| 6075 | 310 | 5 | 16.14(0.009) | |
| 6656 | 480 | 3 | 15.54(0.007) | |
| 7057 | 300 | 12 | 15.25(0.006) | |
| 7546 | 330 | 6 | 14.89(0.006) | |
| 9182 | 260 | 18 | 13.95(0.004) | |
| 9739 | 270 | 12 | 13.78(0.005) |
a is the number of images taken by the BATC telescope.