The XMM-Newton wide-field survey in the COSMOS field.
IV: X-ray spectral properties of Active Galactic Nuclei.
Abstract
We present a detailed spectral analysis of point-like X-ray sources in the XMM-COSMOS field. Our sample of 135 sources only includes those that have more than 100 net counts in the 0.3-10 keV energy band and have been identified through optical spectroscopy. The majority of the sources are well described by a simple power-law model with either no absorption () or a significant intrinsic, absorbing column (). The remaining of the sources require a more complex modeling by incorporating additional components to the power-law. For sources with more than 180 net counts (bright sample), we allowed both the photon spectral index and the equivalent hydrogen column NH to be free parameters. For fainter sources, we fix to the average value and allow NH to vary. The mean spectral index of the 82 sources in the bright sample is , with an intrinsic dispersion of . Each of these sources have fractional errors on the value of below . As expected, the distribution of intrinsic absorbing column densities is markedly different between AGN with or without broad optical emission lines. We find within our sample four Type-2 QSOs candidates (L erg s-1, N cm-2), with a spectral energy distribution well reproduced by a composite Seyfert-2 spectrum, that demonstrates the strength of the wide field XMM/COSMOS survey to detect these rare and underrepresented sources. In addition, we have identified a Compton-thick (N cm-2) AGN at z=0.1248. Its X-ray spectrum is well fitted by a pure reflection model and a significant Fe K line at rest-frame energy of 6.4 keV.
Subject headings:
Surveys – Galaxies: active — X-rays: galaxies – X–rays: general – X–rays:diffuse background1. Introduction
Deep pencil-beam surveys with ROSAT (Hasinger et al., 1998), Chandra (Brandt et al., 2001; Rosati et al., 2002; Cowie et al., 2002; Alexander et al., 2003) and XMM-Newton (Hasinger et al., 2001; Loaring et al., 2005) have proved that the majority
of the X-ray background (XRB) is generated by Active Galactic Nuclei
(AGN) both in the soft (0.5-2 keV) and hard (2-10 keV) band. At fluxes
below erg cm-2 s-1 in the hard band, the
X-ray source population in these surveys is mainly composed of
obscured AGN. This supports the suggestion by Setti & Woltjer (1989) that the
spectral shape of the XRB is due to the integrated contribution of AGN
affected by photoelectric obscuration with a wide range of gas column
density (NH) and redshifts. Since the resolved fraction of
the XRB drops from at keV to at
keV (Worsley et al., 2004), a sizable number of strongly absorbed
AGN may still be missing in the X-ray surveys. An alternative method
to detect heavily absorbed AGN is to select objects that have mid-IR
and radio emission typical of AGN though faint near-IR and optical
fluxes (Martinez-Sansigre et al., 2005). While this kind of study cannot quantify
which fraction of these mid-IR selected, absorbed AGN would be
detected by X-ray selection, the COSMOS survey (Scoville et al., 2007) will
be able to answer this question due to its rich multi-wavelength
coverage (from radio to X-ray) on a large area of the sky (2
deg2).
The XMM-Newton wide-field survey in the COSMOS field
(XMM-COSMOS, Hasinger et al. 2007), with an unprecedented combination
of wide area coverage and high sensitivity, is providing a large
number of AGN with enough counts to perform a detailed study of their
X-ray spectra. This spectral information, particularly the NH
distribution, is a fundamental input parameter to model the XRB
(e.g. Comastri et al. 1995; Gilli et al. 2001). While we anticipate the
completion of the multi-wavelength campaigns including the optical
spectroscopic follow-up within the next few years, we report in this
paper the X-ray spectral fitting results for a preliminary sample of
spectroscopically-identified X-ray sources. The paper is structured as
follows: in §2 we describe the sample selected on the basis of counts
statistics and optical identification; in §3 we describe our X-ray
spectral extraction procedure, in §4 we present the results of the
X-ray spectral analysis, in §5 we discuss the properties of four
Type-2 QSOs, in §6 we compare the X-ray and optical classification,
and finally we summarize our conclusions in §7.
Throughout the
paper we assume km s-1 Mpc-1, =0.3 and
=0.7.

2. Sample selection
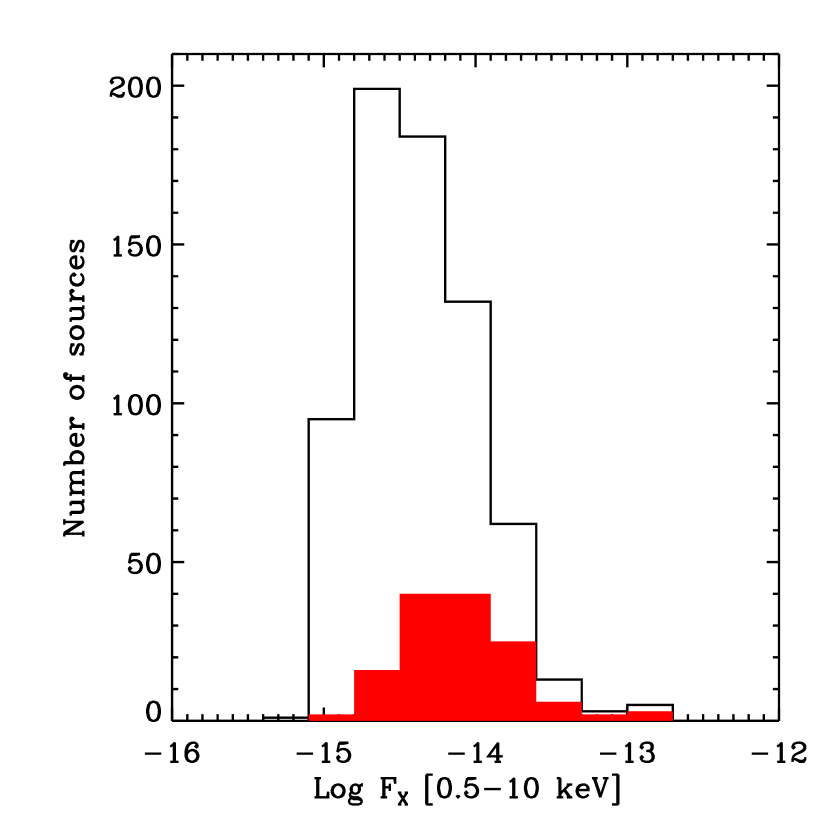
XMM- has imaged the full 2 deg2 of the COSMOS area down to the following flux limits in the respective energy bands: erg cm-2 s-1 [0.5-2 keV], erg cm-2 s-1 [2-10 keV] and erg cm-2 s-1 [5-10 keV] (see Fig. 7 of Cappelluti et al. 2007 for details on the sky coverage as a function of the X-ray flux). A general outline of the survey can be found in Hasinger et al. (2007). Further details such as the point-source detection method and sky area coverage as a function of the X-ray flux are presented in Cappelluti et al. (2007). Our sample is based on the X-ray catalogue of 1390 point-like sources (Cappelluti et al., 2007). We limit our analysis to the sources detected with the EPIC pnCCD (pn) camera (Strüder et al., 2001), in the first 12 XMM-COSMOS observations since optical spectroscopic follow-up (Trump et al., 2007; Lilly et al., 2007) has been concentrated in this area ( deg2). These 12 fields are flagged in Table 1 of Hasinger et al. (2007). Reliable optical counterparts (Brusa et al., 2007) have been determined for of the sources in these 12 fields. We exclude 20 of the 715 X-ray sources in this area that are classified as “extended” from the detection algorithm. The observed X–ray emission from these sources is likely to be due to a group or cluster of galaxies, while here we are interested in selecting AGN. From the remaining 695 X–ray sources, we select sources with greater than 100 net counts in the [0.3-10] keV energy band and optical spectroscopic identification. We further remove one source that has been identified as a star (Trump et al., 2007). The final sample comprises 135 objects. We show the distribution of their net counts in the [0.3-10] keV band in Figure 1 and the [0.5-10] keV flux distribution (Figure 2) that covers a range of , erg cm-2 s-1. From their optical spectra, we can further subdivide our sample based on the presence of broad emission lines: ’Broad Line AGN’ (BL AGN, 86 objects; FWHM2000 km s-1), ’NON-Broad Line AGN’ (NON-BLAGN, 49 objects; FWHM2000 km s-1). We note that in this latter class there are objects showing clear signs of nuclear activity such as high excitation emission lines, as well as sources with normal galaxy spectra. We compare this purely optical classification with the X-ray properties of our sources in Sec. 6.
3. Extraction of X-ray spectral products
We have implemented an automated procedure to produce the X-ray spectrum for each source by combining counts from individual exposures. We have used the latest release of the XMM-Newton Science Analysis System (SAS)111http://xmm.vilspa.esa.es/external/xmm_sw_cal/sas_frame.shtml software package (v 7.0). The task region has been used to generate the source and background extraction regions. The source region is defined as a circle with radius rs that varies according to the signal-to-noise and the off-axis angle of the detection to optimize the quality of the final spectrum. The radii of these regions are reduced by the task to avoid overlapping with the extraction regions of nearby sources. All source regions are further excised from the area used for the background measurement. The task especget has been used to extract from the event file the source and background spectra for each object. The same task generates the calibration matrices (i.e. arf and rmf) for each spectrum and determines the size of the source and background areas while updating the keyword BACKSCAL in the header of the spectra appropriately222The header keyword BACKSCAL is set to 1 for the source spectrum while for the background spectrum it is fixed to the ratio between the background to source areas.. The single pointing spectra have been combined with mathpha to generate the spectrum of the whole observation.333We note that all the XMM-Newton observations in the COSMOS field have been performed with the thin filter for the pn camera. For each source in our sample, we use all the available counts from the XMM-COSMOS observations, including those coming from overlapping fields not included in the 12 fields list (see Fig.1 Hasinger et al. 2007). Finally, in order to use the minimization technique, we bin the spectra with grppha so that each bin has at least 20 counts.
4. Spectral analysis
| XID | countsaaNet pn counts in the [0.3-10] keV energy range. | ModelbbBest fit model: APL+po=absorbed power-law plus an extra power-law for the soft excess; APL+bb=absorbed power-law plus a blackbody for the soft excess. | ccSlope of the powerlaw model (photon index). | NHdd of the intrinsic absorption (cm-2). | kTeeTemperature (in eV) of the blackbody used to model the soft excess. | ffSlope of the extra power-law used to model the soft excess. | Redshift | Opt. classggOptical classification, see Sec. 6 for details. | |
|---|---|---|---|---|---|---|---|---|---|
| 41 | 315 | APL+po | 0.94 | 1.72 | 21.38 | 2.0 | 0.114 | NLAGN | |
| APL+bb | 0.83 | 1.95 | 21.51 | 30 | |||||
| 106 | 141 | APL+po | 0.25 | 2.0 | 22.33 | 2.0 | 0.710 | gal | |
| APL+bb | 0.26 | 2.0 | 22.28 | 121 | |||||
| 117 | 111 | APL+po | 0.69 | 2.0 | 22.76 | 2.0 | 0.936 | gal | |
| APL+bb | 0.59 | 2.0 | 22.57 | 81 | |||||
| 274 | 112 | APL+po | 0.26 | 2.0 | 22.67 | 2.0 | 0.677 | gal | |
| APL+bb | 0.24 | 2.0 | 22.55 | 124 |
Tozzi et al. (2006) have shown by extensive simulations that below 50
counts the best fit values obtained using Cash statistics
(Cash, 1979) are more accurate than those obtained with the . For greater than 50 counts, the two methods give equivalent
results. Since we limit our analysis in this paper to sources with
more than 100 counts, we are confident that the results obtained with
the minimization technique are accurate. We use
XSPEC444http://heasarc.gsfc.nasa.gov/docs/xanadu/xspec/
(v11.3.2p) for our spectral fitting analysis. We first fit the data
with two basic input models: a simple powerlaw (PL) and a
powerlaw modified by intrinsic absorption at the redshift of the
source (APL). Both models include an additional component to
account for photoelectric absorption due to the Galactic column
density that is fixed to the value in the COSMOS region (N cm-2, Dickey & Lockman 1990)555This is an
average value for the Galactic NH in the COSMOS area where
N is in the range [2.5-2.9]
cm-2. This range in Galactic column density does not affect the
results of our spectral analysis.. The PL model is made of two
XSPEC components wabs*zpowerlw, while the APL model consists of
the combination of three different components wabs*zwabs*zpowerlw. The wabs model describes the photoelectric
absorption using Wisconsin cross-sections (Morrison & McCammon, 1983) and its
only parameter is the equivalent hydrogen column density (zwabs
has the redshift as an additional parameter). zpowerlw is a
simple power law parameterized by the photon index, the redshift and a
normalization factor.666 We refer the reader to
http://heasarc.gsfc.nasa.gov/docs/xanadu/xspec/ for further details on
the spectral models. The model fits yield the power-law photon index
, the X-ray luminosity in the [0.5-2] and [2-10] keV
rest-frame bands, and from the APL model also the intrinsic
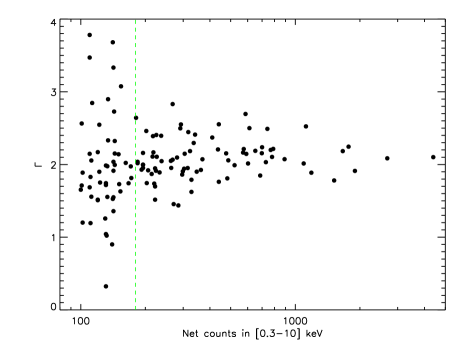
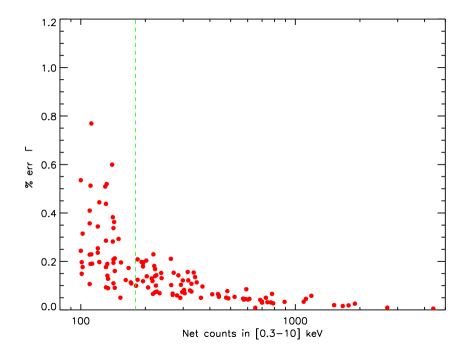
column density . We notice that the dispersion of
for our sample increases significantly for sources with low counts
statistics (Fig. 3, left panel) and in particular the
fractional error becomes quite large (Fig.
3, right panel). Above 180 net counts, the fractional
error remains below . Hence, we split our sample in two: sample-1 including 82 sources with more than 180 net counts, and sample-2 having 53 sources with less than 180 counts. For sample-1, we allow both and free to vary, while
we fix to the average value, obtained with sample-1,
for lower count sources (sample-2).
For all the 135 X-ray
sources, we perform a spectral fit using both PL and APL
models. We label a source as X-ray absorbed in those cases for which
the APL model is a better fit, than the pure PL, with a
confidence level threshold of based on an F-test.
The
output of our spectral analysis is reported in
Tab. 4. The table has the following structure: IAU
name (col.1), identification number (xid, col.2), X-ray coordinates
(col.3-4), net detected X-ray counts in the [0.3-10] keV band
(col. 5), spectroscopic redshift (col. 6), best fit model (col. 7),
spectral index (col. 8), intrinsic column density NH
(col. 9), X-ray fluxes (col. 10-11-12), de-absorbed X-ray luminosities
(col. 13-14-15).
4.1. Notes on some individual sources
For each source we carefully check the results obtained with the basic PL and APL models and, if significant residuals are present, we refine the fit using more complex models. We show in Fig. 4 a representative X-ray spectrum for each one of the different best-fit models. We use the F-test and a confidence level threshold of to choose between the different models.
4.1.1 Soft excess
A clear soft excess is present in four of our sources (xid 41, 106, 117, 274). This feature, first observed with EXOSAT (Arnaud et al., 1985; Turner & Pounds, 1989), has been confirmed by XMM-Newton observations (e.g. Pounds & Reeves 2002; Porquet et al. 2004; Gallo et al. 2006), but its origin is still uncertain. Such a soft component may be the high energy tail of the UV bump (a blackbody model is appropriate in this case), or can be due to reprocessed emission scattered along our line of sight by a photo-ionized gas located just above the obscuring torus (an additional power-law with the spectral index fixed to the value of the hard X-ray primary power-law is a good parameterization of this scenario). We fit these four sources adding to the basic APL model an extra component represented either by a power-law (po) or a blackbody (bb777This is a blackbody spectrum defined by the temperature kT in keV and a normalization factor.) according to the two physical scenarios mentioned above. We report in Tab. 1 the parameters of the additional component in the fit of these four sources. We are not able to distinguish on a statistical basis between the two models given the similar values of . Nevertheless, we notice that all these four sources present intrinsic absorption and therefore we exclude that the soft-excess of these objects is due to the high energy tail of the UV bump (APL+bb).
| XID | aaObserved width of the line in eV. | EWbbRest frame equivalent width of the line in eV | Redshift | Opt. classccOptical classification, see Sec. 6 for details. |
|---|---|---|---|---|
| 2028 | 616 | 2754 | 0.784 | gal |
| 2043 | 179 | 748 | 0.668 | gal |
| 2608 | 0.125 | gal |


4.1.2 Fe K line
Three sources show significant features ascribable to the redshifted Fe K emission line: xid 2028, 2043, 2608. For these sources we add a Gaussian component (gauss) to the model, fixing the line energy to keV. The best fit values of interesting parameters are reported in Tab. 2. We show in Fig. 5 the ratio of the data versus the model (powerlaw for xid 2028, 2043 and pexrav888An exponentially cut off power law spectrum reflected from neutral material. We refer the reader to Magdziarz & Zdziarski (1995) for a detailed description of such model. for xid 2608) in an energy range around the expected location of the Fe K line. Interestingly all three of these sources do not show sign of AGN activity from their optical spectra and are therefore classified as ’galaxy’.
4.1.3 Thermal emission?
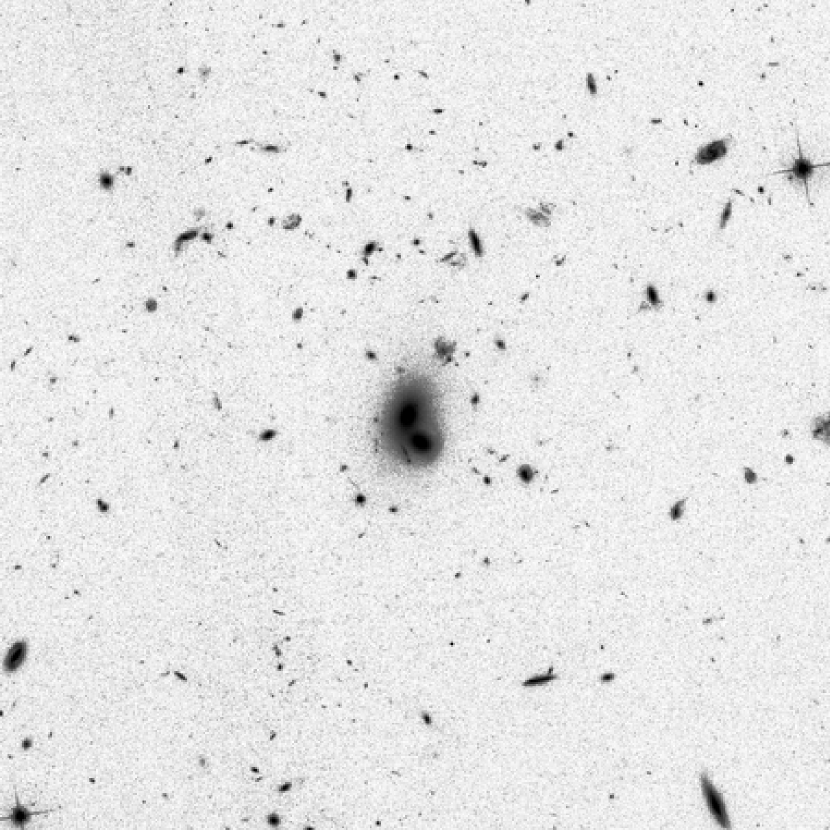
Source xid 54, if fitted with an APL model, gives a large value for the spectral slope () and significant residuals in the 0.3-10 keV energy range. An alternative description of its spectrum is obtained assuming we are observing thermal emission, parameterized with a Raymond-Smith model (Raymond & Smith, 1977) with a temperature kT keV fixing the metalicity to solar. Source xid 54 is identified with two interacting galaxies (see Fig. 6) at redshift z with no sign of AGN activity from its optical spectrum. Its X-ray luminosity of erg s-1 is larger than that expected for early-type galaxies (Matsushita et al., 2001) and, from the optical imaging, there is a concentration of galaxies around xid 54 with the same photometric redshifts therefore supporting the idea that we are looking at the X-ray emission from a group of galaxies. Nevertheless, we can not exclude with the current data that a fraction of the X-ray flux of source 54 could come from an absorbed nucleus (e.g XBONGS, Comastri et al. 2002) or from discrete sources like LMXBs or HMXBs in the galaxy. A Chandra observation with its higher angular resolution could possibly locate discrete sources inside xid 54.
4.1.4 XID=2608 : a Compton-thick AGN?
An additional source that requires a more complex modeling of its spectrum is xid 2608. The fit with the APL model gives an extremely flat value for () and large residuals at both low and high energies (see left panel of Fig. 7). Hasinger et al. (2007) found that this source is located in an area populated by local Compton-thick Seyfert-2 galaxies in an X-ray color-color diagram (see Fig. 12 of Guainazzi et al. 2005). This, together with other evidences based on lines ratios from the optical spectrum, supports the hypothesis that source 2608 is a heavily absorbed AGN.
We use the 131 net counts from the pn camera for this source to study
more in detail its X-ray spectrum. A pure reflection component model
(pexrav) is a better description compared to the APL model
according to an F-test with a confidence level of . Nevertheless
this fit leaves a clear residual around the expected position of the
6.4 keV Fe K line. The best-fit model for xid 2608 is a pure
reflection model plus a Gaussian line at 6.4 keV rest-frame (pexrav + gauss). The details for the different spectral fits are
reported in Tab. 3. The presence of the Fe K
fluorescent line at 6.4 keV is significant at according to an
F-test. The presence of the line is a clear sign that the source is
heavily absorbed, but a useful observable to confirm its Compton-thick
nature is the Equivalent Width (EW) of the same line. The nominal best
fit value for the EW ( eV) is higher than the
maximum (600 eV) observed EW in Compton-thin objects
(Turner et al., 1997). This supports the idea that source 2608 is a
Compton-thick AGN, although we have to mention that with the current
photons statistics, the error for the observed flux of the line ( and
consequently for the EW) is still large. We are confident that an
improved result will come after the completion of the additional 600
ksec XMM observations awarded in AO4.
Another diagnostic on the
Compton-thick nature of this source could be the thickness
parameter TF[2-10keV]/F[OIII]. A high quality optical spectrum
for this source is available in the Sloan Digital Sky Survey archive
and we obtain a value for F[OIII] from the analysis of
Kauffmann et al. (2003). The [OIII] flux has been corrected for the
extinction toward the narrow-line region as deduced from the Balmer
decrement. We obtain T which is in a “grey area” where both
Compton thick and less absorbed AGN are located (see for example Fig.
1 of Bassani et al. 1999).


In Fig. 13, we assume as a lower limit for the column density of xid 2608 the value cm-2 where the Compton optical depth is equal to unity and the directly transmitted nuclear emission is strongly suppressed in the [0.3-10] keV band. For the luminosity of this object, if we assume that only of the flux has been reflected, we obtain a value of erg s-1, while for reflected fractions between the luminosity would be in the range erg s-1.
| ModelaaBest fit model: APL = absorbed power-law; pexrav = pure reflection model; pexrav+gauss = pure reflection model plus a Gaussian line. | NHbbHydrogen column density in unit of cm-2. | EWccEquivalent width of the Fe K line expressed in eV. | d.o.f. | ||
|---|---|---|---|---|---|
| APL | 2.0 | 9.3 | 11 | ||
| pexrav | 2.0 | 4.1 | 9 | ||
| pexrav+gauss | 2.0 | 1.7 | 7 |


4.2. Spectral properties of the sample
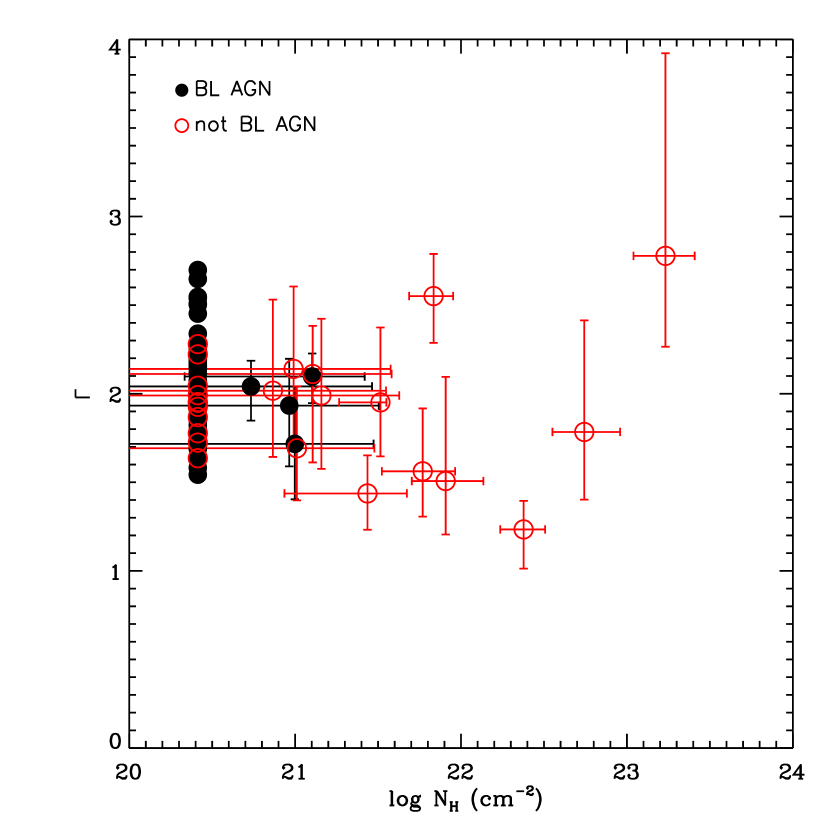
As mentioned in Sec. 4, we leave both and NH free to vary when fitting the sources in sample-1. The results of this analysis are summarized in Fig. 8. The average value of does not change as a function of NH as already noticed in deep surveys (i.e. Mainieri et al. 2002). We obtain, using the weighted mean, and the observed dispersion of the distribution of the best fit values is . As the typical error in a single measurement of is , assuming that both statistical errors and the intrinsic dispersion are distributed as a Gaussian, the intrinsic scatter in is . For comparison with X-ray spectral studies in a similar X-ray flux range of our sample, Mateos et al. (2005a) from a large sample of serendipitous sources detected with XMM-Newton in a deg2 area, obtained ; Perola et al. (2004) in the spectroscopic analysis of the HELLAS2XMM 1df found ; Page et al. (2006) from the spectral fit of AGN in the XMM-Newton/Chandra deep field found with an intrinsic dispersion . All these measurements are consistent with each other within the uncertainties. Adopting the optical classification described in Sec. 2 the mean value for the spectral slope for BLAGN (58 sources) is with a dispersion of , while for not BLAGN (24 sources) we obtain and . Furthermore, we confirm that the average value of the photon index does not vary with redshift in the range z=[0.0,3.0] covered by our sample, thus confirming previous findings (e.g. see Fig. 9 of Piconcelli et al. (2003) for a compilation from the literature)
The other physical quantity that we measure from the spectral fitting
is the column density NH. In this case, we consider all our
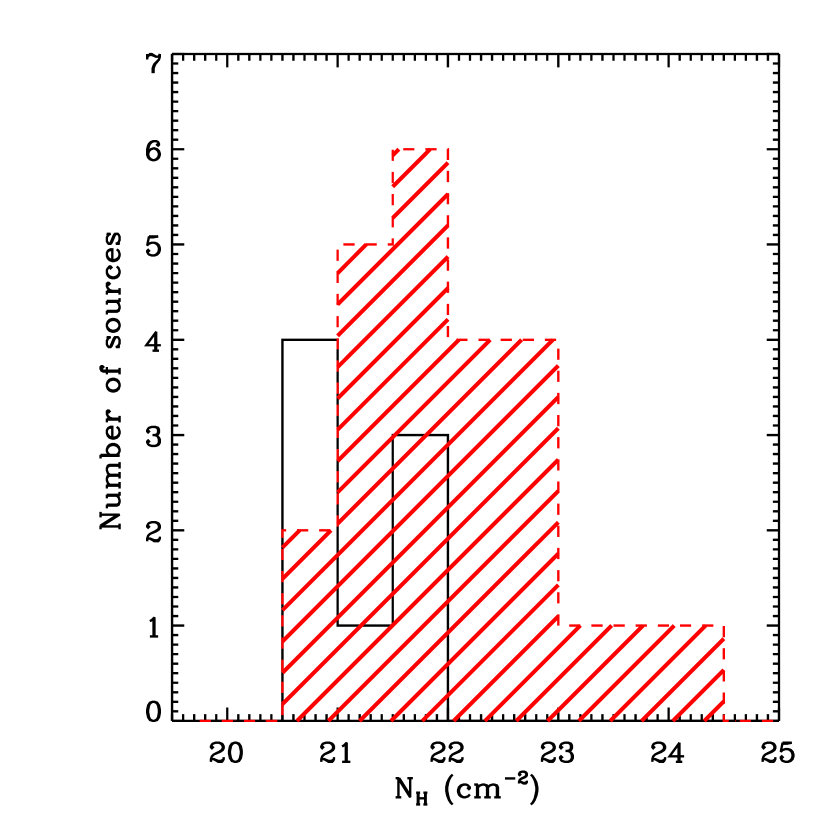
135 sources since NH has been left free to vary both in sample-1 and sample-2. According to an F-test, 32 X-ray
sources do require intrinsic absorption in excess to the Galactic one,
at a confidence level larger than . Therefore a fraction as
large as of our sample is made of X-ray absorbed AGN. Fig.
9 shows the distribution of NH values for these
sources. We note that the observed NH distribution
refers only to the sources inside the region in the NH-LX-z space delimited by the count-rate detection
threshold of our survey. This introduces a bias against absorbed
sources, and therefore the fraction of absorbed sources detected in
our study has to be considered a lower limit. According to the most
recent population synthesis model of the XRB (Gilli et al., 2006), in the
band used to select our sample the expected fraction of obscured
source with column density N cm-2 is
that is consistent with what we found. In Fig. 9 we
divide BL AGN from NOT BL AGN. The visual impression that NOT BL AGN
have larger column densities than BL AGN is confirmed by a
Kolmogorov-Smirnov test that gives a probability larger than
that the two distributions are different. No object with N cm-2 shows broad lines in its optical spectrum.
Nevertheless, (8/86) of the BL AGN in our sample do show some
intrinsic absorption in their X-ray spectra (see also
Mittaz et al. 1999; Fiore et al. 2001; Page et al. 2001; Schartel et al. 2001; Tozzi et al. 2001; Mainieri et al. 2002; Brusa et al. 2003; Perola et al. 2004; Mateos et al. 2005b).
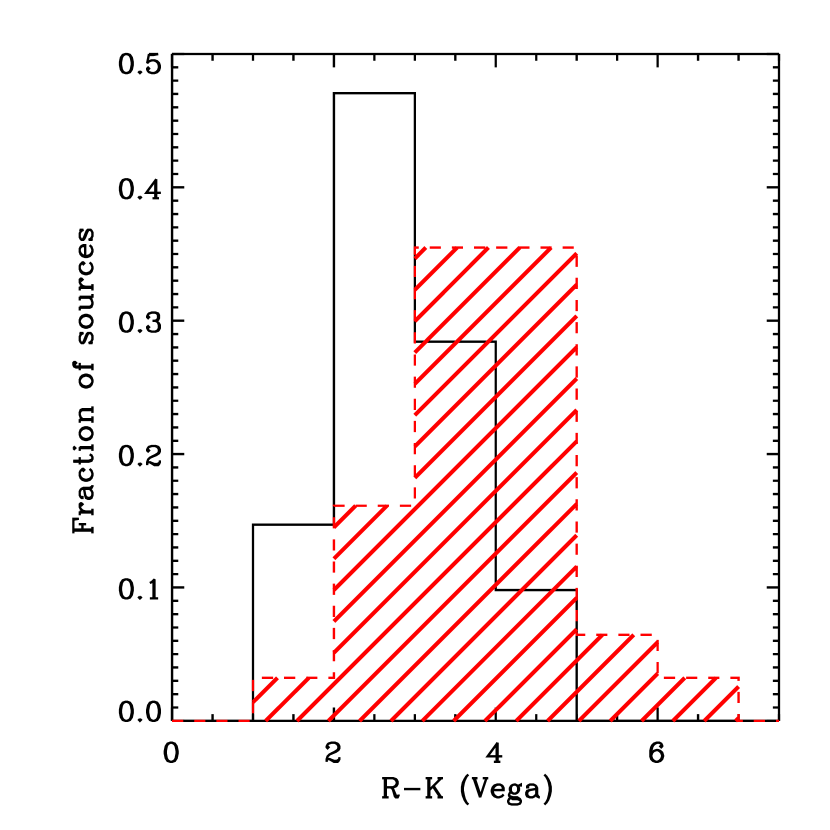
In Fig 10 we show the distributions of the R-K (Vega)
colors for the sources with ’PL’ as best fit model (empty histogram)
and for the ones that instead require an absorbed power-law (hatched
histogram). The two distributions are significantly different according
to a Kolmogorov-Smirnov test with a probability of . The
X-ray sources that require an absorption component in their spectral
fit are on average redder, suggesting a correlation between X-ray
absorption and optical to near-IR colors. On the contrary, sources
that do not show absorption in their X-ray spectra have bluer color
typical of optically selected, unobscured quasars. These results
confirm those obtained from an analysis based on HR values made by
Brusa et al. (2007) (see their Fig. 10). Nevertheless the interpretation
of this correlation between X-ray absorption and optical to near-IR
colors is not straightforward since we are sampling different scales
in the two measurements (i.e. nucleus with the X-ray data and
nucleushost galaxy with the R-K colors).
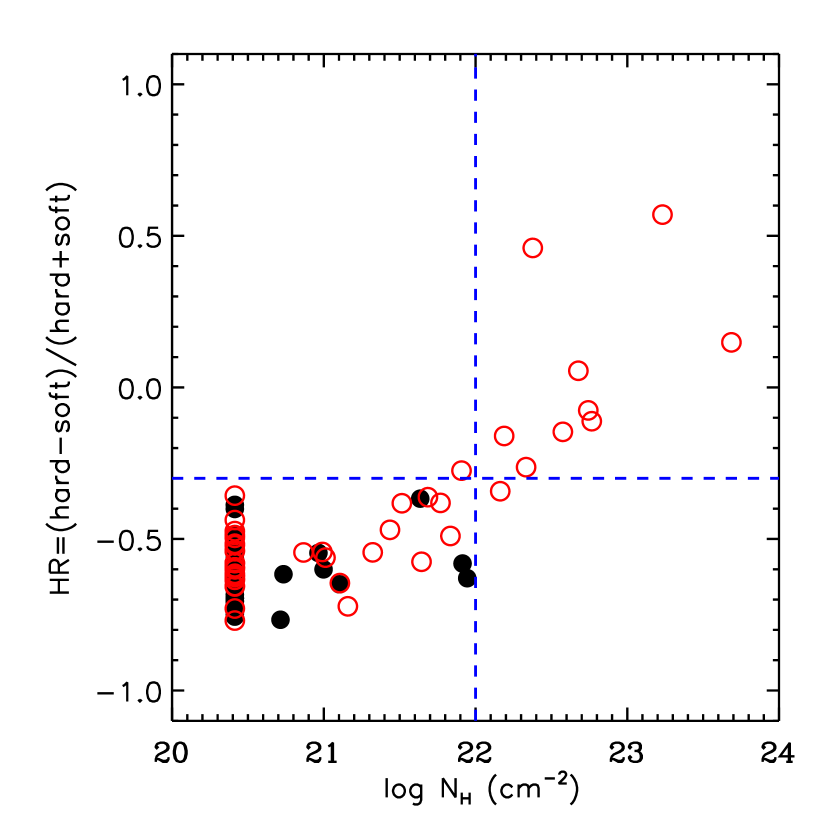
When the number of counts in a source is inadequate to perform a spectral fit, a widely used tool to study the general spectral properties of an X-ray source is the hardness ratio , where H are the counts in the [2-4.5] keV band and S those in the [0.5-2] keV energy band. In Fig. 11 we show the hardness ratio values versus the amount of intrinsic absorption derived from our spectral analysis (both sample-1 and sample-2). A clear correlation between the two quantities is present: 999We note that the only source with N cm-2 and HR shows a soft excess in its X-ray spectrum. of the sources with N cm-2 have HR and of the sources with N cm-2 have HR. Therefore, although one has to remember that the HR is a strong function of redshift (e.g. Fig. 8 in Szokoly et al. 2004), it is still possible to use HR for statistical studies.
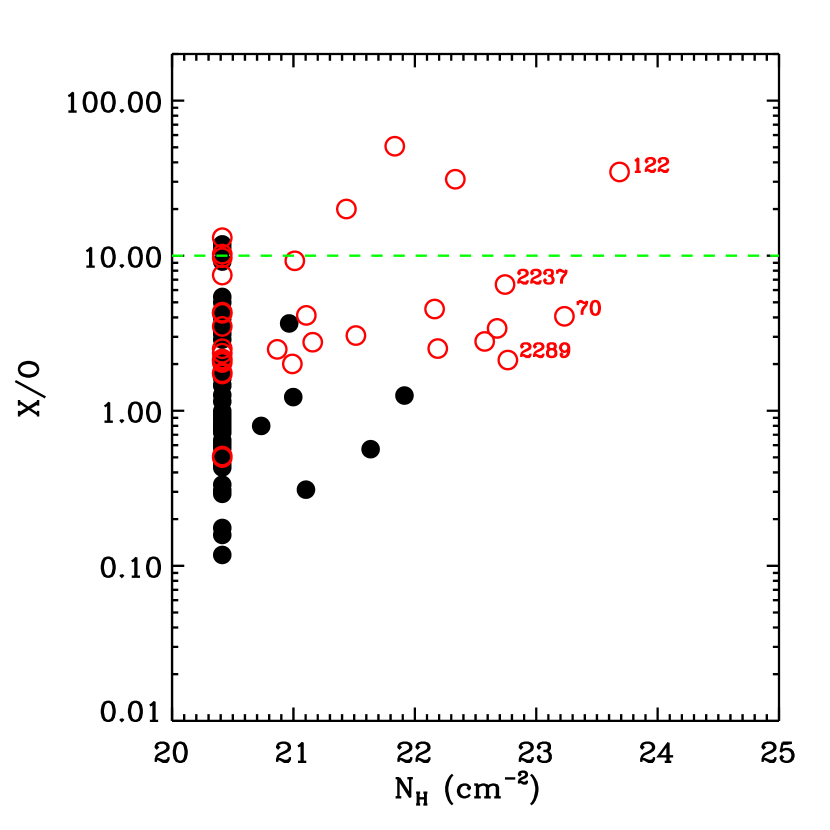
Another diagnostic that can yield important information on the nature of X-ray sources is the X-ray-to–optical flux ratio (e.g., Maccacaro et al. 1988; Stocke et al. 1991). The majority of the AGN have X-ray-to-optical flux ratios (X/O) of X/O (e.g., Akiyama et al. 2000; Lehmann et al. 2001), but Chandra and XMM-Newton surveys have shown that there is a non negligible population of AGN with high X/O () and that a large fraction of them are obscured, and possibly high-redshift, Type-2 QSOs (e.g., Fabian et al. 2000; Mainieri et al. 2002; Fiore et al. 2003; Mignoli et al. 2004; Mainieri et al. 2005). For comparison with the literature, we define X/O as the ratio between the X-ray flux in the [2-10] keV band and the flux in the optical R band. In Fig. 12 we plot the X/O values for the sources in our sample versus the NH. Out of the seven sources that have X/O, four show absorption in their X-ray spectra (APL) and one is a Type-2 QSO. We notice that the other three Type-2 QSO candidates in our sample (see Sec. 5) have X/O values inside the range X/O where most of the optical or soft X-ray selected AGN are located. Since we limit our analysis to the brighter X-ray sources and the spectroscopic follow-up is not complete, we postpone any further analysis on the nature of X/O sources to a future paper.
5. Type-2 QSO candidates
Using the spectral parameters from the best-fit model, we correct
the X-ray luminosity of each source for the intrinsic and Galactic
absorption. These corrected luminosities are plotted in Fig.
13 versus the NH for all the sources in our sample.
Four objects are characterized by a high X-ray luminosity (L erg s-1) and substantial absorption
(N cm-2) and we can therefore classify them
as Type-2 QSOs. Radio-loud Type-2 QSOs are known since long times
thanks to radio surveys (see McCarthy 1993 for a comprehensive
review), while radio-quiet Type-2 QSOs have been observed only
recently in Chandra and XMM-Newton X-ray surveys
(Dawson et al., 2001; Norman et al., 2002; Mainieri et al., 2002; Stern et al., 2002; Della Ceca et al., 2003; Fiore et al., 2003; Tozzi et al., 2006)
and optical surveys (SDSS, Zakamska et al. 2003). Two of our Type-2
QSOs candidates, xid, are clearly detected in the radio at
20 cm using the Very Large Array (VLA) with an integrated flux of
and microJy respectively
(Schinnerer et al., 2007). The radio power of these two sources is therefore
P and
W/Hz. Historically such radio power has been used to divide radio loud
and radio quiet AGN but such a dividing line appears to be redshift
dependent: W/Hz for the Palomar Green
sample (mainly below ) up to W/Hz for the
Large Bright Quasar Survey sample (). Since our two
sources are at z, we suggest to classify them as radio
quiet AGN. The other two objects (xid) are not detected
in the radio and we can fix a 4.5 upper limit to their radio
flux of 50 and 54 microJy
(Schinnerer et al., 2007).
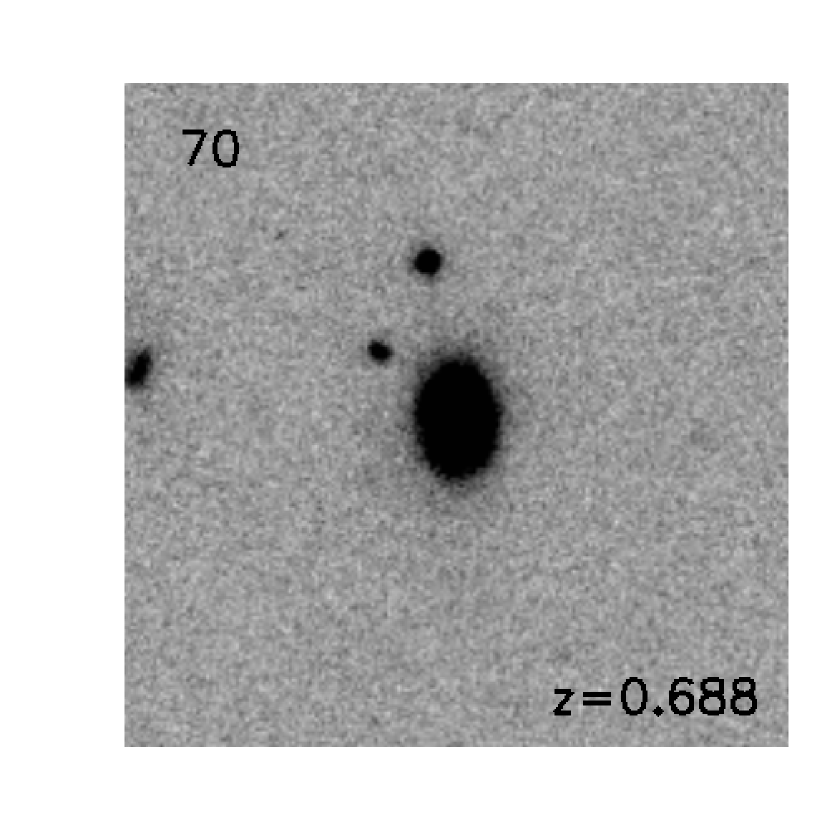
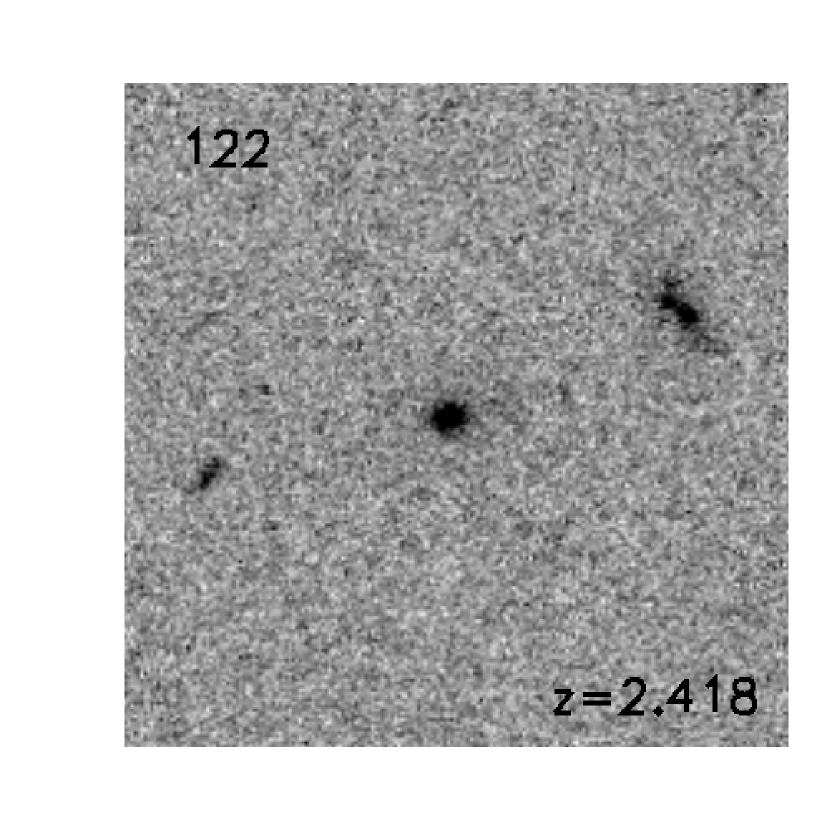
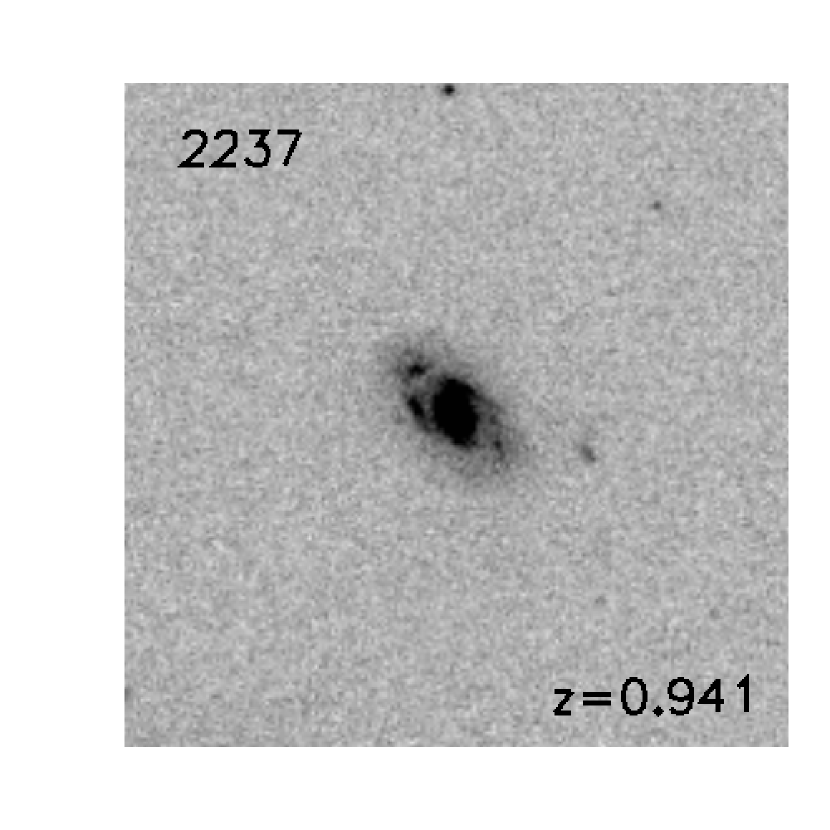
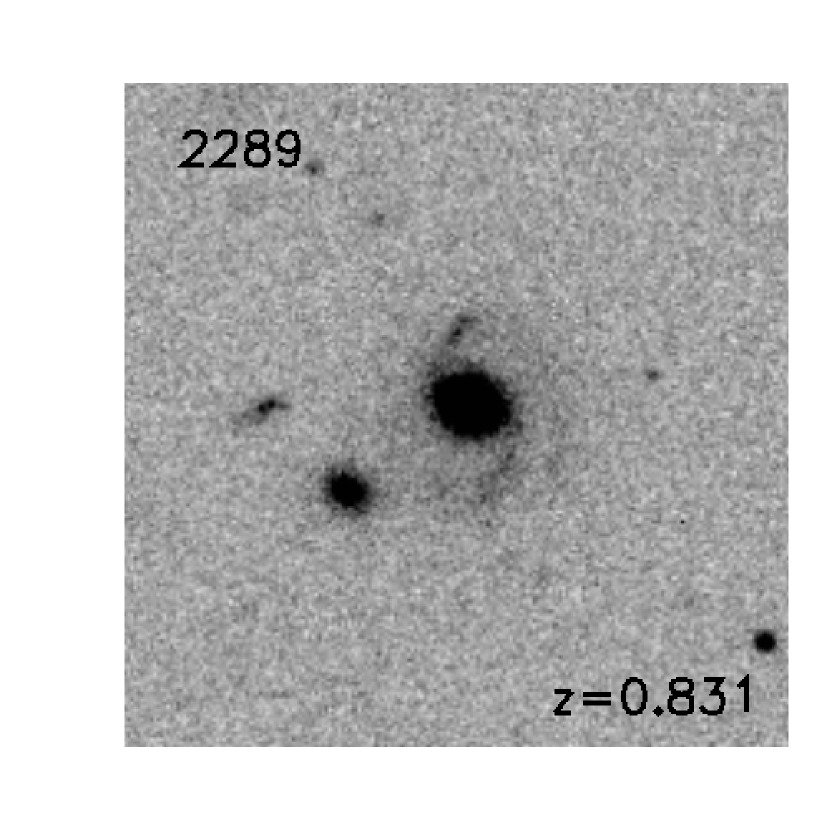
The optical spectra of these four sources show
high excitation emission lines and their redshifts are 0.688, 0.831,
0.941, 2.418 respectively for xid 70, 2289, 2237, 122.
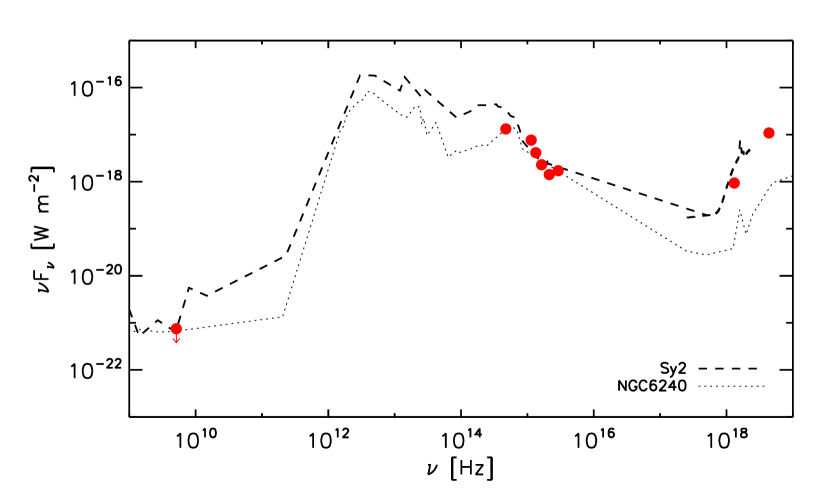
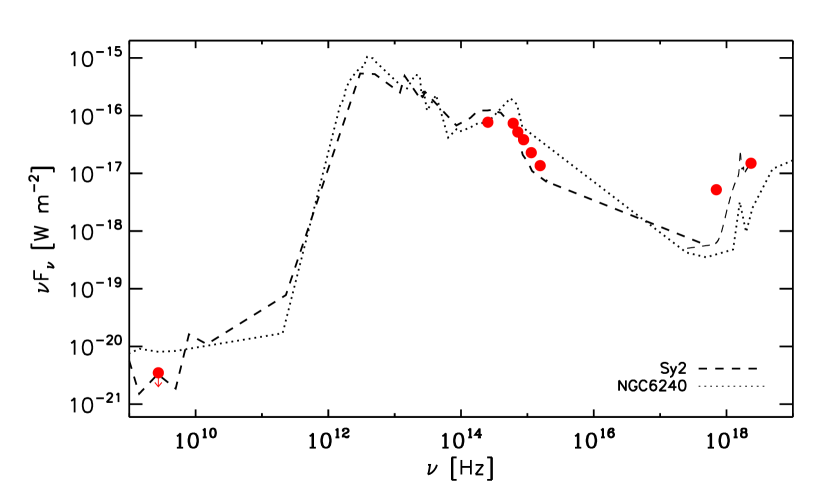
Using the
multi-band photometry available from the COSMOS survey
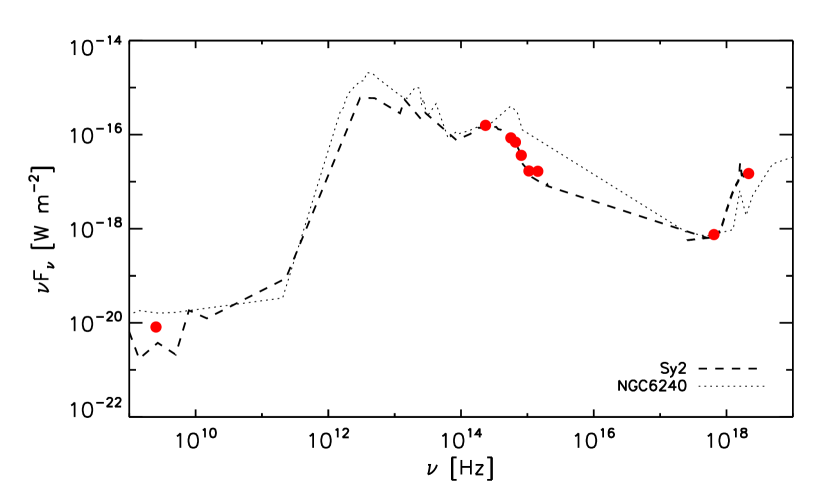
(Capak et al., 2007), we have derived the spectral energy distribution
(SED) for the four Type-2 QSOs and compared them with the spectrum of
NGC6240 and a Seyfert-2 composite spectrum derived from a sample of
local galaxies by Schmitt et al. (1997) and Moran et al. (2001). While the SED
of NGC6240 does not reproduce well the observed photometry of our
Type-2 QSOs, an excellent description of the same is given by the
composite Seyfert-2 SED (see right panels in Fig. 14).
Furthermore, the R-K colors of these four objects are red (R-K=4.58,
3.91, 4.97, 4.76 respectively) although they can not be classified as
EROs (R-K).
6. Comparison between X-ray and optical classifications.
A classification based on the properties of the optical spectra of the
135 sources in our sample divides them into ’Broad Line AGN’
(BLAGN, 86 objects) if emission lines broader than 2000 km s-1
are present, ’Narrow Line AGN’ (NLAGN, 32 objects) if the
optical spectrum shows high excitation emission lines and ’galaxy’ (gal, 17 objects) if there is no sign of AGN activity from
the optical spectrum. As shown by deep Chandra and XMM-Newton surveys (e.g. Szokoly et al. 2004) a pure optical
classification of AGN is biased against absorbed sources that appear
as normal galaxies at those wavelengths. As previously done by
Szokoly et al. (2004) and Tozzi et al. (2006), we introduce an X-ray based
classification: we define X-ray absorbed AGN sources that are
best fitted by an APL model compared to the PL one and have L erg s-1, X-ray unabsorbed AGN sources best
fitted with a PL model and L erg s-1 and
finally X-ray galaxies sources with L erg
s-1.
Table 5 shows the comparison of the optical
and X-ray classifications for our 135 sources. Ninety-one of these
sources () have a similar classification from the optical
and X-ray data. The best agreement between the two classifications is
for Broad Line AGN (optical) and X-ray unabsorbed AGN (X-ray) for
which the fractions of similar classifications are of the order of
( Broad Line AGN) and ( X-ray unabsorbed
AGN) respectively. The of BL AGN that show X-ray absorption
in their X-ray spectra have values of the column density NH
below cm-2 (see empty histogram in
Fig. 9). The main difference is instead for objects
classified as galaxies on the basis of the optical spectra. Most of
these objects () are classified as AGN (11 absorbed and 5
unabsorbed) on the basis of the X-ray luminosity. This confirms that
the X-ray classification is more successful than the optical one in
revealing the presence of black hole activity. The situation is
intermediate for Narrow Line and X-ray absorbed AGN: only
of the optically classified Narrow Line AGN do show detectable X-ray
absorption. We note that of the remaining Narrow Line AGN,
have z and therefore the H line is outside the observed
wavelength range, while for nine of them the MgII line is inside the
observed range (i.e. ) but the S/N of the spectra could
not be sufficient to detect a weak broad line. It is therefore
possible that at least part of the disagreement between the optical
and the X-ray classifications for these objects is due to less than
optimal optical spectra, in terms of either spectral coverage or S/N.


7. Conclusions
We have presented the detailed spectral analysis of 135 X-ray sources from the XMM-Newton wide-field survey in the COSMOS field. All the sources in our sample have more than 100 net counts in the [0.3-10] keV energy band and have been spectroscopically identified. For each source we have performed an accurate spectral fit in order to measure the continuum shape, the amount of absorbing matter and the strength of other spectral features. Our main results are summarized as follows:
-
•
We find that, to the X-ray flux limit we are sampling (F erg cm-2 s-1), of the spectra are well reproduced with a single power-law model, require an absorbed power-law model and the remaining need more complex models.
-
•
The average value of the spectral slope of the intrinsic spectrum for the 82 sources with more than 180 net counts (Sample-1) is with an intrinsic dispersion of .
-
•
We find no correlation between the spectral slope and the amount of intrinsic absorption NH, confirming that the hardening of the X-ray spectra going to fainter X-ray fluxes is due to the increased fraction of absorbed X-ray sources.
-
•
None of the X-ray sources with a column density N cm-2 shows broad line in their optical spectra, although a fraction () of broad line AGN shows intrinsic absorption in excess to the Galactic value.
-
•
We detect (at more than confidence level) the Fe K line in three objects. One of them is well described by a pure reflection model plus a Gaussian line at 6.4 keV rest-frame. This, the large equivalent width of the Fe line (although with large uncertainties) and diagnostics based on lines ratios from the optical spectrum support the hypothesis that this particular source is a Compton thick AGN.
-
•
We find four radio-quiet Type-2 QSOs. Their spectral energy distribution is well reproduced with a Seyfert-2 composite spectrum.
-
•
We confirm that in order to have a less biased sample of AGN it is crucial to complement the optical spectral properties with the X-ray informations (LX and NH), since many apparently normal galaxies in the optical band are instead absorbed AGN.
This is the first work on the X-ray spectral properties of the AGN in the COSMOS survey. We remark that once the XMM-Newton observations will be completed and the planned spectroscopic follow-up finished, we will be able to analyze the X-ray spectral properties of the AGN on a much larger sample and compare them with the properties of the AGN/host-galaxies at almost all the wavelengths.
We are grateful to Paolo Tozzi, Kazushi Iwasawa and Paolo Padovani for inspiring discussions. We gratefully acknowledge the entire COSMOS collaboration consisting of more than 70 scientists. More information on the COSMOS survey is available at
http://www.astro.caltech.edu/$∼$cosmos. It is a pleasure the acknowledge the excellent services provided by the NASA IPAC/IRSA staff (Anastasia Laity, Anastasia Alexov, Bruce Berriman and John Good) in providing online archive and server capabilities for the COSMOS datasets.
References
- Akiyama et al. (2000) Akiyama, M. et al. 2000, ApJ, 532, 700
- Alexander et al. (2003) Alexander, D.M. et al. 2003, AJ, 126, 539
- Arnaud et al. (1985) Arnaud, K.A. et al. 1985, MNRAS, 53, 197
- Bassani et al. (1999) Bassani, L. et al. 1999, ApJS, 121, 473
- Brandt et al. (2001) Brandt, W.N. et al. 2001, AJ, 122, 2810
- Brusa et al. (2003) Brusa, M. et al. 2003, A&A, 409, 65
- Brusa et al. (2007) Brusa, M. et al. 2007, ApJS, this volume
- Capak et al. (2007) Capak, P. et al. 2007, ApJS, this volume
- Cappelluti et al. (2007) Cappelluti, N. et al. 2007, ApJS, this volume
- Cash (1979) Cash, W. 1979, ApJ, 228, 939
- Comastri et al. (1995) Comastri, A. et al. 1995, A&A, 296, 1
- Comastri et al. (2002) Comastri, A. et al. 2002, ApJ, 571, 771
- Cowie et al. (2002) Cowie, L.L. et al. 2002, ApJ, 566, L5
- Dawson et al. (2001) Dawson, S. et al. 2001, AJ, 122, 598
- Della Ceca et al. (2003) Della Ceca, R. et al.2003, A&A, 406, 555
- Dickey & Lockman (1990) Dickey, J.M. & Lockman, F.J. 1990, ARA&A, 28, 215
- Fabian et al. (2000) Fabian, A.C. et al. 2000, MNRAS, 315, L8
- Finoguenov et al. (2007) Finoguenov, A. et al. 2007, ApJS, this volume
- Fiore et al. (2001) Fiore, F. et al. 2001, MNRAS, 327, 771
- Fiore et al. (2003) Fiore, F. et al. 2003, A&A, 409, 79
- Gallo et al. (2006) Gallo, L.C., Lehmann, I., Pietsch, W. et al. 2006, MNRAS, 365, 688
- Gilli et al. (2001) Gilli, R. et al. 2001, A&A, 366, 407
- Gilli et al. (2006) Gilli, R., Comastri, A., Hasinger, G. 2006, A&A in press [astro-ph/0610939]
- Guainazzi et al. (2005) Guainazzi, M., Matt, G., Perola, G.C., 2005, A&A, 444, 119
- Hasinger et al. (1998) Hasinger, G. et al. 1998, A&A, 329, 482
- Hasinger et al. (2001) Hasinger, G. et al. 2001, A&A, 365, L45
- Hasinger et al. (2007) Hasinger, G. et al. 2007, ApJS, this volume
- Kauffmann et al. (2003) Kauffmann, G. et al. 2003, MNRAS, 346, 1055
- Koekemoer et al. (2007) Koekemoer, A.M. et al. 2007, ApJS,this volume
- Lehmann et al. (2001) Lehmann, I. et al. 2001, A&A, 371, 833
- Leauthaud et al. (2007) Leauthaud, A. et al. 2007, ApJS,this volume
- Lilly et al. (2007) Lilly, S. et al. 2007, ApJS, this volume
- Loaring et al. (2005) Loaring, N.S. et al. 2005, MNRAS, 362, 1371
- Maccacaro et al. (1988) Maccacaro, T. et al. 1988, ApJ, 326, 680
- Magdziarz & Zdziarski (1995) Magdziarz, P. & Zdziarski. A.A., 1995, MNRAS, 273, 837
- Mainieri et al. (2002) Mainieri, V. et al. 2002, A&A, 393, 425
- Mainieri et al. (2005) Mainieri, V. et al. 2005, A&A, 437, 805
- Marleau & Simard (1998) Marleau, F.R. & Simard, L. 1998, ApJ, 507, 585
- Martinez-Sansigre et al. (2005) Martinez-Sansigre, A. et al. 2005, Nature, 436, 666
- Mateos et al. (2005a) Mateos, S. et al. 2005a, A&A, 433, 855
- Mateos et al. (2005b) Mateos, S. et al. 2005b, A&A, 444, 79
- Matsushita et al. (2001) Matsushita, K. et al. 2001, ApJ, 547, 693
- McCarthy (1993) McCarthy, P.J. et al. 1993, ARA&A, 31, 639
- Mignoli et al. (2004) Mignoli, M. et al. 2004, A&A, 418, 827
- Mittaz et al. (1999) Mittaz, J.P.D. et al. 1999, MNRAS, 308, 233
- Moran et al. (2001) Moran, E.C. et al. 2001, AJ, 556, L75
- Morrison & McCammon (1983) Morrison, R. & McCammon, D. 2001, AJ, 556, L75
- Norman et al. (2002) Norman, C. et al. 2002, ApJ, 571, 218
- Page et al. (2001) Page, M.J.. et al. 2001, MNRAS, 325, 575
- Page et al. (2006) Page, M.J.. et al. 2006, MNRAR in press, [astro-ph/0604015]
- Perola et al. (2004) Perola, G.C. et al. 2004, A&A, 421, 491
- Piconcelli et al. (2003) Piconcelli, E. et al. 2003, A&A, 412, 689
- Pounds & Reeves (2002) Pounds, K. & Reeves, J. 2002, ’New Visions of the X-ray Universe in the XMM-Newton and Chandra Era’, [astro-ph/0201436]
- Porquet et al. (2004) Porquet, D. et al. 2004, A&A, 422, 85
- Raymond & Smith (1977) Raymond, J.C. & Smith B.W. 1977, ApJS, 35, 419
- Rosati et al. (2002) Rosati, P. et al. 2002, ApJ, 566, 667
- Schartel et al. (2001) Schartel, N. et al. 2001, A&A, 320, 696
- Schinnerer et al. (2007) Schinnerer, E. et al. 2007, ApJS, this volume
- Schmitt et al. (1997) Schmitt, H.R. et al. 1997, AJ, 114, 592
- Scoville et al. (2007) Scoville, N.Z. et al. 2007, ApJS, this volume
- Setti & Woltjer (1989) Setti, G. & Woltjer, L. 1989, A&A, 224, L21
- Simard (1998) Simard, L. 1998, ASPC, 145, 108S
- Stern et al. (2002) Stern, D. et al. 2002, ApJ, 568, 71
- Stocke et al. (1991) Stocke, J.T. et al. 1991, ApJS, 76, 813
- Strüder et al. (2001) Strüder, L. et al. 2001, A&A, 365, 18
- Szokoly et al. (2004) Szokoly, G.P. et al. 2004, ApJS, 155, 271
- Tozzi et al. (2001) Tozzi, P. et al. 2001, AJ, 562, 42
- Tozzi et al. (2006) Tozzi, P., Gilli, R., Mainieri, V. et al. 2006, A&A in press, [astro-ph/0602127]
- Trump et al. (2007) Trump, J. et al. 2007, ApJS, this volume
- Turner & Pounds (1989) Turner, T.J. & Punds, K.A. 1989, MNRAS, 240, 833
- Turner et al. (1997) Turner, T.J. et al.1997, ApJS, 113, 23
- Worsley et al. (2004) Worsley, M.A. et al.2004, MNRAS, 357, 1281
- Zakamska et al. (2003) Zakamska, N.L. et al.2003, AJ, 129, 1212
| IAUaaIAU name. | XIDbbInternal reference number. | RAccX-ray coordinates. | DecccX-ray coordinates. | countsddNet pn counts in the [0.3-10] keV energy band. | zeeSpectroscopic redshift of the most likely optical counterpart (for details see brusa06). | MODELffBest fit model as discussed in §4. | NH | fxggX-ray fluxes from the spectral fit in units of erg cm-2 s-1 in the [0.5-2], [2-10] and [0.5-10] keV rest-frame energy bands respectively | fxggX-ray fluxes from the spectral fit in units of erg cm-2 s-1 in the [0.5-2], [2-10] and [0.5-10] keV rest-frame energy bands respectively | fxggX-ray fluxes from the spectral fit in units of erg cm-2 s-1 in the [0.5-2], [2-10] and [0.5-10] keV rest-frame energy bands respectively | LXhh of the X-ray luminosities corrected for absorption in the [0.5-2], [2-10] and [0.5-10] keV rest-frame energy bands respectively. | LXhh of the X-ray luminosities corrected for absorption in the [0.5-2], [2-10] and [0.5-10] keV rest-frame energy bands respectively. | LXhh of the X-ray luminosities corrected for absorption in the [0.5-2], [2-10] and [0.5-10] keV rest-frame energy bands respectively. | |
|---|---|---|---|---|---|---|---|---|---|---|---|---|---|---|
| (J2000) | [0.3-10] | [0.5-2] | [2-10] | [0.5-10] | [0.5-2] | [2-10] | [0.5-10] | |||||||
| XMMCJ100025.30+015851.2 | 1 | 10:00:25.30 | 1:58:51.19 | 4396 | 0.373 | PL | 2.11 | ….. | 746.88 | 795.94 | 1542.80 | 43.55 | 43.58 | 43.87 |
| XMMCJ095857.50+021314.1 | 2 | 9:58:57.50 | 2:13:14.10 | 1896 | 1.024 | PL | 1.79 | ….. | 1178.70 | 2004.80 | 3183.60 | 44.81 | 45.05 | 45.25 |
| XMMCJ095902.83+021906.8 | 3 | 9:59:02.83 | 2:19:06.77 | 2683 | 0.345 | PL | 2.07 | ….. | 1318.50 | 1484.60 | 2803.10 | 43.72 | 43.77 | 44.05 |
| XMMCJ095858.68+021458.1 | 4 | 9:58:58.68 | 2:14:58.12 | 1188 | 0.132 | PL | 1.78 | ….. | 851.43 | 1491.50 | 2342.90 | 42.59 | 42.84 | 43.03 |
| XMMCJ095918.91+020951.3 | 5 | 9:59:18.91 | 2:09:51.26 | 1517 | 1.154 | PL | 1.78 | ….. | 377.01 | 659.48 | 1036.50 | 44.45 | 44.69 | 44.89 |
| XMMCJ100043.26+020636.6 | 6 | 10:00:43.26 | 2:06:36.56 | 1664 | 0.360 | PL | 2.18 | ….. | 388.08 | 377.01 | 765.09 | 43.25 | 43.23 | 43.54 |
| XMMCJ100013.02+023521.8 | 8 | 10:00:13.02 | 2:35:21.82 | 1121 | 0.699 | PL | 2.45 | ….. | 627.74 | 407.25 | 1035.00 | 44.13 | 43.95 | 44.35 |
| XMMCJ095940.86+021938.6 | 9 | 9:59:40.86 | 2:19:38.56 | 1094 | 1.459 | PL | 1.99 | ….. | 196.07 | 249.26 | 445.33 | 44.42 | 44.52 | 44.77 |
| XMMCJ100034.95+020234.0 | 11 | 10:00:34.95 | 2:02:34.03 | 789 | 1.177 | PL | 2.25 | ….. | 139.90 | 122.46 | 262.35 | 44.04 | 43.98 | 44.31 |
| XMMCJ100049.95+020500.0 | 12 | 10:00:49.95 | 2:05:00.03 | 741 | 1.235 | PL | 2.50 | ….. | 240.22 | 144.84 | 385.06 | 44.33 | 44.11 | 44.53 |
| XMMCJ095924.69+015954.5 | 17 | 9:59:24.69 | 1:59:54.45 | 1771 | 1.236 | PL | 2.23 | ….. | 728.21 | 653.76 | 1382.00 | 44.81 | 44.76 | 45.09 |
| XMMCJ095958.60+021531.0 | 19 | 9:59:58.60 | 2:15:31.02 | 487 | 0.658 | PL | 2.05 | ….. | 247.59 | 278.06 | 525.65 | 43.63 | 43.70 | 43.97 |
| XMMCJ100058.80+022556.7 | 20 | 10:00:58.80 | 2:25:56.68 | 575 | 0.693 | PL | 2.22 | ….. | 182.66 | 165.75 | 348.41 | 43.62 | 43.58 | 43.90 |
| XMMCJ100055.46+023442.0 | 21 | 10:00:55.46 | 2:34:41.99 | 571 | 1.403 | PL | 2.15 | ….. | 158.63 | 159.81 | 318.44 | 44.28 | 44.29 | 44.58 |
| XMMCJ100046.85+020405.2 | 22 | 10:00:46.85 | 2:04:05.25 | 586 | 0.552 | PL | 2.70 | ….. | 113.30 | 51.61 | 164.91 | 43.11 | 42.77 | 43.27 |
| XMMCJ095909.63+021917.2 | 23 | 9:59:09.63 | 2:19:17.22 | 891 | 0.378 | PL | 2.05 | ….. | 314.47 | 360.31 | 674.78 | 43.17 | 43.23 | 43.50 |
| XMMCJ100024.74+023148.3 | 24 | 10:00:24.74 | 2:31:48.34 | 382 | 1.318 | PL | 2.65 | ….. | 293.47 | 143.55 | 437.02 | 44.48 | 44.17 | 44.66 |
| XMMCJ100024.55+020618.5 | 25 | 10:00:24.55 | 2:06:18.48 | 440 | 2.281 | PL | 1.75 | ….. | 156.54 | 286.15 | 442.68 | 44.79 | 45.06 | 45.25 |
| XMMCJ095949.51+020139.1 | 30 | 9:59:49.51 | 2:01:39.09 | 611 | 1.758 | PL | 2.51 | ….. | 120.90 | 72.33 | 193.24 | 44.41 | 44.18 | 44.61 |
| XMMCJ095947.05+022209.4 | 31 | 9:59:47.05 | 2:22:09.38 | 700 | 0.909 | PL | 2.27 | ….. | 128.42 | 108.14 | 236.56 | 43.72 | 43.65 | 43.99 |
| XMMCJ100114.36+022357.5 | 33 | 10:01:14.36 | 2:23:57.47 | 410 | 1.799 | PL | 2.34 | ….. | 119.16 | 91.12 | 210.28 | 44.42 | 44.31 | 44.67 |
| XMMCJ095958.62+021805.9 | 34 | 9:59:58.62 | 2:18:05.92 | 521 | 1.792 | PL | 1.99 | ….. | 111.88 | 142.74 | 254.62 | 44.39 | 44.50 | 44.75 |
| XMMCJ095928.45+022107.6 | 35 | 9:59:28.45 | 2:21:07.64 | 440 | 0.346 | PL | 2.54 | ….. | 117.30 | 67.04 | 184.34 | 42.72 | 42.47 | 42.91 |
| XMMCJ095940.18+022306.3 | 37 | 9:59:40.18 | 2:23:06.28 | 698 | 1.132 | PL | 2.16 | ….. | 89.97 | 89.38 | 179.35 | 43.81 | 43.80 | 44.10 |
| XMMCJ100058.94+015359.5 | 38 | 10:00:58.94 | 1:53:59.45 | 369 | 1.559 | APL | 2.04 | 20.73 | 106.94 | 129.53 | 236.47 | 44.32 | 44.39 | 44.65 |
| XMMCJ100114.94+020208.9 | 40 | 10:01:14.94 | 2:02:08.93 | 602 | 0.989 | PL | 2.01 | ….. | 465.40 | 574.11 | 1039.50 | 44.37 | 44.47 | 44.72 |
| XMMCJ100025.43+020734.4 | 41 | 10:00:25.43 | 2:07:34.43 | 315 | 0.114 | APL+po | 1.95 | 21.51 | 76.89 | 204.98 | 281.87 | 41.63 | 41.76 | 42.00 |
| XMMCJ100202.80+022435.8 | 42 | 10:02:02.80 | 2:24:35.82 | 476 | 0.988 | PL | 2.15 | ….. | 197.35 | 197.84 | 395.20 | 44.00 | 44.00 | 44.30 |
| XMMCJ100051.57+021215.8 | 44 | 10:00:51.57 | 2:12:15.80 | 305 | 1.829 | PL | 2.14 | ….. | 105.65 | 107.47 | 213.13 | 44.39 | 44.40 | 44.69 |
| XMMCJ100014.12+020054.2 | 51 | 10:00:14.12 | 2:00:54.18 | 336 | 2.497 | PL | 1.98 | ….. | 50.78 | 65.43 | 116.21 | 44.44 | 44.55 | 44.80 |
| XMMCJ100016.35+015104.3 | 52 | 10:00:16.35 | 1:51:04.30 | 297 | 1.135 | PL | 1.85 | ….. | 107.96 | 169.84 | 277.80 | 43.82 | 44.02 | 44.23 |
| XMMCJ100131.15+022924.8 | 54iiA powerlaw model is not a good representation of this source(see §4.1). | 10:01:31.15 | 2:29:24.82 | 246 | 0.350 | R-S | ….. | ….. | 90.18 | 24.44 | 114.62 | 42.57 | 42.00 | 42.67 |
| XMMCJ100001.16+021413.9 | 56 | 10:00:01.16 | 2:14:13.92 | 110 | 1.407 | PL | 2.00 | ….. | 89.25 | 101.56 | 190.81 | 44.04 | 44.09 | 44.37 |
| XMMCJ100047.09+020017.7 | 59 | 10:00:47.09 | 2:00:17.71 | 226 | 1.904 | PL | 2.12 | ….. | 59.74 | 63.30 | 123.04 | 44.18 | 44.21 | 44.50 |
| XMMCJ095907.84+020819.3 | 63 | 9:59:07.84 | 2:08:19.34 | 264 | 0.354 | PL | 1.95 | ….. | 193.50 | 260.69 | 454.19 | 42.85 | 42.98 | 43.22 |
| XMMCJ095934.63+020627.9 | 64 | 9:59:34.63 | 2:06:27.94 | 299 | 0.686 | PL | 1.64 | ….. | 56.23 | 121.35 | 177.58 | 43.00 | 43.34 | 43.50 |
| XMMCJ100041.87+022411.1 | 65 | 10:00:41.87 | 2:24:11.07 | 122 | 0.979 | PL | 2.00 | ….. | 61.79 | 77.64 | 139.44 | 43.49 | 43.59 | 43.84 |
| XMMCJ095928.45+021950.5 | 66 | 9:59:28.45 | 2:19:50.47 | 436 | 1.488 | PL | 2.22 | ….. | 81.58 | 74.39 | 155.96 | 44.06 | 44.02 | 44.34 |
| XMMCJ100137.74+022845.1 | 67 | 10:01:37.74 | 2:28:45.09 | 224 | 0.367 | PL | 1.93 | ….. | 69.35 | 97.21 | 166.56 | 42.37 | 42.51 | 42.75 |
| XMMCJ095934.92+021028.5 | 69 | 9:59:34.92 | 2:10:28.46 | 133 | 2.412 | PL | 2.00 | ….. | 78.25 | 98.32 | 176.57 | 44.55 | 44.65 | 44.91 |
| XMMCJ100036.13+022830.7 | 70 | 10:00:36.13 | 2:28:30.66 | 181 | 0.688 | APL | 2.78 | 23.23 | 25.19 | 579.88 | 605.07 | 44.68 | 44.29 | 44.83 |
| XMMCJ100129.81+023239.6 | 72 | 10:01:29.81 | 2:32:39.56 | 220 | 0.825 | APL | 1.72 | 21.00 | 55.72 | 114.19 | 169.91 | 43.33 | 43.61 | 43.80 |
| XMMCJ100031.66+014757.4 | 75 | 10:00:31.66 | 1:47:57.40 | 363 | 1.681 | PL | 1.94 | ….. | 154.44 | 211.03 | 365.48 | 44.46 | 44.60 | 44.84 |
| XMMCJ100028.71+021744.5 | 78 | 10:00:28.71 | 2:17:44.48 | 203 | 1.039 | PL | 1.72 | ….. | 50.69 | 95.86 | 146.54 | 43.46 | 43.74 | 43.93 |
| XMMCJ100124.93+022032.2 | 79 | 10:01:24.93 | 2:20:32.19 | 171 | 1.708 | PL | 2.00 | ….. | 74.53 | 93.65 | 168.18 | 44.16 | 44.26 | 44.52 |
| XMMCJ100105.65+015603.0 | 81 | 10:01:05.65 | 1:56:03.04 | 285 | 0.915 | APL | 1.44 | 21.44 | 50.50 | 159.64 | 210.14 | 43.26 | 43.70 | 43.84 |
| XMMCJ100117.73+023309.0 | 85 | 10:01:17.73 | 2:33:09.02 | 184 | 1.001 | APL | 1.99 | 21.16 | 50.33 | 68.88 | 119.21 | 43.50 | 43.60 | 43.85 |
| XMMCJ100048.01+021128.0 | 94 | 10:00:48.01 | 2:11:28.00 | 142 | 1.515 | PL | 2.00 | ….. | 80.93 | 101.69 | 182.61 | 44.07 | 44.17 | 44.43 |
| XMMCJ100136.47+025304.5 | 96 | 10:01:36.47 | 2:53:04.50 | 134 | 2.117 | PL | 2.00 | ….. | 163.26 | 201.31 | 364.57 | 44.73 | 44.83 | 45.08 |
| XMMCJ100031.41+022819.2 | 101 | 10:00:31.41 | 2:28:19.18 | 131 | 0.926 | PL | 2.00 | ….. | 47.26 | 59.38 | 106.63 | 43.31 | 43.41 | 43.66 |
| XMMCJ100028.20+015547.0 | 103 | 10:00:28.20 | 1:55:46.98 | 144 | 1.519 | PL | 2.00 | ….. | 53.96 | 67.80 | 121.76 | 43.90 | 44.00 | 44.25 |
| XMMCJ100038.13+022455.8 | 106 | 10:00:38.13 | 2:24:55.79 | 141 | 0.710 | APL+po | 2.00 | 22.33 | 14.54 | 43.92 | 58.47 | 42.85 | 42.95 | 43.20 |
| XMMCJ095935.73+020537.2 | 113 | 9:59:35.73 | 2:05:37.24 | 101 | 1.910 | PL | 2.00 | ….. | 55.61 | 69.87 | 125.48 | 44.16 | 44.26 | 44.51 |
| XMMCJ100210.73+023028.0 | 115 | 10:02:10.73 | 2:30:27.97 | 591 | 1.161 | APL | 2.10 | 21.10 | 176.22 | 204.96 | 381.18 | 44.18 | 44.22 | 44.50 |
| XMMCJ100049.61+021709.2 | 116 | 10:00:49.61 | 2:17:09.17 | 218 | 0.874 | APL | 2.11 | 21.11 | 74.38 | 87.32 | 161.71 | 43.53 | 43.56 | 43.84 |
| XMMCJ100013.45+021400.5 | 117 | 10:00:13.45 | 2:14:00.47 | 111 | 0.936 | APLpo | 2.00 | 22.76 | 28.01 | 35.20 | 63.21 | 43.09 | 43.19 | 43.45 |
| XMMCJ100122.23+021334.0 | 119 | 10:01:22.23 | 2:13:33.99 | 328 | 0.891 | APL | 1.69 | 21.01 | 213.98 | 452.80 | 666.78 | 43.97 | 44.27 | 44.44 |
| XMMCJ095945.47+021029.9 | 122 | 9:59:45.47 | 2:10:29.88 | 130 | 2.418 | APL | 2.00 | 23.69 | 14.90 | 147.41 | 162.32 | 44.83 | 44.93 | 45.18 |
| XMMCJ100131.93+023335.5 | 123 | 10:01:31.93 | 2:33:35.46 | 142 | 2.065 | PL | 2.00 | ….. | 23.93 | 30.07 | 54.00 | 43.87 | 43.97 | 44.23 |
| XMMCJ100001.27+022320.7 | 127 | 10:00:01.27 | 2:23:20.69 | 217 | 1.846 | PL | 2.55 | ….. | 34.62 | 19.63 | 54.25 | 43.91 | 43.67 | 44.11 |
| XMMCJ100047.85+020756.1 | 128 | 10:00:47.85 | 2:07:56.15 | 120 | 2.161 | PL | 2.00 | ….. | 32.52 | 40.86 | 73.38 | 44.06 | 44.15 | 44.41 |
| XMMCJ100100.90+015946.7 | 129 | 10:01:00.90 | 1:59:46.69 | 184 | 1.170 | PL | 1.98 | ….. | 196.94 | 256.78 | 453.72 | 44.13 | 44.25 | 44.49 |
| XMMCJ100105.36+021348.0 | 133 | 10:01:05.36 | 2:13:47.96 | 144 | 2.627 | PL | 2.00 | ….. | 56.73 | 71.28 | 128.00 | 44.50 | 44.60 | 44.86 |
| XMMCJ100011.78+021919.9 | 134 | 10:00:11.78 | 2:19:19.86 | 141 | 0.625 | PL | 2.00 | ….. | 35.13 | 44.14 | 79.28 | 42.76 | 42.86 | 43.12 |
| XMMCJ095949.98+020010.6 | 137 | 9:59:49.98 | 2:00:10.57 | 195 | 1.808 | PL | 1.87 | ….. | 44.24 | 92.96 | 137.20 | 44.06 | 44.25 | 44.47 |
| XMMCJ100033.55+015236.3 | 141 | 10:00:33.55 | 1:52:36.34 | 102 | 0.831 | APL | 2.00 | 21.64 | 51.21 | 85.40 | 136.61 | 43.36 | 43.45 | 43.71 |
| XMMCJ100013.46+022656.7 | 143 | 10:00:13.46 | 2:26:56.66 | 140 | 0.732 | APL | 2.00 | 22.68 | 29.41 | 194.21 | 223.62 | 43.62 | 43.72 | 43.97 |
| XMMCJ095938.49+020447.5 | 146 | 9:59:38.49 | 2:04:47.51 | 167 | 2.804 | APL | 2.00 | 21.95 | 53.36 | 73.96 | 127.32 | 44.59 | 44.69 | 44.94 |
| XMMCJ100053.93+021614.2 | 147 | 10:00:53.93 | 2:16:14.22 | 112 | 2.944 | PL | 2.00 | ….. | 26.82 | 33.70 | 60.52 | 44.30 | 44.40 | 44.65 |
| XMMCJ100052.57+021643.8 | 148 | 10:00:52.57 | 2:16:43.80 | 111 | 0.843 | PL | 2.00 | ….. | 41.34 | 51.94 | 93.27 | 43.15 | 43.25 | 43.50 |
| XMMCJ100124.00+021446.4 | 152 | 10:01:24.00 | 2:14:46.45 | 172 | 0.894 | PL | 2.00 | ….. | 88.13 | 110.74 | 198.87 | 43.54 | 43.64 | 43.90 |
| XMMCJ100108.44+022342.6 | 153 | 10:01:08.44 | 2:23:42.58 | 142 | 1.928 | APL | 2.00 | 21.91 | 33.00 | 49.24 | 82.24 | 44.02 | 44.12 | 44.37 |
| XMMCJ100108.59+020053.2 | 161 | 10:01:08.59 | 2:00:53.24 | 254 | 2.681 | PL | 1.69 | ….. | 75.27 | 149.97 | 225.25 | 44.65 | 44.95 | 45.12 |
| XMMCJ100118.55+015543.6 | 164 | 10:01:18.55 | 1:55:43.59 | 291 | 0.528 | PL | 2.54 | ….. | 176.15 | 100.11 | 276.25 | 43.32 | 43.07 | 43.51 |
| XMMCJ100043.30+021352.7 | 165 | 10:00:43.30 | 2:13:52.65 | 120 | 2.146 | PL | 2.00 | ….. | 25.58 | 32.14 | 57.73 | 43.94 | 44.04 | 44.30 |
| XMMCJ095917.44+021514.9 | 170 | 9:59:17.44 | 2:15:14.91 | 142 | 0.935 | PL | 2.00 | ….. | 37.05 | 46.55 | 83.59 | 43.21 | 43.31 | 43.57 |
| XMMCJ100128.19+021819.9 | 171 | 10:01:28.19 | 2:18:19.86 | 133 | 1.187 | PL | 2.00 | ….. | 34.80 | 43.72 | 78.52 | 43.44 | 43.54 | 43.80 |
| XMMCJ095921.15+020030.8 | 196 | 9:59:21.15 | 2:00:30.83 | 154 | 1.486 | PL | 2.00 | ….. | 56.39 | 70.85 | 127.24 | 43.89 | 43.99 | 44.25 |
| XMMCJ100047.93+014935.9 | 198 | 10:00:47.93 | 1:49:35.93 | 134 | 0.893 | PL | 2.00 | ….. | 46.55 | 58.49 | 105.04 | 43.26 | 43.36 | 43.62 |
| XMMCJ095858.95+020138.7 | 199 | 9:58:58.95 | 2:01:38.72 | 268 | 2.454 | PL | 2.11 | ….. | 161.11 | 171.30 | 332.41 | 44.88 | 44.91 | 45.20 |
| XMMCJ100105.90+015918.6 | 206 | 10:01:05.90 | 1:59:18.58 | 131 | 0.721 | APL | 2.00 | 21.69 | 29.60 | 53.14 | 82.74 | 43.00 | 43.10 | 43.35 |
| XMMCJ100058.47+015206.4 | 216 | 10:00:58.47 | 1:52:06.40 | 216 | 2.029 | PL | 2.22 | ….. | 42.84 | 39.07 | 81.91 | 44.11 | 44.07 | 44.39 |
| XMMCJ095956.08+014728.0 | 222 | 9:59:56.08 | 1:47:27.97 | 237 | 0.337 | PL | 2.28 | ….. | 73.53 | 61.26 | 134.79 | 42.57 | 42.49 | 42.83 |
| XMMCJ100139.88+023132.8 | 236 | 10:01:39.88 | 2:31:32.77 | 110 | 1.444 | PL | 2.00 | ….. | 12.81 | 16.09 | 28.90 | 43.22 | 43.32 | 43.57 |
| XMMCJ100046.86+014737.1 | 256 | 10:00:46.86 | 1:47:37.14 | 113 | 1.867 | APL | 2.00 | 20.71 | 55.75 | 70.92 | 126.67 | 44.22 | 44.32 | 44.57 |
| XMMCJ100042.36+014535.7 | 265 | 10:00:42.36 | 1:45:35.66 | 101 | 1.161 | PL | 2.00 | ….. | 38.62 | 48.52 | 87.14 | 43.47 | 43.56 | 43.82 |
| XMMCJ095910.00+022018.4 | 268 | 9:59:10.00 | 2:20:18.42 | 143 | 0.432 | APL | 2.00 | 21.32 | 34.78 | 56.34 | 91.12 | 42.49 | 42.59 | 42.84 |
| XMMCJ100005.52+023057.4 | 274 | 10:00:05.52 | 2:30:57.40 | 112 | 0.677 | APLpo | 2.00 | 22.67 | 18.30 | 104.83 | 123.13 | 43.26 | 43.36 | 43.62 |
| XMMCJ095929.40+022035.6 | 282 | 9:59:29.40 | 2:20:35.60 | 150 | 1.733 | PL | 2.00 | ….. | 18.24 | 22.92 | 41.16 | 43.57 | 43.67 | 43.92 |
| XMMCJ095902.45+022510.6 | 288 | 9:59:02.45 | 2:25:10.61 | 202 | 1.105 | PL | 2.17 | ….. | 35.06 | 34.23 | 69.29 | 43.30 | 43.29 | 43.60 |
| XMMCJ095927.04+015340.8 | 293 | 9:59:27.04 | 1:53:40.84 | 222 | 0.444 | APL | 1.51 | 21.91 | 136.15 | 666.98 | 803.13 | 43.28 | 43.69 | 43.83 |
| XMMCJ100016.65+021352.1 | 298 | 10:00:16.65 | 2:13:52.11 | 100 | 1.867 | PL | 2.00 | ….. | 23.63 | 29.70 | 53.33 | 43.76 | 43.86 | 44.11 |
| XMMCJ100049.94+015230.8 | 359 | 10:00:49.94 | 1:52:30.79 | 222 | 1.156 | PL | 1.54 | ….. | 35.99 | 89.17 | 125.16 | 43.35 | 43.74 | 43.89 |
| XMMCJ100118.89+020729.0 | 391 | 10:01:18.89 | 2:07:28.98 | 110 | 1.774 | PL | 2.00 | ….. | 50.15 | 62.98 | 113.13 | 44.03 | 44.13 | 44.39 |
| XMMCJ100006.35+023342.0 | 398 | 10:00:06.35 | 2:33:42.01 | 131 | 0.745 | APL | 2.00 | 21.64 | 40.43 | 69.95 | 110.38 | 43.15 | 43.25 | 43.51 |
| XMMCJ095944.64+022626.2 | 416 | 9:59:44.64 | 2:26:26.22 | 102 | 0.992 | APL | 2.00 | 22.19 | 18.76 | 45.28 | 64.04 | 43.28 | 43.38 | 43.63 |
| XMMCJ100223.07+014715.1 | 2013 | 10:02:23.07 | 1:47:15.07 | 686 | 1.243 | PL | 1.82 | ….. | 428.34 | 700.54 | 1128.90 | 44.58 | 44.80 | 45.00 |
| XMMCJ095819.89+022903.8 | 2016 | 9:58:19.89 | 2:29:03.78 | 768 | 0.345 | PL | 2.19 | ….. | 385.27 | 373.31 | 758.58 | 43.21 | 43.19 | 43.50 |
| XMMCJ100234.40+015011.5 | 2020 | 10:02:34.40 | 1:50:11.51 | 651 | 1.506 | PL | 2.25 | ….. | 226.06 | 196.73 | 422.80 | 44.51 | 44.45 | 44.78 |
| XMMCJ100129.41+013633.7 | 2021 | 10:01:29.41 | 1:36:33.75 | 271 | 0.104 | APL | 1.23 | 22.38 | 163.24 | 4230.20 | 4393.50 | 42.39 | 43.12 | 43.19 |
| XMMCJ100211.31+013707.2 | 2028 | 10:02:11.31 | 1:37:07.15 | 293 | 0.784 | APL+Fe | 2.55 | 21.83 | 113.12 | 204.74 | 317.86 | 43.75 | 43.50 | 43.94 |
| XMMCJ100257.55+015405.6 | 2036 | 10:02:57.55 | 1:54:05.58 | 233 | 0.971 | PL | 1.89 | ….. | 284.95 | 423.49 | 708.44 | 44.14 | 44.31 | 44.54 |
| XMMCJ100033.51+013812.6 | 2040 | 10:00:33.51 | 1:38:12.61 | 317 | 0.520 | PL | 2.28 | ….. | 263.04 | 212.05 | 475.09 | 43.40 | 43.32 | 43.67 |
| XMMCJ100237.09+014648.3 | 2043 | 10:02:37.09 | 1:46:48.33 | 347 | 0.668 | APL+Fe | 1.56 | 21.77 | 172.69 | 608.59 | 781.28 | 43.55 | 43.93 | 44.08 |
| XMMCJ100303.04+015209.2 | 2046 | 10:03:03.04 | 1:52:09.19 | 341 | 1.800 | PL | 2.23 | ….. | 132.62 | 119.47 | 252.09 | 44.47 | 44.43 | 44.75 |
| XMMCJ100151.19+020032.8 | 2058 | 10:01:51.19 | 2:00:32.81 | 779 | 0.964 | PL | 2.02 | ….. | 285.44 | 348.97 | 634.41 | 44.13 | 44.22 | 44.48 |
| XMMCJ100229.27+014528.2 | 2071 | 10:02:29.27 | 1:45:28.21 | 328 | 0.876 | PL | 1.58 | ….. | 177.16 | 414.17 | 591.34 | 43.72 | 44.09 | 44.24 |
| XMMCJ100141.42+021031.8 | 2078 | 10:01:41.42 | 2:10:31.78 | 195 | 0.982 | APL | 1.93 | 20.96 | 135.04 | 197.89 | 332.93 | 43.85 | 44.00 | 44.23 |
| XMMCJ100238.78+013938.2 | 2080 | 10:02:38.78 | 1:39:38.25 | 238 | 1.315 | PL | 1.87 | ….. | 127.19 | 193.62 | 320.82 | 44.07 | 44.26 | 44.48 |
| XMMCJ100238.27+013747.8 | 2093 | 10:02:38.27 | 1:37:47.75 | 222 | 2.506 | PL | 1.97 | ….. | 131.93 | 172.73 | 304.66 | 44.82 | 44.94 | 45.18 |
| XMMCJ100214.21+020620.0 | 2096 | 10:02:14.21 | 2:06:20.02 | 482 | 1.265 | PL | 1.64 | ….. | 131.85 | 282.01 | 413.85 | 44.03 | 44.36 | 44.53 |
| XMMCJ100219.58+015536.9 | 2105 | 10:02:19.58 | 1:55:36.94 | 323 | 1.509 | PL | 2.19 | ….. | 74.17 | 70.26 | 144.43 | 44.03 | 44.01 | 44.32 |
| XMMCJ100305.20+015157.0 | 2118 | 10:03:05.20 | 1:51:57.04 | 195 | 0.969 | APL | 2.14 | 20.99 | 165.82 | 180.69 | 346.51 | 43.93 | 43.94 | 44.24 |
| XMMCJ095848.84+023442.3 | 2138 | 9:58:48.84 | 2:34:42.34 | 729 | 1.551 | PL | 2.01 | ….. | 121.90 | 151.84 | 273.74 | 44.28 | 44.37 | 44.63 |
| XMMCJ100230.13+014810.0 | 2152 | 10:02:30.13 | 1:48:10.01 | 281 | 0.626 | PL | 2.21 | ….. | 94.64 | 86.97 | 181.61 | 43.19 | 43.16 | 43.48 |
| XMMCJ100232.55+014009.5 | 2169 | 10:02:32.55 | 1:40:09.53 | 144 | 1.776 | PL | 2.00 | ….. | 72.41 | 90.98 | 163.39 | 44.19 | 44.29 | 44.55 |
| XMMCJ100141.11+021259.9 | 2191 | 10:01:41.11 | 2:12:59.88 | 225 | 0.621 | PL | 2.27 | ….. | 87.36 | 74.02 | 161.38 | 43.01 | 42.94 | 43.28 |
| XMMCJ100236.79+015948.5 | 2202 | 10:02:36.79 | 1:59:48.50 | 142 | 1.516 | PL | 2.00 | ….. | 65.21 | 79.78 | 144.99 | 43.98 | 44.07 | 44.33 |
| XMMCJ100038.40+013708.4 | 2211 | 10:00:38.40 | 1:37:08.37 | 153 | 1.251 | PL | 2.00 | ….. | 65.00 | 81.68 | 146.68 | 43.77 | 43.87 | 44.13 |
| XMMCJ100156.40+014811.0 | 2213 | 10:01:56.40 | 1:48:11.00 | 263 | 0.957 | APL | 2.02 | 20.87 | 71.18 | 91.34 | 162.52 | 43.54 | 43.63 | 43.89 |
| XMMCJ100226.77+014052.1 | 2218 | 10:02:26.77 | 1:40:52.05 | 123 | 0.247 | PL | 2.00 | ….. | 55.24 | 69.41 | 124.65 | 42.01 | 42.11 | 42.36 |
| XMMCJ100041.57+013658.7 | 2220 | 10:00:41.57 | 1:36:58.69 | 162 | 0.995 | PL | 2.00 | ….. | 73.60 | 92.48 | 166.08 | 43.58 | 43.68 | 43.93 |
| XMMCJ100156.31+020942.9 | 2232 | 10:01:56.31 | 2:09:42.91 | 131 | 1.641 | PL | 2.00 | ….. | 43.15 | 54.21 | 97.36 | 43.88 | 43.98 | 44.24 |
| XMMCJ100253.16+013457.8 | 2235 | 10:02:53.16 | 1:34:57.85 | 100 | 2.248 | PL | 2.00 | ….. | 65.71 | 81.11 | 146.82 | 44.40 | 44.49 | 44.75 |
| XMMCJ095904.34+022552.8 | 2237 | 9:59:04.34 | 2:25:52.75 | 192 | 0.941 | APL | 1.78 | 22.74 | 38.88 | 285.86 | 324.74 | 43.91 | 44.15 | 44.34 |
| XMMCJ100223.02+020639.5 | 2246 | 10:02:23.02 | 2:06:39.48 | 303 | 0.899 | PL | 1.95 | ….. | 69.93 | 94.68 | 164.61 | 43.41 | 43.54 | 43.78 |
| XMMCJ100243.88+020501.6 | 2261 | 10:02:43.88 | 2:05:01.59 | 206 | 1.234 | PL | 1.97 | ….. | 72.98 | 95.93 | 168.91 | 43.81 | 43.93 | 44.17 |
| XMMCJ100208.53+014553.7 | 2276 | 10:02:08.53 | 1:45:53.65 | 111 | 2.215 | PL | 2.00 | ….. | 31.49 | 39.56 | 71.05 | 44.07 | 44.17 | 44.42 |
| XMMCJ100158.05+014621.7 | 2289 | 10:01:58.05 | 1:46:21.74 | 122 | 0.831 | APL | 2.00 | 22.77 | 32.93 | 230.29 | 263.22 | 43.83 | 43.93 | 44.19 |
| XMMCJ100130.33+014305.0 | 2299 | 10:01:30.33 | 1:43:04.97 | 110 | 1.571 | PL | 2.00 | ….. | 76.83 | 96.53 | 173.35 | 44.09 | 44.19 | 44.44 |
| XMMCJ100143.54+015606.2 | 2361 | 10:01:43.54 | 1:56:06.18 | 195 | 2.181 | PL | 1.94 | ….. | 93.06 | 127.11 | 220.17 | 44.52 | 44.66 | 44.90 |
| XMMCJ100240.34+020146.4 | 2370 | 10:02:40.34 | 2:01:46.37 | 132 | 0.638 | APL | 2.00 | 22.16 | 34.05 | 103.02 | 137.07 | 43.17 | 43.27 | 43.52 |
| XMMCJ100141.54+020051.4 | 2557 | 10:01:41.54 | 2:00:51.44 | 120 | 2.277 | PL | 2.00 | ….. | 158.62 | 199.31 | 357.93 | 44.80 | 44.90 | 45.15 |
| XMMCJ100142.26+020358.5 | 2608 | 10:01:42.26 | 2:03:58.49 | 131 | 0.125 | PEXRAV+Fe | 2.00 | 24.18 | 28.99 | 511.11 | 63.12 | 41.07 | 42.32 | 43.87 |
| XMMCJ100136.21+015442.5 | 2703 | 10:01:36.21 | 1:54:42.45 | 151 | 2.281 | PL | 2.00 | ….. | 209.26 | 262.93 | 472.19 | 44.92 | 45.02 | 45.27 |
| Broad Line AGN | Narrow Line AGN | Galaxy | |
|---|---|---|---|
| X-ray unabsorbed AGN | 78 | 19 | 5 |
| X-ray absorbed AGN | 8 | 13 | 11 |
| X-ray galaxy | 0 | 0 | 0 |