Leo II Group: decoupled cores of NGC 3607 and NGC 3608 ††thanks: Based on observations collected with the 6m telescope of the Special Astrophysical Observatory (SAO) of the Russian Academy of Sciences (RAS) which is operated under the financial support of Science Department of Russia (registration number 01-43) and on data from the Isaac Newton Group (ING) and Hubble Space Telescope (HST) Archives.
Abstract
The kinematics, structure, and stellar population properties in the centers of two brightest early-type galaxies of the Leo II group, NGC 3607 and NGC 3608, are studied by means of integral-field spectroscopy. The kinematically distinct areas in the centers of these galaxies, with radii of and respectively, are found also to be chemically distinct. These stellar structures are characterized by enhanced magnesium-line strength in the integrated spectra. However, we have not found any mean stellar age differences between the decoupled cores and their outskirts. Analysis of two-dimensional line-of-sight velocity fields reveals systematic turns of kinematical major axes near the nuclei of both galaxies; in NGC 3608 the ionized gas rotates in the orthogonal plane with respect to the stellar component rotation. By taking into account some morphological features, we conclude that both NGC 3607 and NGC 3608 have large triaxial stellar spheroids. We argue that the magnesium-enhanced cores are not circumnuclear disks; instead they resemble rather compact triaxial structures which may be a cause of formation of polar disks around them – a gaseous one in NGC 3608 and a stellar-gaseous one in NGC 3607. In the latter galaxy the star formation is perhaps still proceeding over the polar disk.
keywords:
Galaxies: individual: NGC 3607 – Galaxies: individual: NGC 3608 – Galaxies: nuclei – Galaxies: stellar content – Galaxies: kinematics & dynamics – Galaxies: evolution1 Introduction
There exists now a certain contradiction between a homogeneous red-colour appearance of nearby massive early-type galaxies implying very ancient epoch of the main star formation and prescriptions of the hierarchical concept of galaxy formation requiring quite recent merger events. The recent merging of disk galaxies possessing significant amount of gas must be followed by some secondary, preferably circumnuclear star formation. Galaxy groups represent perhaps the best places where consequences of the external-driven evolution of early-type galaxies may be found because dense environments and moderate (with respect to clusters’) velocity dispersions are favourable for mergers and tidal interactions.
Recently we have considered Leo I group and its members NGC 3379, NGC 3384, and NGC 3368 (Sil’chenko et al., 2003). A combined analysis of the stellar and gaseous kinematics and of stellar population properties in the centers of the galaxies has revealed signatures of synchronous secular evolution. In the centers of the galaxies the inner rotation axes are aligned, despite the different orientations of the outer galactic bodies, and the mean stellar age estimates evidence for quasi-simultaneous star formation bursts about 3 Gyr ago. However, the Leo I group is somewhat unique because it possesses a supergiant intergalactic H I cloud of (Schneider, 1985, 1989). Its shape is a clumpy ring with a radius of kpc encircling the galaxy pair NGC 3379/NGC 3384, and just the spatial orientation of this ring defines the alignment of the inner rotation axes of the three galaxies. So it seems probable that the secular evolution of the Leo I early-type galaxies is governed by the interaction of every galaxy with the intergalactic H I ring and not by tidal interactions between the galaxies. In the present paper we consider central early-type galaxies of the Leo II group lacking significant masses of neutral hydrogen. It is interesting to look for signatures of the secular evolution in the circumnuclear parts of these galaxies. The Leo II group contains 16 galaxies brighter than , according to Giuricin et al. (2000). From those, only 5 are of early type, namely, S0 or ellipticals; three early-type galaxies, NGC 3605 (compact dwarf elliptical), NGC 3607, and NGC 3608 are located in the very center of the group within some 60 kpc area. The velocity dispersion of the whole group is rather moderate, 417 km/s according to Mahdavi & Geller (2001).
| NGC | 3607 | 3608 |
|---|---|---|
| Type (NED1) | SA(s)0* | E2 |
| , kpc (LEDA2) | 15.2 | 10.5 |
| (RC33) | 10.79 | 11.69 |
| (LEDA) | –19.84 | –19.46 |
| (RC3) | 0.92 | 0.93 |
| (RC3) | 0.49 | 0.40 |
| (NED), | 935 | 1253 |
| Distance, Mpc | ||
| Inclination (LEDA) | ||
| PAphot (LEDA) | ||
| , (LEDA) | 217 | 204 |
| 1NASA/IPAC Extragalactic Database | ||
| 2Lyon-Meudon Extragalactic Database | ||
| 3Third Reference Catalogue of Bright Galaxies | ||
| 4Tonry et al. (2001) | ||
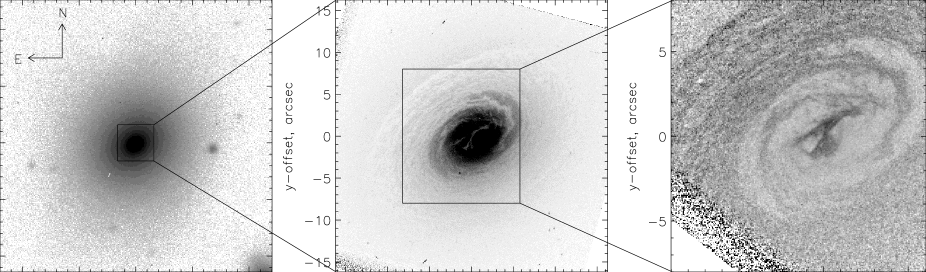
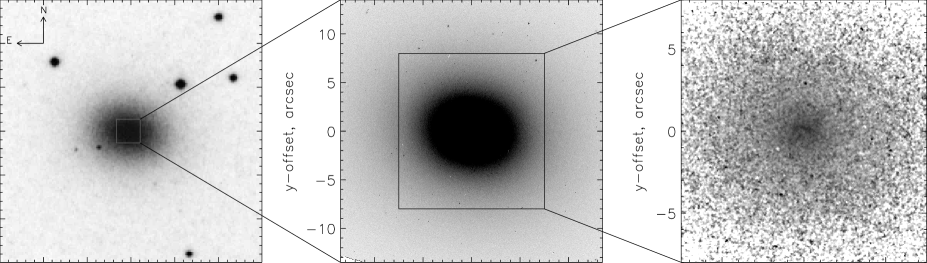
The main characteristics of the galaxies to be considered in the present paper are given in Table 1. NGC 3607 is a giant lenticular galaxy located in the center of the Leo II group. Hot X-ray gas is detected inside this galaxy (Terashima et al., 2002), as well as around it (Biermann, Kronberg, & Madore, 1982) – all three galaxies in the center of the group are embedded into the common envelope of hot gas. An X-ray atlas of Mulchaey et al. (2002) demonstrates two maxima of the hot gas concentration – one at NGC 3607 and another at NGC 3608 – which fact forces authors to suggest a recent assembly of the Leo II group. Also NGC 3607, though of early type, is known to have a rather extended ionized-gas disk (Shields, 1991; Macchetto et al., 1996) with a radius of ( kpc) containing a broad dust ring between and (Singh et al., 1994). Central structure of the neighbouring low-luminosity elliptical galaxy NGC 3608 is also very interesting: it has a counterrotating core. From their long-slit cross-section taken along the major axis of NGC 3608 Jedrzejewski & Schechter (1988) found that at approximately (1.1 kpc) the stellar rotation changes its sense; the maximum rotation velocity of the inner core, achieved at , was however rather low, of km/s. Carollo et al. (1997) inspected high-resolution images obtained with the WFPC2/HST through two filters, F555W and F814W, for the sample of elliptical galaxies with kinematically decoupled cores. In NGC 3608 they have not found any evidence for a circumnuclear stellar disk presence. Also they claimed that the color is very homogeneous over the central parts of all their sample galaxies, the kinematically decoupled cores being indistinctive from the surrounding stellar bodies. In the particular case of NGC 3608, however, we can suspect a break of by less that 0.1 mag at from their Fig. 1d. Curiously, though either Carollo et al. (1997) nor another investigators do not find any fine morphological substructure in NGC 3608, the global properties of the galaxy look unusual: despite its low luminosity, it is a slow rotator (Jedrzejewski & Schechter, 1988), it is boxy (Bender, Döbereiner, & Möllenhoff, Bender et al.1988), and it has a shallow core profile (Carollo et al., 1997) – a classic set of properties of a giant elliptical. General views of both galaxies are presented by Figs. 1 and 2 where three various fields of view are outlined: the large-scale view of the galaxies, the HST/PC-frame field, and the very central regions which we have observed by means of 2D spectroscopy.
The layout of the paper is as follows. We report our observations and other data which we use in Section 2. In Section 3 two-dimensional velocity fields obtained by means of 2D spectroscopy for the central parts of NGC 3607 and NGC 3608 are presented. The radial variations of the stellar population properties are analysed in Section 4. Section 5 gives discussion and our conclusions.
2 Observations and data reduction
The spectral data which we analyse in this work are obtained with two different integral-field spectrographs. Integral-field spectroscopy is a rather new approach which was firstly proposed by Prof. G. Courtes some 20 years ago – for a description of the instrumental idea see e.g. Bacon et al. (1995). It allows to obtain simultaneously a set of spectra in a wide spectral range from an extended area on the sky, for example, from a central part of a galaxy. In the spectrographs which data we use a 2D array of microlenses provides a set of micropupils which are put onto the entry of a spectrograph. After having reduced the full set of spectra we obtain a list of the following characteristics for the individual spatial elements: fluxes in continuum and in emission lines, line-of-sight velocities, both for stars and ionized gas, and absorption-line equivalent widths which are usually expressed as indices in the well-formulated Lick system (Worthey et al., 1994). This list can be transformed into two-dimensional maps of the above mentioned characteristics for the central part of a galaxy which is studied. Besides the panoramic view benefits, such an approach gives an unique opportunity to overlay various 2D distributions over each other without any difficulties with positioning. In this work we use the data of two 2D spectrographs: the fiber-lens Multi-Pupil Fiber Spectrograph (MPFS) at the 6m telescope of the Special Astrophysical Observatory of the Russian Academy of Sciences (SAO RAS) and the international Tiger-mode SAURON at the 4.2m William Herschel Telescope at La Palma. SAURON is a private spectrograph, but some its raw data are available after expiration for everybody from the Isaac Newton Group Archive in the UK Astronomy Data Center.
The last variant of the MPFS became operational in the prime focus of the 6m telescope in 1998 (http://www.sao.ru/hq/lsfvo/devices/mpfs/mpfs.html). With respect to the previous variant, in the new MPFS the field of view has been increased and the common spectral range has become larger due to using fibers. In 2001–2002 the fibers transmitted light from square elements of the galaxy image to the slit of the spectrograph together with additional 16 fibers that transmitted the sky background light taken 4 arcminutes apart from the galaxy, so that the separate sky exposures were not necessary. The size of one spatial element was approximately ; a CCD TK detector was used before 2003. The reciprocal dispersion was 1.35 Å per pixel, with a spectral resolution of 4–5 Å slightly varying over the field of view. To calibrate the wavelength scale, we exposed separately a spectrum of the hollow cathod lamp filled with helium, neon, and argon; an internal accuracy of linearization was typically 0.25 Å in the green and 0.1 Å in the red, and additionally we checked the accuracy and an absence of systematic velocity shift by measuring strong emission lines of the night sky [OI]5577 and [OI]6300. We obtained the MPFS data in two spectral ranges, the green one, 4300–5600 Å, and the red one, 5900–7200 Å.
The green-band spectra are used to calculate
the Lick indices H, Mgb, Fe5270, and Fe5335 which are suitable
to determine metallicity, age, and Mg/Fe ratio of old stellar populations
(Worthey, 1994). Following the prescriptions of Worthey (1994),
we have observed 15 stars from the list of Worthey et al. (1994)
during four observational runs to calibrate the new MPFS index system
onto the standard Lick one. After that we have calculated the
linear regression formulae to transform our index measurements into the
Lick system. Below we give the regression formulae used by us
for the index calibration into the standard Lick system:
H
Mgb
Fe5270
Fe5335
The comparison of star measurements and the linear calibration dependencies are presented in Fig. 3. The rms scatters of points near the linear dependencies are less than 0.15 Å for 3 indices except Fe5335 for which it is 0.27 Å, so the individual deviations of stars are within observational errors of Worthey et al. (1994).

We would like to stress that we do not degrade the spectral resolution of our spectra. The Lick indices H, Mgb, Fe5270, and Fe5335 are absorption-line equivalent widths by their definition, and equivalent widths of the spectral lines do not depend on spectral resolution: they are integrals, so by degrading the spectral resolution you make the lines shallower but broader, and integrals remain the same. The only restriction is put by the wavelength intervals where the integrals are calculated. The Lick index system is arranged to include the full line width with the Lick spectral resolution, which is in average Å, for the majority of galaxies. Both the MPFS and the SAURON have the better spectral resolution, so in our case the absorption lines under consideration are completely within the wavelength intervals prescribed by the Lick system, so we need no to make something with our spectral resolution. This fact is confirmed by the close coincidence of the instrumental index measurements of the standard stars with the SAURON and the tabular index data from Worthey et al. (1994) (Afanasiev & Sil’chenko, 2002). However, small variations of the continuum shape caused by imperfect spectra calibrations which are individual for every spectrograph may give small systematic deviations of the instrumental indices from the Lick index system, and just this effect is corrected with the calibration formulae given above. In the range of indices used, these corrections do not exceed 0.4 Å for H and Fe5270, and 0.6 Å for Fe5335; for Mgb they are negligible. For the more detailed description of the Lick index measurements with the MPFS and internal accuracy estimates, see the recent paper by Sil’chenko (2006) where the study of the large sample of lenticular galaxies with the MPFS is presented.
To correct the index measurements for the stellar velocity dispersion which is usually substantially non-zero in the centers of early-type galaxies, we have fulfilled smoothing of the spectrum of the standard star, HD 97907, by a set of running Gaussians of various widths; the derived dependencies of index corrections on were approximated by polynomials of 4th order and applied to the measured index values before their calibrations into the Lick system. Due to surface brightness differences between the circumnuclear and more outer part of the bulges, the accuracy of the measured indices falls from 0.1 Å at the center to more than 0.5 Å at the edges of the multi-pupil frame. To support a constant level of the index accuracy along the radii when analysing the stellar population properties, we co-add the individual spectra within circular rings centered onto a nucleus; the typical statistical error of the azimuthally averaged indices is 0.1 Å–0.15 Å (Sil’chenko, 2006).
The green-range 2D spectroscopic observations are also used to cross-correlate galactic elementary spectra with a spectrum of a template star, usually of G8III–K3III spectral type, to obtain in such a way a line-of-sight velocity field for the stellar component and a map of stellar velocity dispersion. The stars are defocused during the observations to take into account the variations of spectral resolution over the field of view. For NGC 3607 in particular, we have calculated the kinematical maps with three templates of different spectral types: HD 73665 (G8III), HD 73710 (G9III), and the main component of STF 1947 (K0III). We have checked that the kinematical maps obtained for NGC 3607 with three different templates do not differ within the errors. The cross-correlation peaks are fitted by Gaussians; the benefits of this approach as opposed to the more popular Fourier Correlation Quotient (FCQ) are thoroughly discussed by Bottema (1988); we would like to stress that the cross-correlation method is not so sensitive to template mismatch as FCQ or direct-fitting methods. The red spectral range contains the strongest optical emission line for LINERS, [NII]6583, so it is used to derive line-of-sight velocity fields for the ionized gas by calculating emission-line baricenter positions for [NII]6583. The accuracy of elementary velocity measurements, both for stars and ionized gas, is about 10 km/s.
The second integral-field spectrograph which data we use in this work is a new instrument, the SAURON, operated at the 4.2m William Herschel Telescope (WHT) on La Palma – for its detailed description see Bacon et al. (2001). We have taken the data for NGC 3608 from the open ING Archive of the UK Astronomy Data Centre. Briefly, the field of view of this instrument is with the spatial element size of . The sky background taken 2 arcminutes from the center of the galaxy is exposed simultaneously with the target. The fixed spectral range is 4800-5400 Å, the reciprocal dispersion is 1.11 Å-1.21 Å varying from the left to the right edge of the frame, and the spectral resolution is about of 4 Å. The comparison spectrum is neon one, and the linearization is made by a polynomial of the 2nd order with an accuracy of 0.07 Å. The index system is checked by using stars from the list of Worthey et al. (1994) which have been observed during the same observational run. The regressions fitting the index system calibration of the February-1999 run when NGC 3608 has been observed are shown in our paper (Afanasiev & Sil’chenko, 2002). The relations between instrumental and standard-system indices are very close to the relation so no corrections are needed to calibrate them into the standard Lick system. The stellar velocity dispersion effect has been corrected in the same manner as for the MPFS data. While to prepare the azimuthally averaged index profiles from the MPFS data we co-added the spectra in the rings, to prepare the SAURON azimuthally-averaged index data which have higher signal-to-noise ratios, we averaged the measured individual-element indices over the same rings so the attached error bars are the errors of the means formally calculated – they are all below 0.03 Å.
The full list of the exposures made for NGC 3607 and NGC 3608 with two 2D spectrographs is given in Table 2. ‘BTA’ means ‘Bolshoi Telescope Azimuthal’ny’, it is an official name of the 6m telescope.
| Date | Galaxy | Exposure | Configuration | Field | Spectral range | Seeing () |
|---|---|---|---|---|---|---|
| 29 Apr 01 | NGC 3607 | 45 min | BTA/MPFS+CCD | 4200-5600 Å | ||
| 09 Mar 02 | NGC 3607 | 45 min | BTA/MPFS+CCD | 5800-7200 Å | ||
| 09 Mar 02 | NGC 3608 | 60 min | BTA/MPFS+CCD | 5800-7200 Å | ||
| 20 Feb 99 | NGC 3608 | 120 min | WHT/SAURON+CCD | 4800-5400 Å |
To analyse the structure of the galaxies and to refine a kinematical analysis, for both galaxies we have retrieved the WFPC2/HST image data from the HST Archive. NGC 3607 was observed in the frame of the program of A. Phillips (ID 5999) on nuclei of S0s, and NGC 3608 was observed in the frame of the program of M. Franx on kinematically decoupled nuclei (ID 5454). For NGC 3607 we have also used the large-scale images taken from the database HYPERCAT/FITS Archive (PI Ph. Prugniel). The details of the photometric observations are given in Table 3.
| Date | Galaxy | Telescope | Filter | Exposure | Seeing | Scale |
|---|---|---|---|---|---|---|
| 7 May 1994 | NGC 3608 | WFPC2/HST | F555W | 500 s | ||
| 7 May 1994 | NGC 3608 | WFPC2/HST | F814W | 230 s | ||
| 6 Nov 1994 | NGC 3607 | WFPC2/HST | F547M | 260 s | ||
| 27 Jan 1996 | NGC 3607 | WFPC2/HST | F555W | 160 s | ||
| 27 Jan 1996 | NGC 3607 | WFPC2/HST | F814W | 160 s | ||
| 6 Feb 1999 | NGC 3607 | 1.2-OHP | 300 s | |||
| 6 Feb 1999 | NGC 3607 | 1.2-OHP | 120 s | |||
| 6 Feb 1999 | NGC 3607 | 1.2-OHP | 120 s | |||
| 6 Feb 1999 | NGC 3607 | 1.2-OHP | 120 s |
All the data, spectral and photometric, except the data obtained with the MPFS, have been reduced with the software produced by Dr. V.V. Vlasyuk in the Special Astrophysical Observatory (Vlasyuk, 1993). Primary reduction of the data obtained with the MPFS was done within IDL with a software created by one of us (V.L.A.). The Lick indices were calculated with our own FORTRAN program as well as by using the FORTRAN program of Dr. A. Vazdekis which provides also the calculation of statistical errors for the indices.
3 Stellar and gaseous kinematics and the structure of the central kiloparsecs


Since the integral-field spectroscopy provides us with two-dimensional
line-of-sight velocity fields, we are able now to analyse both
character of rotation and central structure of the galaxies.
If we have an axisymmetric mass distribution and mean rotation
on circular orbits around the symmetry axis,
the direction of maximum central
line-of-sight velocity gradient (we shall call it ‘kinematical major
axis’) should coincide with the line of nodes of the main symmetry
plane as well as the photometric major axis should do. In the case of
a triaxial shape of potential the isovelocities would tend to align
with the principal axis of the ellipsoid (Vauterin & Dejonghe, 1997, simulations of bars
and references therein). In a general case of triaxial potential
the kinematical and photometric major axes diverge,
showing turns with respect to the line of nodes in opposite senses
if the main axis of the triaxial potential is not strictly aligned
with the line of nodes (Monnet, Bacon, & Emsellem, 1992; Moiseev & Mustsevoy, 2000).
In the simplest case of thin-disk rotation we have a convenient
analytical expression for the azimuthal dependence of the central
line-of-sight velocity gradients within the area of solid-body rotation:
,
where is the deprojected central angular rotation velocity, is the inclination of the rotation plane, and is the orientation of the line of nodes of the rotation plane. In more complex three-dimensional cases the validity of the formula above is not so evident; however the observed dependencies of on also look harmonic as one can see in Figs. 4 and 5. Perhaps, it results from symmetry properties that vertical and radial velocity components vanish after integrating along the line of sight. At least it was shown that axisymmetric oblate spheroids demonstrate zero line-of-sight velocity gradients along their minor axes (Binney, 1985) and the maximum rotation along their major axes (Bacon, 1985). So by fitting azimuthal variations of the central line-of-sight velocity gradients by a cosine law, we can check the axisymmetry of the mass (stellar?) distribution and to determine the orientation of the kinematical major axis as its phase and the central angular rotation velocity as its amplitude. It is our main tool for kinematical analysis.
3.1 NGC 3607
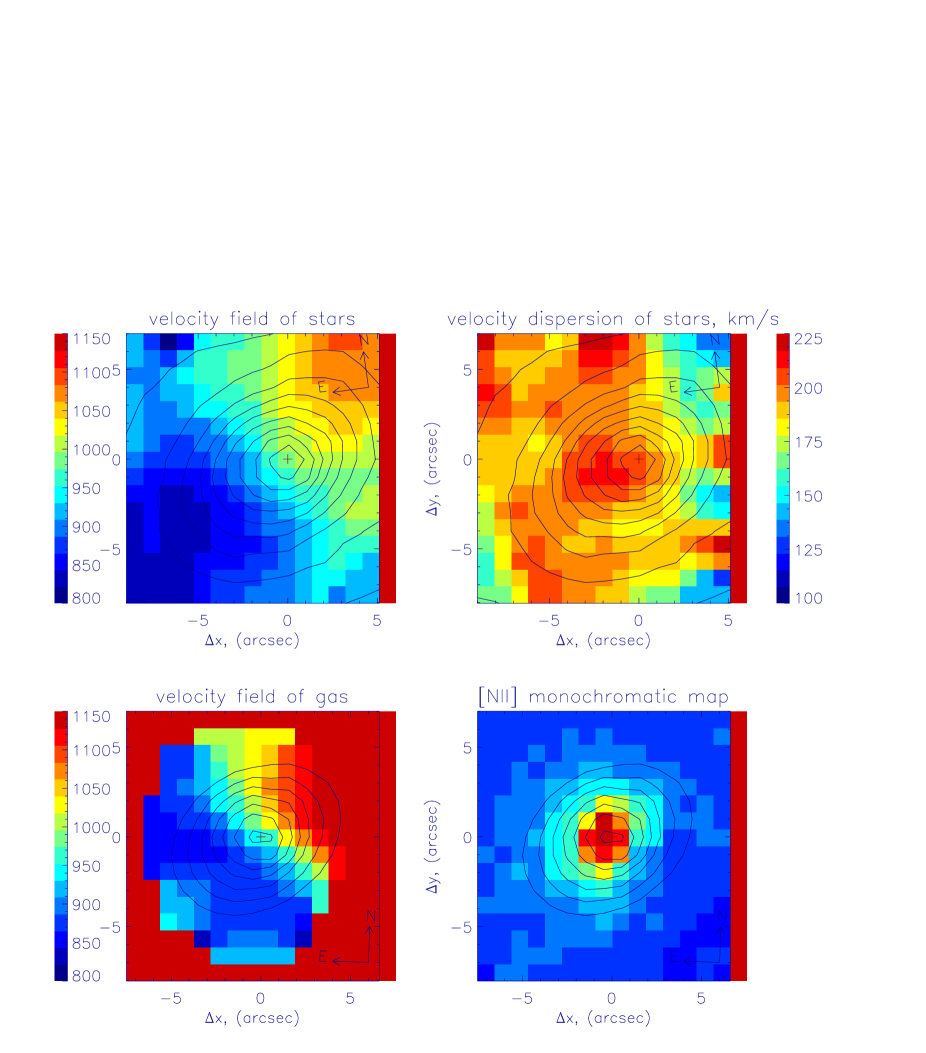
Figure 6 presents mostly kinematical maps for the central part of NGC 3607. Both stars and ionized gas demonstrate regular, almost rigid-body rotation with their kinematical major axes close to the photometric major axis. The gas rotation is twice faster than that of the stars: the central angular rotation velocity is km/s/arcsec whereas km/s/arcsec. Let us to note that if the inclination given by LEDA for the symmetry galactic plane and derived from the large-scale disk axis ratio, (Table 1), is correct, it means that the central gas rotates at a speed of 800 km/s/kpc. However, below we should recognize that it is rather difficult to determine precise orientation(s) of the rotation plane(s) in the center of NGC 3607. The stellar velocity dispersion has a peak near the nucleus. In our data this stellar velocity dispersion maximum area is not exactly centered onto the nucleus that may be a real effect due to the asymmetric dust distribution in the center of the galaxy; this maximum area seems to be extended in the direction of the isophote minor axis.


To check our 2D mapping of the line-of-sight velocities, we have simulated one-dimensional cross-sections of the velocity fields of Fig. 6: a band aligned with the major axis has been overposed onto the maps and the velocity and dispersion velocity values inside this band have been derived and averaged over the elements. We have compared the simulated LOS velocity and stellar velocity dispersion profiles with the long-slit data along the major axis of NGC 3607 which we have found in the literature (Fig. 7 and 8). One can see that the agreement of the velocity profiles is rather good. However, the literature data do not support the shift of the velocity dispersion peak with respect to the photometric center. Also, perhaps the slope of the ionized gas velocity profile in our data may be slightly underestimated due to moderate seeing quality of the observations of March 2002. The maximum gas rotation velocity, km/s at which may be transformed into 450 km/s under , seems to be enormous; but this result is confirmed by recent CO observations of NGC 3607 according to which of the molecular gas within rotates at a speed of 250 km/s (Welch & Sage, 2002). Interestingly, in the integrated molecular-line profile only a receding horn is well seen – the asymmetry is quite similar to that of the Fig. 6 (the lower left). The stellar velocity profile of Fig. 7 reveals a prominent rotation velocity maximum at after which the rotation velocity drops by a factor of toward . Such behaviour may be treated as a kinematically distinct core in the center of NGC 3607; let us to note that the maximum rotation radius coincides exactly with the border of the magnesium-enhanced structure (see the next Section).


The enormous rotation velocity, which we have measured in the center of NGC 3607 and which implies a mass concentration of more than within kpc, provokes some doubts about a circular (axisymmetric) character of rotation. We can check it by comparing kinematical and photometric major axis orientations; it is done in Fig. 9. Our first impression from inspecting Fig. 6 is that the kinematical and photometric major axes coincide; the Fig. 9 confirms this impression by quantifying it. At , or more exactly in the radius range of , within the decoupled core area, where the rotation is still almost solid-body, the kinematical major axes of the ionized gas and of the stars, as well as the photometric major axes of the continuum brightness distribution are all close to the global line of nodes of the galaxy, . This fact agrees with an axisymmetric character of rotation with the spin orthogonal to the main symmetry plane of the galaxy – a classic configuration corresponding to the SA0-type of NGC 3607. But inside ALL THE AXES – both the kinematical ones and the photometric one – seem to turn toward larger , the turn of the gas kinematical major axis being the most prominent. We have estimated an orientation of the innermost isophotes of [NII] emission distribution in Fig. 1f of Shields (1991) – it is , very close to our measurements of the [NII] emission-line brightness distribution elongation at . The gray-scaled emission brightness map provided by Macchetto et al. (1996)) confirms also the turn of the innermost emission isophotes toward larger . The concordance of the photometric major axis provided by the HST data and the kinematical major axis of the ionized gas near at implies axisymmetry. But the rotation plane of the innermost, , part of the galaxy, and so that of circumnuclear disk probably, appears to be inclined to the main symmetry plane of NGC 3607, while the more outer gas rotates in the global galactic plane together with the stars. The latter fact rejects an external origin of the decoupled central spin; there must be own intrinsic peculiarities of NGC 3607 to provide such kinematical appearance. Figure 10 shows radial variations of the isophote characteristics in NGC 3607 at larger scales than Fig. 9 does. The isophote major axis position angle remains almost constant all along the radius. But the ellipticity behaviour is indeed strange: it reaches a main maximum of 0.3 at the border of the decoupled core, at , then it reaches a secondary maximum of 0.2 at , and after that it falls to at . The formal inclination of the global galactic disk, (LEDA), corresponds only to by assuming infinitely thin disk. Let us also to note that the radius of the minimal ellipticity, , coincides with the boundary between the bulge and the global disk of NGC 3607: according to Baggett, Baggett, & Anderson (1998), in NGC 3607 the bulge dominates at and the exponential disk – at larger radii. The ellipticity behaviour at is roughly consistent in all filters, so it is not an effect of dust. We must conclude that the bulge of NGC 3607 cannot be an axisymmetric (oblate) spheroid if to require its symmetry plane to coincide with the disk plane, otherwise its visible ellipticity should be smaller than that of the more thin disk. It has to be triaxial at a scale of a few kiloparsec.
3.2 NGC 3608

To analyse the stellar kinematics of the central part of NGC 3608 we have used the SAURON data reduced by us with our tools. Recently the stellar kinematical maps for NGC 3608 have been published by Emsellem et al. (2004) together with the maps of LOSVD higher moments and ; the SAURON team has applied its own method to analyze these data which is quite sophisticated. The quantitative agreement of the LOS velocity fields obtained by us and by Emsellem et al. (2004) is perfect; our stellar velocity dispersion measurements being qualitatively similar are systematically lower by about of 40 km/s. In the further discussion we use mainly the morphology of the stellar velocity dispersion distribution, so the precise absolute values of are not so important in this particular work.
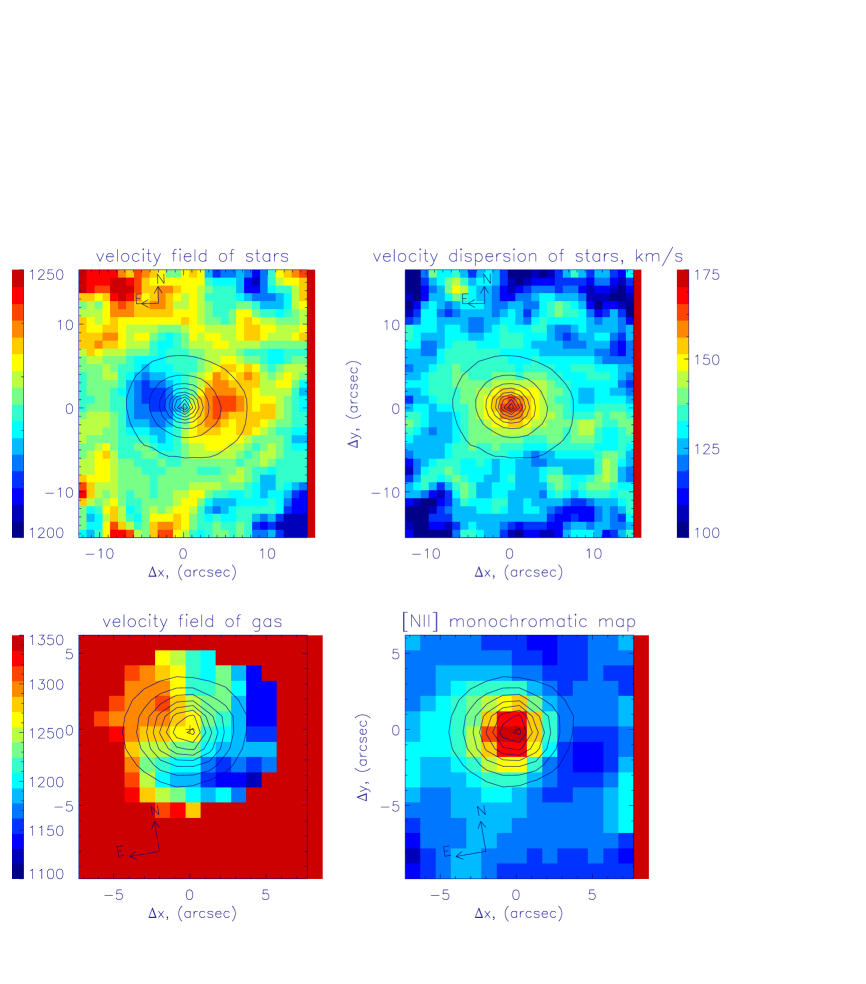
In Fig. 11 one can see the comparison of the LOS velocity fields for the stars and for the ionized gas. It reveals indeed a central counterrotating stellar subsystem with the kinematical major axis close to the major axis of the inner isophotes – it is the kinematically decoupled core reported by Jedrzejewski & Schechter (1988). The ionized-gas velocity field (Fig. 11, bottom) reveals a strong twist of isovelocites over the whole measured velocity field. The amplitude of the circumnuclear azimuthal variations of the gas line-of-sight velocity gradient is km/s/arcsec – even higher than in NGC 3607. The phase of the cosine curve fitting the azimuthal variations of the central gas line-of-sight velocity gradients within is shifted by with respect to the line of nodes of the stellar rotation. As the nucleus of NGC 3608 is inactive and radio-quiet, we would disregard a hypothesis of outflow and would claim rather a kind of strongly inclined gaseous ring with a radius of pc. In Fig. 12 we compare the orientations of the kinematical and photometric major axes, for the stars and for the ionized-gas emission [NII]6583. The kinematical and photometric major axes of the stellar component coincide that implies an axisymmetric rotation. However both major axes begin to deviate from the of outer isophotes, , in a systematic way when approaching the very center. Meantime, the major axes of the [NII] emission brightness distribution and of the ionized-gas velocity field are turned strongly with respect to the stellar configuration at , or within the kinematically decoupled area. The spatial resolution of our red-band MPFS exposures is rather moderate, so the measurements inside are strongly affected by the seeing effect. From the published HST data analysis (Tomita et al., 2000) we know that in the center of NGC 3608 the dust ring with the radius of is roughly aligned with the outer-isophote orientation, (or ) (see also our Fig. 2, right plot). Since the dust and the gas are related, the orientation of the circumnuclear gas plane must also be close to the line of nodes, so one may extrapolate our measurements back to the line of nodes inside . Strong twist of both the photometric and kinematical major axes for the gas component at , though being obviously smoothed by the seeing effect, implies neverthless an existence of a kind of polar gas rotation in the above-mentioned radius range.


Figures 13 and 14 demonstrate simulated major- and minor-axis cross-sections of the stellar LOS velocity and velocity dispersion fields in the center of NGC 3608 in comparison with published long-slit data. The agreement of our cuts with the literature long-slit data is satisfactory though the systematic shift of our stellar velocity dispersion measurements by km/s can be also seen. We would note that systematic differences of a few dozen kilometre per second are still common for stellar velocity dispersion measurements. For example, in the recent study of 48 early-type galaxies by Emsellem et al. (2004) the individual differences between the measured -aperture stellar velocity dispersions and the literature data reach 40 km/s (see their Fig. 3). Partly this uncertainty may be due to using different methods to derive kinematical information from the absorption-line spectra: various methods are sensitive to signal-to-noise ratio and to template mismatch by various degree. However bhsdisp have shown that even using the same method over the data of similar quality does not save the matter: the stellar velocity dispersion estimates made over different spectral ranges may differ by 20–30 km/s. So we would not refer to the exact absolute values of , but rather would analyse their relative variations over the field of view.
Besides the overall check of the quality of our velocity measurements, Figs. 13 and 14 confirm once more that the edge of the kinematically decoupled stellar core is located at and, as we shall see in the next Section, coincides roughly with the border of the magnesium-decoupled core. But the kinematical analysis does not leave a possibility to treat the decoupled core as a compact stellar disk. The low ratio, , and a pattern of the stellar velocity dispersion distribution – an extended maximum clearly seen in the stellar velocity dispersion map (Fig. 11, top right) – allow to suggest a triaxiality of the decoupled core. In such configuration the polar rotation of the ionized gas becomes explicable: we often meet circumnuclear polar gaseous disks in galaxies with triaxial bulges or within bars – e. g. in NGC 2841 (Sil’chenko, Vlasyuk, & Burenkov, Silchenko et al.1997; Afanasiev & Sil’chenko, 1999), in NGC 6340 (Sil’chenko, 2000), in NGC 7280 (Afanasiev & Sil’chenko, 2000), in NGC 4548 (Sil’chenko, 2002), etc.
4 Chemically decoupled cores in NGC 3607 and NGC 3608
4.1 NGC 3607
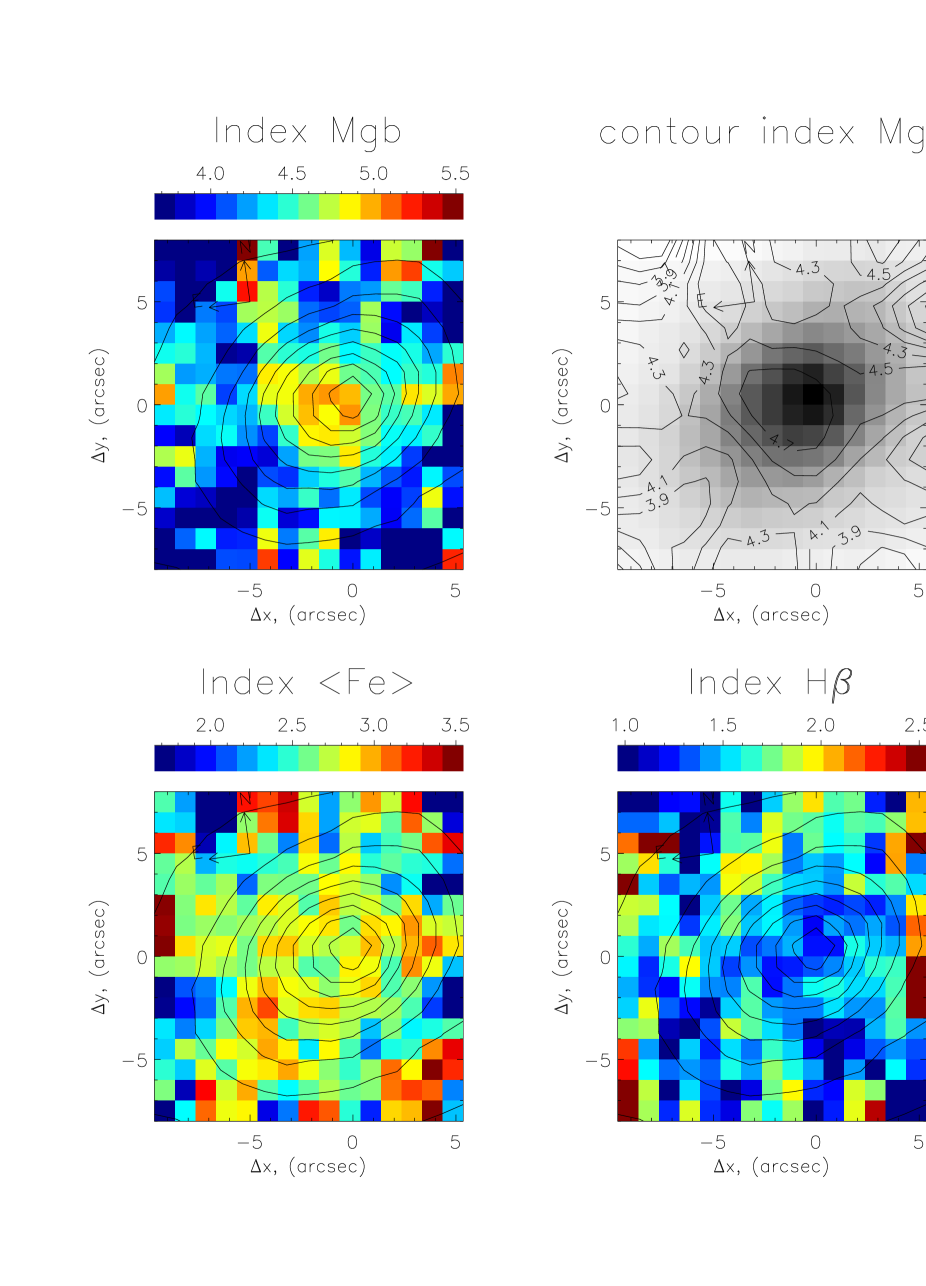
Figure 15 presents Lick index maps for the central part of NGC 3607 constructed from the MPFS 2D spectral data. The Mgb map reveals a certain presence of chemically decoupled core; this finding is not very unexpected because NGC 3607 has been earlier listed by us as a good candidate for possessing a chemically distinct nucleus (Sil’chenko, 1994). Interestingly, the (Fe5270+Fe5335)/2 and H absorption line index maps look rather homogeneous and do not demonstrate any sharp features. Perhaps, one can note a very shallow unresolved minimum near the photometric center of the galaxy and similarly shallow extended H minimum aligned with the major axis of the isophotes; the latter feature may be associated to the circumnuclear ionized-gas disk mentioned in the Introduction and is probably resulted from the emission contamination of the H absorption line. Interestingly, all the central peculiar features of the index distributions are centered slightly below and to the left from the photometric center showing the same shift as the stellar velocity dispersion. However, both (Fe5270+Fe5335)/2 and H absorption-line index minima are marginal, and the Mgb peak is much more prominent than the other details. It seems to be resolved; moreover, it seems to be elongated along the minor axis of the isophotes. To derive the orientation of the magnesium-enhanced core, we have smoothed strongly the Mgb map and have drawn isolines of the smoothed Mgb distribution (Fig. 15, top right). Indeed, the magnesium-enhanced core is elongated in though the Mgb isolines do not look as quite symmetric ovals. The orientation of the magnesium-enhanced area hints that we see some stellar substructure with its alignment along the minor axis of the isophotes – some kind of minibar or so. But in fact, the Mgb-index distribution morphology alone is not enough to make a conclusion about the nature of the magnesium-enhanced core. The visible elongation of the magnesium-enhanced core may be a result of a magnesium depression along the major axis, similar to that of the H index, which may be caused by a very young stellar disk aligned with the major axis. To make a definite conclusion, a further analysis of the stellar population age in the area of magnesium-enhanced core is needed.

To quantify peculiarities of the absorption-line index distributions in the center of NGC 3607, we have calculated azimuthally averaged radial profiles of the indices and have compared them to the ‘zero-dimensional’ and one-dimensional spectral data published earlier by Proctor (2002), Trager et al. (1998), and Fisher, Franx, & Illingworth (Fisher et al.1996) (Fig. 16). Though the long-slit data were taken along the major or minor axis of NGC 3607 and so were not obliged to agree exactly with our azimuthally averaged measurements, they confirm the overall shape of the index radial dependencies: a rather flat iron profile, an H profile with a shallow minimum in the center, and a magnesium-distinct core with the radius of . A moderate, by 0.2 Å–0.4 Å, systematic difference of our H and Mgb profiles with the data of (Fisher et al.1996) can also be noted. To check if these shifts may be due to a lack of azimuthal symmetry, we have simulated one-dimensional major-axis cross-sections of our index maps and have also plotted the simulated results in Fig. 16. Indeed, the simulated major-axis Mgb profile has a much better agreement with the Fisher’s et al. data than the azimuthally averaged measurements. As for the H index profiles, the simulated major-axis profile and the azimuthally averaged one have coincided almost perfectly, implying an orientation of the ionized-gas disk far from edge-on. We must conclude that the systematic shift of 0.2 Å between our measurements of the H index and those of Proctor (2002) and (Fisher et al.1996) exists really. Meantime, the centered aperture measurements by Trager et al. (1998) which are a Lick-system etalon confirm rather our calibration.

Due to progress in evolutionary population synthesis during last years, we can now estimate mean stellar population characteristics by confronting different absorption-line indices to each other. Figure 17 presents an ‘iron-vs-magnesium’ diagram where we compare our azimuthally averaged MPFS data for the central part of NGC 3607 with the models of Thomas, Maraston, & Bender (2003) which are calculated for several values of magnesium-to-iron ratio. The loci of the models of various [Mg/Fe] are well separated on the diagram, so from inspecting Fig. 17 we can conclude that the magnesium-to-iron ratio in the center of NGC 3607 is certainly above the solar one. But whereas in the circumnuclear region the [Mg/Fe] is between zero and , perhaps, closer to , the unresolved nucleus is outstanding with its [Mg/Fe]. We must note that, as Fig. 16 demonstrates, the previous Lick index measurements for NGC 3607 do not confirm this jump of [Mg/Fe] at and imply rather constant iron-index behaviour along the radius. Since our estimates of the nuclear indices are confined to a single spatial element, we cannot insist that the low Fe5270 value in the unresolved nucleus is not a random artifact. So over all the center of NGC 3607 we assume [Mg/Fe] to be between and .

Several investigators, e.g. González (1993) or Terlevich & Forbes (2002), noted that in order to overcome an effect of the non-solar magnesium-to-iron ratio when determining a mean age of stellar population, one must use a combined index [MgFe]. So in Fig. 18 we confront [MgFe] to H and compare our azimuthally averaged data for NGC 3607 with two sets of models – for [Mg/Fe] and for [Mg/Fe]. As it has been promised by our choice of the metal-line index, the age estimates are robust to the varying choice of the model [Mg/Fe]; they are equal to about 10-12 Gyr. The nucleus is again outstanding, probably, due to the Balmer emission concentration in the very center of the galaxy and obvious H emission contamination. But beyond the nucleus the age gradient along the radius is non-detectable: at the diagram ‘H, [MgFe]’ the index variations occur along the model sequence of equal age, namely, of Gyr. We may suspect that the real mean age of the stellar population in NGC 3607 is slightly lower than 10–12 Gyr, because the ionized-gas disk is known to extend up to (Shields, 1991; Macchetto et al., 1996) and therefore the Balmer emission may contaminate the absorption-line H index in some degree all the way. However, our measurements of the [OIII]5007 emission-line equivalent width in the nucleus and in the summed spectrum of its nearest outskirts () have given 0.7 Å for the former and 0 Å for the latter, so the effect of contamination of the H index by emission must be strong only for the nucleus. We try to correct it here by using the measurements of the H-emission equivalent width by Ho, Filippenko, & Sargent (1997). To correct the measured Lick index H for the emission we use the well-known fact that the emission line H is always much stronger than the H and the absorption line H is always weaker than the H one, so the equivalent width of the emission line H can be measured more precisely than that of H. Ho et al. (1997) obtained Å for NGC 3607 by subtracting pure-absorption template from the aperture nuclear spectra. Let us to note here that in the nucleus of NGC 3608, another our target galaxy, they saw only a marginal H emission, less that Å, and no emission lines in the green spectral range. The well-established and minimum possible intensity ratio H is known for the radiative excitation of gas by OB-stars (‘HII-region’-type excitation); it is 2.5–2.7. For shock excitation of the gas it is much larger. Ho et al. (1997) have classified the nuclear emission spectrum of NGC 3607 as a LINER, not a ’HII-type’ nucleus. Stasinska & Sodre (2001) have analysed a large heterogeneous sample of integrated spectra of galaxies of various morphological types and have found a good correlation ; we use just this relation to calculate , which is in fact the correction of the Lick index H for the emission. After it has been corrected for the emission contamination of the H index, the nucleus of NGC 3607 has settled to the age sequence of 12 Gyr in the Fig. 18, and any age difference between the nucleus and its outskirts has disappeared. We would like to stress that any significant age break is also absent at the border between the magnesium-enhanced core of NGC 3607 and its ‘bulge’, at .
4.2 NGC 3608

Figure 19 presents the Lick index maps for NGC 3608, similar to those presented for NGC 3607 in Fig. 15, but calculated from the SAURON data, so instead of the combined iron index (Fe5270+Fe5335)/2 we give here only the Fe5270 surface distribution. We can note a qualitative resemblance of the index distributions in both galaxies: just as we have seen in NGC 3607, in its elliptical neighbour the magnesium index demonstrates a prominent extended peak in the center, and the iron index shows a flat, homogeneous distribution. However, the isolines of the smoothed Mgb distribution (Fig. 19, top right) are elongated in , or along the global major axis of NGC 3608 (see Table 1), conversely to NGC 3607 where the magnesium isolines are aligned with the minor axis of the isophotes. The ellipticity of the Mgb isocontours within is very high, 0.33, which value exceeds the isophote ellipticity anywhere in the galaxy, . Recently the SAURON team has published their own results of the reduction of the same data (Kuntschner et al., 2006). Though not quantified in detail, these results have also implied the extended magnesium-enhanced region in the center of NGC 3608 with the ellipticity of Mgb-isolines higher than the ellipticity of the isophotes.

In Fig. 20 we present azimuthally averaged Lick index profiles and their comparison to the literature data. The shapes of the profiles are qualitatively similar to those in NGC 3607 (Fig. 16). Perhaps, the magnesium-enhanced core is somewhat more compact: we would put its border at . The break of the Mgb-profile slope at this radius is clearly seen: between and the Mgb index changes by 0.8 Å, whereas beyond approximation of the azimuthally-averaged measurements by a linear fit gives the slope of Å per arcsec, or almost negligible, and an intercept of Å – compare to the measured central Mgb value of 5.09 Å. Let us to remind that the maximum rotation velocity of the counterrotating core is also achieved near (Jedrzejewski & Schechter, 1988), so in the case of NGC 3608 we deal with a dynamically and chemically decoupled core, just as in the case of another elliptical galaxy NGC 4365 (Bender & Surma, 1992). The Fe5270 measurements are in good agreement with the minor-axis long-slit data of Proctor (2002) and with central aperture data of Trager et al. (1998), so we may conclude that in the SAURON data of February 1999 for NGC 3608 the systematic offset of the Fe5270 calibration by 0.4 Å seen in the later data, e.g. for NGC 3384 (de Zeeuw et al., 2002; Sil’chenko et al., 2003), is probably absent. However, there may be a small systematic shift, by some Å, of the H calibration.

With these azimuthally averaged Lick index profiles, we would try to estimate radial variations of the mean characteristics of stellar population in the center of NGC 3608 by using index–index diagrams. In Fig. 21 (top) we compare the SAURON index radial variations with the models of Thomas et al. (2003) for [Mg/Fe] at the diagram ‘Fe5270, Mgb’. The agreement looks rather good: both chemically decoupled core and its outskirts have [Mg/Fe]. So to determine a mean stellar age in this galaxy, we must take the models with just this magnesium overabundance. Figure 21 (bottom) shows the comparison of the azimuthally averaged Lick index data for NGC 3608 with the models of Thomas et al. (2003) for [Mg/Fe] at the diagram ‘H, Mgb’. Again, as in the case of NGC 3607, we do not detect any age gradient along the radius: the data sequence follows the model sequence of equal age, this time it lies between the model age sequences of Gyr and Gyr. Since the emission lines are very weak in the center of NGC 3608 (in particular, we have failed to detect noticeable [OIII]5007 emission line in the green SAURON spectra), we think that this age estimate, Gyr, is close to the real value. Similarly to NGC 3607, NGC 3608 does not reveal any age break at the transition point from the magnesium-enhanced core to the rest of the galaxy. The moderate metallicity difference of is however clearly detected between the nucleus, , and the ‘non-core’ stellar body, (Fig. 21, bottom).
Let us to note that if the systematic shift of the H calibration by some Å is real, this would result in the age underestimation by some 4 Gyr. For example, Proctor (2002) has found for the center of NGC 3608 the mean stellar age of Gyr, although the abundance characteristics, [Mg/Fe] and [m/H] in the nucleus and in the ‘bulge’, given by him coincide with our estimates. Similarly, if for NGC 3607 the H index calibration by (Fisher et al.1996) and Proctor (2002) is more correct than ours, it would mean that we overestimate the mean stellar age in the center of NGC 3607 by the same 4 Gyr. So we do not insist on the absolute values of the age estimates obtained here. The main result of this consideration is that the relative ages do not show noticeable variations along the radii within some from the nuclei in both galaxies, and particularly, that there are no age drops or rises at the borders of the magnesium-enhanced cores.
5 Discussion
After a thorough study of the central regions of the brightest galaxies of the Leo II group, the nearest to the center of the group, NGC 3607 and NGC 3608, we note a kinematically distinct area in the center of the former and confirm a presence of the counterrotating core in the latter. The presence of the counterrotating stellar core in NGC 3608 had been reported by Jedrzejewski & Schechter (1988); a fall of the rotation velocity after the circumnuclear maximum at in NGC 3607 was noted by Fisher (1997). Both kinematically decoupled cores have appeared to be also distinguished by a higher magnesium absorption-line strength, but do not differ from their outskirts as concerning Fe5270 () or H.
The most popular hypothesis of the kinematically decoupled core origin is a hypothesis of smaller elliptical satellite sinking (Kormendy, 1984; Jedrzejewski & Schechter, 1988; Balcells & Quinn, 1990): the smaller ellipticals have denser cores that can survive during accretion onto a giant galaxy. Later, when Bender & Surma (1992) have found that the kinematically decoupled core of NGC 4365 is also magnesium-enhanced, the locations of the decoupled rotation and the magnesium enhancement being coincident, they have suggested that the decoupled core of NGC 4365 has been formed in a secondary star formation burst after a dissipative minor merger and subsequent gas accumulation in a circumnuclear disk. Taking in mind that NGC 3607 and NGC 3608 resemble NGC 4365 as concerning kinematically decoupled, magnesium-enhanced cores, for our two galaxies we would however reject both hypotheses on the decoupled core origin mentioned above. The decoupled cores of NGC 3607 and NGC 3608 cannot be accreted small ellipticals because the galaxies have peaks of the stellar velocity dispersion and of the magnesium-line strength just in the centers of the decoupled cores. Meatime in the frame of the dissipationless accretion scenario the satellite light must dominate in the center of the merger product and so must demonstrate a lower metallicity in the center than that of the giant hosts, and the velocity dispersion must have a dip (Balcells & Quinn, 1990). But the scenario of Bender & Surma (1992) is also inapplicable: in the frame of the dissipative merger hypothesis, the formation of metal-enriched stars must proceed in a circumnuclear disk, and in the cases of NGC 3607 and NGC 3608 we have proved that the magnesium-enhanced structures are not disks. In both galaxies the areas of the maximum stellar velocity dispersion are elongated. Dynamical simulations show that in a triaxial potential the high velocity dispersion areas must have an oval shape and to be aligned with the model bars (Vauterin & Dejonghe, 1997). The association of the magnesium-enhanced areas in NGC 3607 and NGC 3608 with some ellipsoidal bodies is confirmed also by absence of disk-like rotation, when tracing the photometric major axes of these structures. In NGC 3607 the magnesium-enhanced circumnuclear feature is elongated directly to the kinematical major axes of the stars and of the ionized gas – evidently, it is orthogonal to the circumnuclear disk major axis. In NGC 3608 the stellar rotation, though proceeding with the expected spin orientation, is too slow for the visible ellipticity of the magnesium-index isolines. If we attribute the Mgb-isoline ellipticity, 0.33, to a hypothetical circumnuclear disk, then the minimum ratio appropriate to oblate spheroids or disks would be 0.7 (Illingworth, 1977), and we have in the center of the galaxy. The ionized gas rotates in the polar plane with respect to the stellar rotation in the very center of the galaxy. So we conclude that the chemically decoupled cores in NGC 3607 and NGC 3608 look like small magnesium-enriched triaxial structures with some kinds of polar disks around them – only gaseous one in NGC 3608 and stellar-gaseous one in NGC 3607. We think that such a configuration may be possible if occurs inside a global triaxial spheroid.
Though NGC 3607 is classified as S0, some investigators, e.g. Jedrzejewski & Schechter (1988), thought it to be an elliptical capturing its diffuse outer envelope from NGC 3608 during their interaction. Perhaps, there exists a principal difference between formation of the decoupled cores in elliptical and disk galaxies. In disk galaxies the chemically decoupled structures are indeed circumnuclear stellar disks in the most cases. When we have found such structures in the lenticular galaxies NGC 1023 (Sil’chenko, 1999) and NGC 3384 (Sil’chenko et al., 2003), we have noted that they are distinguished by a higher strength of both magnesium and iron absorption lines, the iron-index enhancement being spatially more extended than that of the Mgb. We then concluded that the secondary star formation bursts having produced the decoupled cores were brief and effective in the unresolved nuclei, resulting in their increased [Mg/Fe], and prolonged during at least a few Gyr in the circumnuclear disks. In the centers of NGC 3607 and NGC 3608 which may accrete gas from a 3D quasi-spherical hot halo, and not from an outer fast-rotating disk nor from a supergiant flat gaseous ring as it was the case of Leo I group, there were no perhaps initial favourable conditions for disk formation. Under spheroidal burst geometry, its duration was short, and only magnesium enhancement had a time to be imprinted into the secondary stellar populations.
An interesting detail is the absence of the mean age difference between the decoupled cores and the main bodies of NGC 3607 and NGC 3608. In disk galaxies, including the above mentioned lenticulars NGC 1023 and NGC 3384, the chemically decoupled cores are always ‘younger’ than the bulges, the mean (luminosity-averaged) stellar age of the nuclei being 3–7 Gyr versus 10–15 Gyr of the bulges. It implies that the secondary star formation bursts producing the decoupled cores in the disk galaxies are rather recent. In NGC 3607 and NGC 3608 the decoupled cores do not seem to be distinguished by a younger mean age of the stellar population. Proctor (2002) who studied radial profiles of the stellar population properties along the minor axes of NGC 3607 and NGC 3608 with the long-slit spectra has not found any age breaks at too. Finally, Davies et al. (2001) who study 2D distributions of the stellar population properties in the center of NGC 4365, the elliptical galaxy with kinematically decoupled core, have not also found any age difference between the core and its broad outskirts, both being rather old, Gyr. Such age ‘homogeneity’ is in some contradiction with the hypothesis of the secondary nuclear star formation burst having produced the decoupled cores. However it can be explained by an older age of the decoupled cores in elliptical galaxies: as the photometric and spectral evolution becomes very slow at larger ages, one needs a very high precision of the measured Lick indices to detect an age difference of a few Gyr when both decoupled cores and their outskirts are older than, say, 8 Gyr. When a larger statistics on the ages of decoupled cores in elliptical galaxies become available, this idea would be checked more carefully.
6 Acknowledgements
We thank Dr. A. V. Moiseev of the Special Astrophysical Observatory of the Russian Academy of Sciencies for supporting the observations at the 6m telescope. The 6m telescope is operated under the financial support of Science Ministry of Russia (registration number 01-43). During the data analysis we have used the Lyon-Meudon Extragalactic Database (LEDA) supplied by the LEDA team at the CRAL-Observatoire de Lyon (France) and the NASA/IPAC Extragalactic Database (NED) which is operated by the Jet Propulsion Laboratory, California Institute of Technology, under contract with the National Aeronautics and Space Administration. The research is partly based on the data taken from the ING Archive of the UK Astronomy Data Centre and on observations made with the NASA/ESA Hubble Space Telescope, obtained from the data archive at the Space Telescope Science Institute, which is operated by the Association of Universities for Research in Astronomy, Inc., under NASA contract NAS 5-26555. The study of the evolution of galaxies in groups is supported by the grant of the Russian Foundation for Basic Researches 04-02-16087.
References
- Afanasiev & Sil’chenko (1999) Afanasiev V.L., Sil’chenko O.K., 1999, AJ, 117, 1725
- Afanasiev & Sil’chenko (2000) Afanasiev V.L., Sil’chenko O.K., 2000, AJ, 119, 126
- Afanasiev & Sil’chenko (2002) Afanasiev V.L., Sil’chenko O.K., 2002, AJ, 124, 706
- Bacon (1985) Bacon R., 1985, A&A, 143, 84
- Bacon et al. (1995) Bacon R., Adam G., Baranne A., Courtes G., Bubet D., et al., 1995, A&AS, 113, 347
- Bacon et al. (2001) Bacon R., Copin Y., Monnet G., Miller B.W., Allington-Smith J.R., et al., 2001, MNRAS, 326, 23
- Baggett et al. (1998) Baggett W.E., Baggett S.M., Anderson K.S.J., 1998, AJ, 116, 1626
- Balcells & Quinn (1990) Balcells M., Quinn P.J., 1990, ApJ, 361, 381
- Bender & Surma (1992) Bender R., Surma P., 1992, A&A, 258, 250
- (10) Bender R., Döbereiner, Möllenhoff C., 1988, A&AS, 74, 385
- Biermann et al. (1982) Biermann P., Kronberg Ph.P., Madore B.F., 1982, ApJ, 256, L37
- Binney (1985) Binney J., 1985, MNRAS, 212, 767
- Bottema (1988) Bottema R., 1988, A&A, 197, 105
- Caon et al. ( 2000) Caon N., Macchetto D., Pastoriza M., 2000, ApJS, 127, 39
- Carollo et al. (1997) Carollo C.M., Franx M., Illingworth G.D., Forbes D.A., 1997, ApJ, 481, 710
- Davies et al. (2001) Davies R.L., Kuntschner H., Emsellem E., Bacon R., Bureau M., et al., 2001, ApJ, 548, L33
- Emsellem et al. (2004) Emsellem E., Cappellari M., Peletier R.F., McDermid R.M., Bacon R., et al., 2004, MNRAS, 352, 721
- Fisher (1997) Fisher D., 1997, AJ, 113, 950
- (19) Fisher D., Franx M., Illingworth G., 1996, ApJ, 459, 110
- Giuricin et al. (2000) Giuricin G., Marinoni C., Ceriani L., Pisani A., 2000, ApJ, 543, 178
- González (1993) González J.J., 1993, Ph.D. Thesis
- Ho et al. (1997) Ho L.C., Filippenko A.V., Sargent W.L.W., 1997, ApJS, 112, 315
- Illingworth (1977) Illingworth G., 1977, ApJ, 218, L43
- Jedrzejewski & Schechter (1988) Jedrzejewski R., Schechter P.L., 1988, ApJ, 330, L87
- Kormendy (1984) Kormendy J., 1984, ApJ, 287, 577
- Kuntschner et al. (2001) Kuntschner H., Lucey J.R., Smith R.J., Hudson M.J., Davies R.L., 2001, MNRAS, 323, 615
- Kuntschner et al. (2006) Kuntschner H., Emsellem E., Bacon R., Bureau M., Cappellari M., Davies R.L., et al., 2006, MNRAS, 369, 497
- Macchetto et al. (1996) Macchetto F., Pastoriza M., Caon N., Sparks W.B., Giavalisco M., Bender R., Capaccioli M., 1996, A&AS, 120, 463
- Mahdavi & Geller (2001) Mahdavi A., Geller M., 2001, ApJ, 554, L129
- Moiseev & Mustsevoy (2000) Moiseev A.V., Mustsevoy V.V., 2000, Astronomy Letters, 26, 565
- Monnet et al. ( 1992) Monnet G., Bacon R., Emsellem E., 1992, A&A, 253, 366
- Mulchaey et al. (2002) Mulchaey J.S., Davis D.S., Mushotzky R.F., Burstein D., 2002, ApJS, 145, 39
- Proctor (2002) Proctor R.N., 2002, Ph.D. Thesis
- Schneider (1985) Schneider S.E., 1985, ApJ, 288, L33
- Schneider (1989) Schneider S.E., 1989, ApJ, 343, 94
- Shields (1991) Shields J.C., 1991, AJ, 102, 1314
- Sil’chenko (1994) Sil’chenko O.K., 1994, AZh, 71, 706
- Sil’chenko (1999) Sil’chenko O.K., 1999, AJ, 117, 2725
- Sil’chenko (2000) Sil’chenko O.K., 2000, AJ, 120, 741
- Sil’chenko (2002) Sil’chenko O.K., 2002, Astronomy Letters, 28, 207
- Sil’chenko (2006) Sil’chenko O.K., 2006, ApJ, 641, 229
- (42) Sil’chenko O.K., Vlasyuk V.V., Burenkov A.N., 1997, A&A, 326, 941
- Sil’chenko et al. (2003) Sil’chenko O.K., Moiseev A.V., Afanasiev V.L., Chavushyan V.H., Valdes J.R., 2003, ApJ, 591, 185
- Singh et al. (1994) Singh K.P., Prabhu T.P., Kembhavi A.K., Bhat P.N., 1994, ApJ, 424, 638
- Stasinska & Sodre (2001) Stasinska G. & Sodre Jr. I., 2001, A&A 374, 919
- Terashima et al. (2002) Terashima Y., Iyomoto N., Ho L.C., Ptak A.F., 2002, ApJS, 139, 1
- Terlevich & Forbes (2002) Terlevich A.I., Forbes D.A., 2002, MNRAS, 330, 547
- Thomas et al. ( 2003) Thomas D., Maraston C., Bender R., 2003, MNRAS, 339, 897
- Tomita et al. (2000) Tomita A., Aoki K., Watanabe M., Takata T., Ichikawa S.-i., 2000, AJ, 120, 123
- Tonry et al. (2001) Tonry J.L., Dressler A., Blakeslee J.P., Ajhar E.A., Fletcher A.B., et al., 2001, ApJ, 546, 681
- Trager et al. (1998) Trager S.C., Worthey G., Faber S.M., Burstein D., González J.J., 1998, ApJS, 116, 1
- Vauterin & Dejonghe (1997) Vauterin P., Dejonghe H., 1997, MNRAS, 286, 812
- Vlasyuk (1993) Vlasyuk V. V., 1993, Astrofiz. issled. (Izv. SAO RAS), 36, 107
- Welch & Sage (2002) Welch G.A., Sage L.J., 2002, ApJ, 584, 260
- Worthey (1994) Worthey G., 1994, ApJS, 95, 107
- Worthey et al. (1994) Worthey G., Faber S.M., González J.J., Burstein D., 1994, ApJS, 94, 687
- de Zeeuw et al. (2002) de Zeeuw P.T., Bureau M., Emsellem E., Bacon R., Carollo C.M., et al., 2002, MNRAS, 329, 513