Physical Parameters and Classification of Eight Galactic Nuclei from the Second Byurakan Survey
Abstract
Accurate spectral parameters estimates are essential to investigate the physical conditions in AGNs. Particularly, intrinsic reddening can be estimated from the / ratio of the narrow line components. The mass of the central black hole can be obtained from the stellar velocity dispersion in the bulge, which can be estimated from the [O III] width, or by the relation between the AGN luminosity and the width of the broad component. Two different luminosity values are important: one derived from the monochromatic 5100 Å, and the integrated luminosity for the broad component of . The spectral parameters are also a fundamental key to obtain a reliable classification. Spectroscopic observations with a resolution of 4.5 Å were performed for a sample of eight galactic nuclei extracted from the Second Byurakan Survey, and one companion galaxy of SBS 1204+505B. The EW and FWHM of the emission lines were measured, and useful line ratios and diagnostic diagrams were used for object classification and reddening estimates. Intrinsic reddening quantities were calculated for all non QSO, i.e. seven objects. Particularly the amount of reddening, B V color excess, extinction coefficient and optical depths in the band, at and wavelengths, and at 5100 Å. The broad line region size was also estimated for seven objects, as well as the central black hole masses. Three mass estimates were usually performed for each object and compared. A peculiar line, probably He I , is detected in the QSO SBS 1626+554. Evidence for a stratified narrow line region is found for the two narrow line Seyfert 1 galaxies included in the sample. A revised classification is proposed for two objects, and the companion galaxy of SBS 1204+505B is reported as a nuclear starburst galaxy.
1 Introduction
The Second Byurakan Survey (SBS) is an objective prism survey of carried out in the 1-m Schmidt telescope of the Byurakan Observatory (Stepanian, 2005). The catalogue is complete at 85% for AGNs brighter than , from which it includes 761 objects: 155 Seyfert (Sy) galaxies, 596 quasi-stellar-objects (QSO) and 10 BL Lac objects.
A considerable effort has been made to classify all the AGNs listed in the SBS. Follow-up spectroscopic observations were carried out with the 6 m telescope of the Special Astrophysical Observatory (SAO, Russia), the 4.5 m Multi-mirror Telescope (MMT, USA), the 2.6 m telescope of the Byurakan Observatory (Armenia), and the 2.1 m telescopes of the Guilermo Haro Observatory and the National Astronomical Observatory in San Pedro Martir (both in Mexico). As a rule, these follow-up observations had spectral resolutions of 5-6 or 10-11 Å over the spectral range of 3300-9000 Å see Stepanian, 2005 for further details. From the 155 Sy galaxies, 38 are classified as broad line Sy 1, 31 as narrow line Sy 1 (NLS1), 25 as Sy 1.5, 8 as Sy 1.9, 44 as Sy 2. The catalogue also includes 90 low ionization nuclear emission-line regions (LINERs), 562 starburst nuclei (SBN) and starburst galaxies (SB), 195 blue compact dwarf galaxies, and 150 H II galaxies
AGNs are classified in two types according to their optical spectra. Type 1 comprises the objects with broad permitted emission lines, and narrow permitted and forbidden lines. Type 2 consists of the objects with only narrow lines. However, in the paradigm of the Unified Model (see review by Antonucci, 1993), the power source and physical conditions are thought to be inherently similar for both types of objects. The differences may arise from the amount of the intrinsic energy output, the angle of vision, and the contribution from luminous young stars.
The intrinsic energy output or luminosity depends on the physical conditions in the inner part of the AGN. Two main quantities determine the energy production rate: the mass of the central black hole (BH) and the accretion rate. Other variables, such as the BH angular momentum or the structure of the accretion disk, are of secondary importance and may be used to fine-tune the theoretical models. In the last years a strong correlation between the BH mass and the host-galaxy bulge velocity dispersion has been found for both inactive and active galaxies (Gebhardt et al., 2000; Ferrarese & Merritt, 2000; Tremaine et al., 2002), which confirms the impact that the presence of the central BH has on the galaxy evolution. At the same time, reverberation mapping studies have uncovered empirical relations between the size of the broad line region (BLR) and different estimates of the AGN luminosity (Peterson, 1993; Kaspi et al., 2005).
According with the Unified Model, the viewing angle determines the observed properties of the AGN. Leaving relativistic-jet effects in radio loud AGNs aside, the Unified Model anticipates that the inner nuclear regions of AGNs are embedded inside dusty tori. The detection of broad emission lines in the polarized light of the Sy 2 galaxy NGC 1068 by Antonucci & Miller (1985) was a very convincing evidence that Sy 1 and Sy 2 galaxies are basically the same objects seen from different angles. Depending on the angle of vision, the torus may obscure the inner region. Type 1 objects are thus unobscured AGN, while Type 2 are obscured.
Classifying Type 1 AGN in different categories is to some extent less complicated than classifying Type 2 objects. The broad bands arise exclusively from the BLR of Type 1 AGNs. This has lead to more phenomenological studies of the line profiles (see review by Sulentic et al., 2000). In contrast, the lines arising from the narrow line region (NLR) often compete with the lines emitted from H II regions-like, making difficult the interpretation of the theoretical results derived from photoionization models. Evidence is growing that nuclear and star formation activities may have a common trigger, which complicates the classification process. In reality, many objects are probably misclassified because of poor quality and low resolution spectroscopic data (Véron-Cetty et al., 2001), problems to separate the broad and narrow components of the Balmer lines, and the presence of Fe II blends that interferes with the measurements of the intensity and the profile parameters of .
This paper initially presents spectral observations of eight SBS objects and one companion galaxy of SBS 1204+505B to investigate the intrinsic reddening, the central BH mass, the size of the BLR, and to review their classification. The term companion will be used hereafter exclusively to designate the companion galaxy of SBS 1204+505B reported in this paper. Any other galaxy which may be related with other SBS objects will be designed as a neighbor. The observations were performed as part of a follow-up program to obtain medium resolution, high signal to noise observations of the AGNs catalogued in the SBS. The remaining of the paper is arranged in the following order: §2 description of the observations; §3 data reduction; §4 presentation of the general results; §5 individual analysis of each object; and §6 a summary of the main topics discussed.
2 Observations
Spectroscopic observation with the 2.1-m telescope of the National Astronomical Observatory in San Pedro Martir (Mexico) have been carried out in April 11–14 of 2002, with the Boller & Chivens spectrophotometer, equipped with a SITE pixel CCD installed at the Cassegrain focus. Two spectral ranges were covered for most objects: 4800-7200 Å (or 5150-7200 Å) and 6500-8000 Å, the only exception being SBS 0944+540 which was observed in the range between 6800-9000 Å. The grating used was a 600 l mm-1 with blaze angle , which yields a dispersion of 94 Å mm-1 at the front of the CCD. The slit width was , resulting in an effective instrumental spectral resolution of 4.5 Å which coincides with the instrumental broadening measured from the night sky lines. Two 1800 s exposures were obtained in each waveband for all objects. The continuum of each object was detected with a signal-to-noise (S/N) between 30 and 50.
Table 1 contains the log of observations. The columns list: (1) the SBS designation (equinox B1950), according with the IAU nomenclature (except the object referred as companion, which would be SBS 1204+505A but it is not included explicitly in the SBS catalogue); (2)-(3) the J2000.0 coordinates with an accuracy of ; (4) magnitude as listed in the SBS catalog, with an accuracy of about (one decimal place) or (two decimal places), except for SBS 1204+505B and its companion galaxy, for which the magnitudes were calculated from the Sloan Digitalized Sky Survey (SDSS, Data Release 5) photometric database (see the procedure used in the description of these objects in §5); (5) the redshifts; (6) absolute magnitudes (see eq. 1 below); (7) the dates of observation; (8) the spectral ranges covered; and (9) the AGN spectral types.
The absolute magnitude in Table 1 was calculated from the expression:
| (1) |
for q, H km s-1 Mpc-1. A spectral index value of =0.7 (for a power law of the form ) was adopted for the K correction, which is negligible for the low redshift objects ().
2.1 Classification criteria
The objects have been classified according with the spectroscopic criteria outlined in Stepanian (2005). The following is a short description of these criteria which includes the galactic nuclei types considered in this paper (namely QSO, Sy galaxies, and SBN) along with other related AGNs (for a complete description of AGN classification criteria see Stepanian 2005):
-
•
QSO - Star-like visual images and very broad permitted emission lines. Usually these lines have a Full Width Half Maximum (FWHM) larger than 5000 km s-1. The absolute magnitude separates the QSOs from other AGNs in the SBS (see fig. 22 of Stepanian, 2005).
-
•
Sy 1 - AGNs with broad permitted Balmer lines and narrow forbidden lines. The FWHM of the Balmer broad lines is usually in the range between 1000 and 6000 km s-1. The FWHM of the forbidden narrow lines are in the range between 300 and 1000 km s-1 (e.g. Osterbrock & Koski, 1976).
-
•
NLS1 - These AGNs where described by Osterbrock & Pogge (1985). They have narrow permitted lines only slightly broader than the forbidden lines (FWHM of smaller than 2000 km s-1; Goodrich 1989). The ratio [O III]/ smaller than 3, but exceptions are allowed if there are strong emission lines of [Fe VII] and [Fe X]. Many NLS1 have been discovered in X-rays by ROSAT and they have generally steeper soft X-ray continuum slopes than normal Sy 1s. Many NLS1 also show rapid soft X-ray variability.
-
•
Sy 1.5 - AGNs which have a discernible narrow H II profile superposed on a broad component (Osterbrock & Koski, 1976).
-
•
Sy 1.8 - AGNs which have relatively weak broad and components, superimposed on a strong narrow component.
-
•
Sy 1.9 - AGNs which have a relatively weak broad component, superimposed on a strong narrow component. The broad component is not seen.
-
•
Sy 2 - AGNs which have strong narrow components, but not broad components. A secondary criterion is that the [O III]/ ratio must be equal or larger than 3.
- •
-
•
SBN - These objects are spiral galaxies with a bright, blue nucleus which emits a strong narrow emission line spectrum similar to low-ionization H II regions. Balzano (1983) proposed three main criteria to separate SBN from other starburst objets: (a) strong, narrow (FWHM km s-1), low ionization (with [O III]/3) emission lines; (b) absolute bolometric magnitudes between -17.5 and 22.5; (c) conspicuous stellar nuclei.
3 Data Reduction
Standard data reduction procedures were applied to the observations, i.e. bias subtraction, flat field, illumination and response corrections, cosmic ray removal, wavelength linearization, atmospheric extinction correction, and flux calibration, by using the IRAF package doslit.
The wavelength calibration was accomplished with He and Ar lines from a standard comparison lamp observed before and after each object, and with the telescope still pointing at the object to avoid changes in the calibration due to structural bending. All the spectra were flux-calibrated with standard stars observed throughout the night. Fig. Physical Parameters and Classification of Eight Galactic Nuclei from the Second Byurakan Survey shows the reduced spectra for the SBS objects.
Cardelli et al. (1989) and O’Donnell (1994) have proposed the use of different polynomial empirical fits (up to order eight) for different wavelength ranges to model the galactic extinction law. As shown by the later author (see figs. 2 and 3 in O’Donnell, 1994), the polynomial functions have a tendency to introduce spurious bumps and depressions depending on the order of the polynomial fit (not to mention the wild behavior of high order polynomials outside of the fitting range).
NED implements a procedure to calculate the absorption in the visible and infrared bands based on Schlegel et al. (1998), who use the procedures proposed by Cardelli et al. (1989) and O’Donnell (1994). Given the data provided by NED, a simpler fit than the high-order polynomials proposed by these authors, or even data interpolation, would be enough for correcting for galactic extinction in the limited range of the spectroscopic observations such as the ones presented in this paper.
Values for the galactic extinction estimates were obtained from NED as total absorption in magnitudes for the bands. For convenience, we will perform the galactic extinction correction in flux rather than in magnitude units. Given the absorption , it is trivial to calculate the transmittance which is defined as the ratio of the transmitted to the incident radiant power:
| (2) |
The resulting transmittance data can be fitted very well by an exponential associate function:
| (3) |
were , , , and are the fitted parameters. With increasing wavelength, the transmittance reaches a constant (asymptotic) value of , hence the linear parameters have the constraint that:
| (4) |
The exponential associate function produces reasonable good fits for ; this is a much lower value than the transmittances calculated for the objects included in the SBS catalog, which are located well above the galactic plane and have small amounts of galactic extinction (). As an example, Fig. Physical Parameters and Classification of Eight Galactic Nuclei from the Second Byurakan Survey shows the exponential associate fit of the transmittance data as calculated for SBS 1136+594.
Different authors have shown their preferences for either Gaussian or Lorentzian profiles to fit the broad emission lines. The choice usually depended on the properties or the kind of AGN being considered. As a few examples, it is worth to cite Marziani et al. (2003), for whom Lorentzian functions provide a better fit for sources with a high luminosity to mass ratio, while low luminosity to mass ratio sources are best fitted by a double Gaussian; Dumont & Collin-Souffrin (1990b), Moran et al. (1996), Leighly (1999), and Véron-Cetty et al. (2001) find that many NLS1 galaxies have symmetric emission lines with Lorentzian rather than Gaussian profiles. On the other hand, Rodríguez-Ardila et al. (2000) argue that Lorentzian profiles are not suited to represent NLS1 broad emission lines. The broad emission lines analyzed in this paper have been fitted using both Gaussian and Lorentzian profiles.
Some objects show evidence of very broad extended wings to the Balmer lines. These wings do not disappear using different continuum levels and can be approximated by a logarithmic law (Blumenthal & Mathews, 1975).
The narrow emission lines are well fitted using single Gaussian profiles. In some cases, the wings show a minor excess near the base and a Lorentzian profile can be fitted yielding a FWHM estimate slightly lower than the Gaussian fit, in accordance with Véron-Cetty et al. (2001). However, the values reported in this paper are always calculated using Gaussian profiles.
Strong and [N II] blends were fitted simultaneously allowing the line ratio [N II]/[N II] to vary (within the expected errors) between 2.7 and 3.3, instead of forcing to fulfill the theoretical value of 2.94. The same procedure was used to fit the [O III] lines which have a theoretical value of 2.98 (Storey & Zeippen, 2000). The measured line ratios were compared with the theoretical values to check for possible unmodelled errors in the fitted spectra (particularly for objects modelled using several components for the Balmer lines, or with a strong emission of Fe II).
In order to detect He II and to fit the real profile, Fe II subtraction was performed using a template obtained from the NLS1 galaxy IZw1 whose spectrum is widely used as an Fe II template. The procedure to subtract the Fe II is the same as the one reported by Zamanov & Marziani (2002).
4 Results
Table 2 shows the rest frame equivalent width (EW) in and the full width half maximum (FWHM) in km s-1 for the observed lines in each object. These quantities have been calculated using the following expressions:
| (5) |
where and are the observed fluxes of the line and the continuum, respectively, and
| (6) |
where c is the speed of light, is the observed FWHM in , and the rest frame wavelength of the line.
The first column in Table 2 identifies the emission line, and columns 2-19 alternatively the EW in Å and the FWHM in km s-1 for each object. In some cases, the spectra show a small feature that strongly suggests the existence of a known line, but the S/N ratio is below the detection level (). For these features, the parameters of the fit are not accurate, and therefore their EW are indicated as superior limits, and no FWHM value is available.
The fluxes for the iron blends between 4400-4680 Å (Fe II ), and 5100-5500 Å (Fe II ) have been calculated from the iron template. The FWHM data were corrected for instrumental broadening (4.5 Å).
The discussion will be centered on the Gaussian fits, although the parameters of the Lorentzian fits were also calculated for all the permitted lines. Table 3 lists the Lorentzian parameters for those object for which the Lorentzian fits reproduce the Balmer profiles using less components than the Gaussian fits. In these cases, a single component was used except for the QSO SBS 0944+540. For this object, the simplest accurate fit was obtained using two broad Lorentzian components. Otherwise, the structure of Table 3 is similar to Table 2.
4.1 Narrow lines and diagnostic diagrams
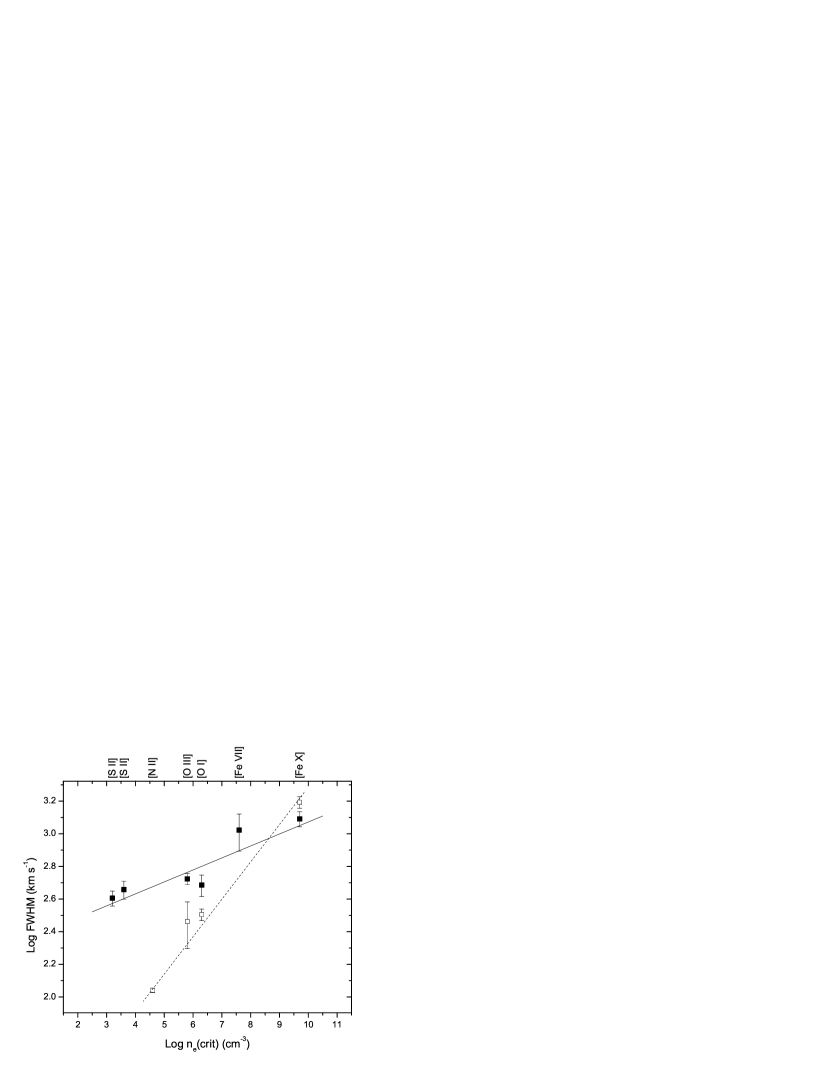
From Table 2 it is evident that for most objects there are manifest differences between the FWHM of the lines found in the and regions (SBS 0848+526, 1118+541, 1204+505B and its companion, and 1340+569), and between the narrow components of the permitted lines and the forbidden lines FWHM (SBS 1118+541 and 1136+595), and even among the forbidden lines (SBS 1118+541). The correlation between the line widths and both the critical density and the ionization potential are well known effects that can explain these differences (e.g. Pelat et al., 1981; Filippenko & Halpern, 1984; de Robertis & Osterbrock, 1984; Espey et al., 1994). Filippenko & Sargent (1985) find that [O I] in many LINER galaxies was broader than the [S II] lines, which they explain in terms of the different critical densities (crit) for collisional de-excitation for these lines. Following this line of thought, the critical densities for the [Fe VII] and [Fe X] ions are and , respectively. These critical densities are much higher than the mean density in the NLR, and the former lies even close to the density in the BLR. The high critical densities may explain the large FWHM values measured for these lines in some objects (SBS 1118+541 and 1340+569; see Table 2 and the discussion in §5).
The widths of the narrow lines are probably virial in their origin. For example, Nelson & Whittle (1996) have found a very good correlation between the width of the [O III] and the stellar velocity dispersion within the bulge. The virial origin for the width of the narrow lines, along with the correlation between these widths and both the critical density and the ionization potential reviewed above, imply a radial stratification of the NLR.
Table 4 lists the emission line ratios for objects that show clear narrow Balmer components. For the objects classified as QSO, no narrow component was necessary to fit the Balmer lines, thus they are not included in the table. The line ratios have been corrected from galactic extinction. Column 1 identifies the SBS object, and columns 2-6 list the corresponding line ratio with respect to the narrow component either of or . Detection limits for some line ratios involving forbidden lines ([O III], [O I] and [N II]) have been calculated and plotted in the diagnostic diagrams (see below). Note that for SBS 0848+526 and SBS 1340+569, the [S II] line is outside the spectral range of the observations.
Emission line models for AGNs have lead to search for diagnostic line-intensity ratios to analyze the observed optical spectra of AGNs and separate them from star-forming regions. Baldwin et al. (1981) proposed a set of empirical diagnostic diagrams which, after revisions by Osterbrock & Pogge (1985) and Veilleux & Osterbrock (1987), are the most currently used. The physics behind these diagrams is that the presence of free electrons generated by X-ray photoionization in partially ionized zones will enhance the strengths of the forbidden low-excitation lines (particularly [O I], [S II] and [N II]) produced by collisional excitation with respect to Balmer lines in narrow line AGNs, in comparison with H II region nuclei. Besides, O III is produced by hard ultraviolet photons, relatively more abundant in the AGN power law spectra than in H II regions. Thus, [O III] is an indicator of the mean level of ionization and temperature, and it is enhanced by photoionization from the harder AGN continua. This makes of [O III]/ an excellent indicator of the AGN activity, and all the diagnostic diagrams in the optical range include this line ratio.
Kewley et al. (2001, 2006) have derived the first purely theoretical classification scheme. The relevant narrow line ratios for diagnostic diagrams are plotted in Fig. Physical Parameters and Classification of Eight Galactic Nuclei from the Second Byurakan Survey, along with graphs generated from Kewley et al.
4.2 Reddening
Solving the case B equation for the equilibrium level population at temperature K and electronic density for H II regions yields a ratio for the Balmer recombination decrement / of 2.85 (Osterbrock, 1989). Gaskell & Ferland (1984) has shown that this ratio depends weakly on the electron density, but on the metallicity and the presence of a strong X-ray continuum. The intrinsic value for the NLR has been proposed to be 3.1 (Gaskell, 1982; Gaskell & Ferland, 1984; Halpern & Steiner, 1983), and larger observed values are imputed to reddening by dust. As it is usual in AGN, all the / line ratios shown in Table 4 are larger than the fiducial and proposed values of 2.85 and 3.1, respectively. However it is worth to remark that dust might be not the only responsible for large / line ratios. Netzer (1982) has argued that transfer effects, self-absorption and collisional excitation of hydrogen lines are important in the BLR (which renders the broad lines unreliable for reddening measurements) and they may also have observable consequences in the NLR, affecting the / and / ratios (Binette et al., 1993).
Witt et al. (1992) have shown that heavily reddened components may have a negligible contribution to the total reddening, and that ’bluing’ due to scattering partially compensates for reddening by extinction. Thus, to estimate the intrinsic reddening by dust within the host galaxy, we will assume that the local reddening has a continuous distribution along the line of sight. Besides, we will also assume that the optical properties of the dust in emission line galaxies are the same than the properties of dust in the solar neighborhood (Savage & Mathis, 1979). Thus, the magnitudes for the unreddened and the observed fluxes ( and , respectively) are related by:
| (7) |
where depends on the reddening and is the extinction coefficient with normalization.
Applying eq. 7 to the observed and intrinsic fluxes for and , we obtain:
| (8) |
where and (we will also adopt and hereafter). To calculate , we assume the intrinsic value of for the unreddened / ratio.
Other interesting parameters can be also derived, such as the B V color excess (recall that is the given quantity, rather than and ), the absorption coefficient (Whittet, 1992), and the optical depth at any wavelength:
| (9) | |||||
| (10) | |||||
| (11) |
Table 5 lists all the significant reddening parameters of the NLR for the objects presented in this paper. The columns indicate: (1) the object designation; (2) the reddening constant (eq. 8); (3) the color excess (eq. 9); (4) the extinction in the band (eq. 10); and (5), (6) (7) and (8) the optical depths (eq. 11) for the band, , and at .
4.3 Mass of the central black hole
Kinematic and reverberation mapping studies have lead to the finding of a strong correlation between the central black hole masses () and the bulge stellar velocity dispersion (). This correlation has been studied by several authors and it has been shown to be valid for both, AGN and non AGN galaxies (e.g. Ferrarese & Merritt, 2000; Ferrarese et al., 2001; Gebhardt et al., 2000). Tremaine et al. (2002) have proposed the expression:
| (12) |
Nelson & Whittle (1996) and Nelson (2000) assumed that for most AGN the forbidden line kinematics is dominated by virial motion in the host galaxy bulge, finding that the bulge velocity dispersion can be estimated from the width of the [O III] line:
| (13) |
However, there is evidence that the use of FWHM([O III]) as an estimator of the bulge stellar velocity dispersion in AGN tends to produce large scatters and may fail for individual objects (see discusion by Onken et al., 2004).
On the other hand, Kaspi et al. (2000) monitored a sample of 28 Palomar-Green quasars for reverberation mapping and found a correlation between the size of the BLR and the luminosity at Å, which was later updated (Kaspi et al., 2005) to the relation:
| (14) |
This expression relies on the AGN continuum monochromatic luminosity at 5100 Å which is a good approximation in the case of QSO, although for other AGN the host galaxy contribution at this wavelength can be very important. Kaspi et al. (2005) propose other possible BLR size and luminosity relations. In particular, the relation with the luminosity of the broad component seems to be as accurate as with the luminosity at 5100 Å and both power law fits share the same exponent. Furthermore, it has the advantage that the estimate for the luminosity of the broad component of is not contaminated by the host galaxy. Following the same procedure as Kaspi et al. (2005) to obtain the parameters in eq. 14 (i.e. averaging the parameter values obtained from the linear regression method and from the bivariate correlated errors and intrinsic scatter), we obtain an expression that relates the BLR size with the luminosity of the broad component of :
| (15) |
Assuming that the widths indicate the random orbits of the BLR material moving with Keplerian velocity:
| (16) |
the black hole mass can be expressed as:
| (17) |
where is the gravitational constant.
Note that Onken et al. (2004) has proposed that the kinematics and geometry of the BLR introduce a scaling factor of multiplying the mass. This factor has not been introduced in the analysis.
Table 6 lists the relevant parameters for the black holes. Column (1) identifies the object; (2) and (3) show the logarithm of the luminosities in solar units of the continuum at 5100 Å and for the broadest line component, respectively, corrected by galactic extinction and intrinsic reddening when available; (4) and (5) the size of the BLR in light days calculated from the luminosities at 5100 Å and from the broadest component (eqs. 14 and 15), respectively; (6), (7) and (8) the logarithms of the mass of the black hole in solar units; the first two estimates were calculated through the size of the BLR listed in columns (4) and (5) (eq. 17), and the orbital velocity of the BLR clouds estimated from the width of the broadest component (eq. 16); the last mass was estimated from the width of the [O III] (eqs. 12 and 13); finally, column (9) compares the mass estimates listed in columns 6 and 8.
From the values listed in Table 6, the BH masses calculated from the kinematics (FWHM) of the broadest component of and the energy output of the BLR, using either the monochromatic luminosity at 5100 Å or the luminosity of the broadest component (Kaspi et al., 2005), are very consistent (the largest discrepancy, for SBS 1340+569, is only a factor 2.5). However, the comparison of these two estimates with the BH mass calculated from the velocity dispersion in the galactic bulge (Tremaine et al., 2002), estimated from the FWHM([O III]), shows significantly larger discrepancies (a factor of 44 for SBS 1136+594), as displayed in the last column of Table 6.
5 Notes on individual objects
5.1 SBS 0848+526 (catalog )
This emission line object is an X-ray (ROSAT), radio (FIRST) and infrared (2MASS) source. The host galaxy is aligned roughly in the NS direction, and it has a brighter neighbor (around 0 5) separated by 14″ to the NE (see description below). The SDSS image shows that the two objects have bright nuclei, and a plume extending between both galaxies, approximately aligned in the EW direction, which coincides with the slit alignment during the observations. Thus, it was possible to detect extended emission of , and [O III] along this plume. Hence, the pair of objects seems to be another case of nuclear activity (either star formation and/or AGN) triggered by galaxy interaction.
The spectra obtained of the SBS object show only narrow lines. It is worth noticing that the / ratio for this object is large (see Table 4), which indicates a substantial reddening, with an intrinsic extinction coefficient of (see Table 5).
Besides and , the permitted He I line is also observed. For the forbidden lines, the spectrum shows the [O III] and the [N II] lines, as well as a weak [O I] . The luminosity of this SBS object is MB=-19.9, the line ratio [O III]/=1.41, and the FWHM km s-1 for all the emission lines. Hence, following Balzano (1983), the object is correctly classified in the SBS catalogue as a SBN by its optical properties. In Fig. Physical Parameters and Classification of Eight Galactic Nuclei from the Second Byurakan Survey we see that the available line ratios for this object also agree with an H II region-like.
The classification of SBS 0848+526 as a SBN is also compatible with the soft X-ray emission detected by ROSAT. However, AGNs also emit in soft X-rays, which sometimes can be detected even in the case of significantly reddened objects. Recently Jiménez-Bailón et al. (2003, 2005) have studied the contribution of nuclear starbursts to the X-ray emission from AGNs. Different approaches to disentangle the origin of the X-ray emission consist on careful modelling of the starburst and AGN emissions, higher X-ray imaging resolution than the data available from ROSAT All Sky Survey (25″), and hard X-ray observations.
As mentioned above, the SBS object has a neighbor galaxy. This galaxy is also an X-ray source (ROSAT). It is not included in the sample presented in this paper, but a few properties may be easily inferred from the SDSS data. The SDSS spectrum of the neighbor galaxy shows several emission lines (Balmer series, Fe II blends, [O III], [O I], [N II]- blend, and [S II]) at the same redshift (within the errors) as SBS 0848+526. This spectrum also shows the presence of the Fe II blends, which are usually associated with the accretion disk (e.g. Dumont & Collin-Souffrin, 1990a, b). Besides, and show evidence for a very weak broad component. Thus the most probable classification for this neighbor is as a Sy 1.8 galaxy.
5.2 SBS 0944+540 (catalog )
This is a well known QSO (e.g. Véron-Cetty et al., 2001; Hewitt & Burbidge, 1989) and a radio weak source (Bischof & Becker, 1997). It shows strong emission of Fe II blends. After subtracting the Fe II emission, there is evidence for a weak He II emission. Although the spectrum at the red end is noisy, it shows a weak increase near , which corresponds to the He I emission line. This line is clearly detected on the SDSS spectrum. Neither forbidden lines nor narrow components of permitted lines are observed.
The profile is very asymmetric and shows a strong blue bump. This line can be fitted using either two broad Lorentzian or three broad Gaussian profiles. In the later case, two broad components (FWHM km s-1), and a very broad component for the extended wings ( km s-1) are necessary. These wings can also be approximated using a logarithmic law. The BH mass estimated from the widest component of is approximately and the BLR has a diameter of 200 light days (see Table 6).
5.3 SBS 1118+541 (catalog )
This object is a ROSAT and FIRST source. It has been classified as a Sy 1 by Stepanian et al. (2002), but appears as a NLS1 in the SBS catalogue. The permitted lines can be fitted using either Gaussian or Lorentzian profiles. In the cases of and , two Gaussian components are necessary to fit the lines, but a single Lorentzian can also reproduce their profiles. The Lorentzian profiles for the Balmer lines have a FWHM of 1400-1500 km s-1, which are in accordance with the NLS1 classification. In the case of the Gaussian profiles, the broad components have FWHM in the range 3000-4000 km s-1, while the narrower components are broader than the forbidden lines [FWHM(n) km s-1 but FWHM([O III] ) km s-1]. Dietrich et al. (2005) studied 12 NLS1 and also found that the Gaussian decomposition of yielded broad components ( km s-1) and intermediate broad component ( km s-1).
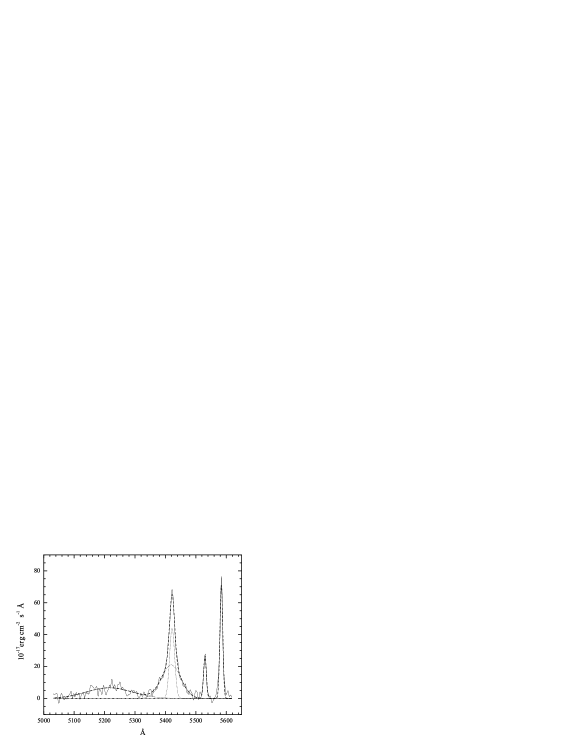
The He II emission line can be easily distinguished and measured after subtracting the intense Fe II background. Fig. Physical Parameters and Classification of Eight Galactic Nuclei from the Second Byurakan Survey shows the spectral region around before and after subtracting the Fe II blends. The He II has acquired special relevance in reverberation mapping studies because it responds with negligible delay to continuum variations (e.g. Ulrich & Horne, 1996). With respect to the He I line, it is possible to discern between the broad and narrow components. The parameters of the broad component (EW and FWHM), which depend on the baseline adopted for the subtraction of the continuum, are relatively inaccurate, but the narrow component is relatively free of this dependency, and it shows a FWHM comparable with and .
The narrow components of the permitted lines are much wider than the forbidden lines observed, with the exception of the weak [Fe VII] and [Fe X] . Thus, the [O III] and the weak lines of [O I] and [S II] have FWHM approximately half of the narrow and , respectively. But the forbidden lines also show a large dispersion in their FWHM, from approximately 1000 km s-1of [Fe VII] to 400 km s-1of [S II] . The [N II] lines are not observed, probably blended with the relatively intense emission.
The Lorentzian FWHM, along with the strong Fe II blends, the presence of [Fe VII] and [Fe X], the line ratio [O III]/ , and the X-ray emission are in accordance with the SBS classification as a NLS1. However, it is worth to note that the Gaussian analysis shows a broad component (FWHM()=2630 km s-1) significantly wider than the nominal NLS1 limit (FWHM()=2000 km s-1). Separating the Balmer lines in a broad and a narrow component has lead to a revision of the quality of several objects which were previously misclassified as NLS1 (e.g. Véron-Cetty et al., 2001; Botte et al., 2005; Bian et al., 2006a, b). These misclassifications were in part favored by the original definition of NLS1, which did not take into consideration the impact of a varying mix of the broad and narrow line components (Osterbrock & Pogge, 1985; Goodrich, 1989).
The EW of the broad and the narrow components of the Balmer lines (Table 2) can be used to compare the proportion of the flux arising from the BLR with the flux from the NLR. In this case, the BLR output is about twice the emission from the NLR. The narrow components / ratio (3.71) is moderate for a broad line AGN. Assuming a continuous distribution of local reddening, this ratio yields an intrinsic extinction coefficient of and small optical depths which indicate that the object is optically thin for dust scattering in the optical bands (see Table 5).
The line ratios lie in the H II region of the diagnostic diagrams (Fig. Physical Parameters and Classification of Eight Galactic Nuclei from the Second Byurakan Survey). Veilleux & Osterbrock (1987) have already noted that when a Gaussian profile is used for fitting the broad Balmer components of NLS1 galaxies, the line ratios show a significant spread in the diagnostic diagrams. Hence, rather than an indication of SBN activity, this effect is the result of comparing the forbidden lines arising from the NLR with the narrow Balmer components which in this case originate in an intermediate region between the BLR and the NLR.
The differences in line widths among the forbidden lines as compared with the permitted narrow lines indicate a strong stratification of the NLR. Wilson & Heckman (1985) have discussed that the FWHM of an emission line approximately represents the bulk motion of clouds whose density is equal to the critical density for that line (cf. Ferguson et al., 1997). Filippenko & Sargent (1988) used this approximation to show that the NLR of the Sy1 nucleus M81 might be stratified, with a dependence such that the velocities of the clouds scale as . The dependency between the critical densities (for a temperature of 104 K) and the FWHM of the forbidden lines is shown in Fig. Physical Parameters and Classification of Eight Galactic Nuclei from the Second Byurakan Survey. In the case of SBS 1118+541 the weighted, linear least-squares fit shows that .
Maybe the AGN spatial orientation (NLS1 are presumed to be seen face-on) permits to observe the different strata. Besides, the small amount of reddening inferred for this object (Table 5) does not impede the observation of the deeper regions. Of course, such small reddening is also in accordance with the face-on view and the presumed distribution of the dust in a torus. Ferguson et al. (1997) have shown that that the integrated narrow-line spectrum in Sy galaxies can be explained by considering an ensemble of clouds in the context of the Locally Optimally emitting Cloud (LOC) model (Baldwin et al., 1995). Under the assumption of a Keplerian gravitational velocity field, this model can predict the observed line width as a function of the critical density.
The relevant BH parameters for this object are listed in Table 6. The mass estimated from the [O III] is slightly larger but compatible with the mass estimated from the broad component of , and both are larger than the value expected for a NLS1 (). This result counterpoints with Bian & Zhao (2004) who have investigated the BH-bulge relation in AGN. These authors found that, in the case of NLS1, the BH mass estimated from [O III] can be one order of magnitude larger than the mass estimated from (see their Fig. 2). They used the 150 NLS1 sample extracted from the SDSS by Williams et al. (2002), who developed a procedure to measure the width of the whole line halfway between the fitted continuum and the line peak from the SDSS spectra. Hence, the disagreement is a result of the methodology used to measure the FWHM, and can be easily resolved applying Lorentzian rather than Gaussian fits. Thus, using the FWHM listed in Table 3, the logarithm of the BH mass in solar units calculated from the continuum at 5100 Å changes from 8.19 to 7.32. This mass is in accordance with the expected value for a NLS1 and just an order of magnitude smaller than the mass calculated from the [O III] FWHM, in agreement with Bian & Zhao (2004). The large discrepancy (a factor 7) between the BH masses inferred from line fits using Gaussian versus Lorentzian models is sobering, showing that much of the energy is in the line wings and suggesting that many BH mass estimates presented in the literature may have large and probably systematic errors.
5.4 SBS 1136+594 (catalog )
This AGN is a ROSAT and 2MASS source. It is classified as a Sy 1.5 galaxy in the SBS catalogue and by Gonçalves et al. (1999). The [N II] lines are very weak ([N II]= 0.2), a characteristic already reported by Martel & Osterbrock (1994) and Gonçalves et al. (1999) ([N II]= 0.25 and 0.1, respectively). The and lines show moderate asymmetric profiles Gonçalves et al. use three components to fit , but only two for .
Other spectral characteristics are the strong [O III] lines which are narrower than , weak Fe II emission, the presence of He I , [O I] , [Fe X] , and [S II] at the red end of the observed spectrum.
Comparing the broad and narrow components of the Balmer lines, the flux arising from the BLR is approximately 15 times the flux from the NLR, and the line ratios lie in the AGN region of the diagnostic diagrams (Fig. Physical Parameters and Classification of Eight Galactic Nuclei from the Second Byurakan Survey). The large [O III]/ line ratio of 10.88 indicates the strength of the ultraviolet AGN continuum. However, the / ratio (7.83) is also the highest in the sample, denoting a large amount of intrinsic reddening (see Tables 4 and 5).
The [O III] FWHM has a value of only 200 km s-1. Hence the BH mass estimated from the [O III] FWHM () is rather humble for a Seyfert galaxy, and it is also a factor approximately 44 smaller than the mass estimated from the width (Table 6). The size for the BLR, estimated from the monochromatic 5100 Å and the broad component luminosities, is large ( light days) and it is comparable to the sizes estimated for QSOs.
5.5 SBS 1136+595 (catalog )
This object is a 2MASS source. It was classified as a Sy 1 galaxy by Markarian et al. (1983), but appears as a NLS1 galaxy in the SBS. The Fe II is strong and, after subtraction, it is possible to detect a very noisy He II (Fig. Physical Parameters and Classification of Eight Galactic Nuclei from the Second Byurakan Survey). The FWHM of this line is poorly estimated, yielding a value of 10240 km s-1 (8700 km s-1 for the Lorentzian fit). This width may seem too large when compared with 1490 km s-1 measured for the FWHM of , but it is worth to remember (see discussion on SBS 1118+541 above) that the He II line shows negligible delays with respect to the continuum, and hence probably arises from fast moving BLR clouds very close to the central BH.
and can be fitted using either two Gaussian components (narrow and broad) or a single Lorentzian. but for the weaker a single Gaussian can also reproduce the line profile. When the Lorentzian profile is applied, the three Balmer lines observed have FWHM smaller than 2000 km s-1. However, as in the case of SBS 1118+541 discussed previously, the broad components for the Gaussian fits are much larger than the limit for NLS1 galaxies. The remarks about the classification of SBS 1118+541 given above are also applicable to SBS 1136+595.
Also, as in the case of SBS 1118+541, the NLR shows evidence of stratification. Thus, the and narrow components have widths much larger than the forbidden lines, and the differences among the FWHM of the forbidden lines, in the range 350-540 km s-1, are also large but not as much as in SBS 1118+541, probably due to the absence of the [Fe VII] and [Fe X] lines. The narrow components / ratio (4.24) and the reddening () are larger than in SBS 1118+541, but still moderate for an AGN (Table 5). A comparison between the broad and narrow components of the Balmer lines shows that the BLR emits times the NLR. Other lines present in the spectrum are He II , [N II] , and [S II] .
As in SBS 1118+541, the line ratios also lie in the H II region of the diagnostic diagrams (Fig. Physical Parameters and Classification of Eight Galactic Nuclei from the Second Byurakan Survey), in accordance with the result reported by Veilleux & Osterbrock (1987) for NLS1 whose broad Balmer lines have been fitted with Gaussian profiles.
The BH mass estimated from the FWHM of the broad component of and [O III] agree (Table 6). But again, as in SBS 1118+541, the logarithm of the BH mass in solar units calculated from the Lorentzian profile (Table 3) and the continuum at 5100 Å changes from 8.06 to 7.17, in accordance with the NLS1 masses reported by Bian & Zhao (2004).
5.6 SBS 1204+505B (catalog ) and companion
SBS 1204+505B is a ROSAT and 2MASS source. In the SBS catalogue, it is classified as a Sy 1.8 galaxy. The object probably belongs to a compact group of three galaxies. Relative to the center of SBS 1204+505B, one galaxy is roughly to the south and the other to the west. The SDSS image from the former galaxy is unlikely to correspond to an AGN (no spectrum is available for this galaxy). On the contrary, the later galaxy shows a bright stellar-like nucleus which indicates some kind of nuclear activity. We refer to this galaxy as the companion. The spectra for both SBS 1204+505B and its companion are also available through the SDSS.
The reported magnitude of SBS 1204+505B in the SBS catalogue is 17.0. In Table 1 the magnitude has been transformed from the SDSS photometric data ( and bands) to allow comparison with the companion galaxy. The equation for the transformation is borrowed from Smith et al. (2002):
| (18) |
being the SDSS magnitudes an 16.18 and 15.57 for the SBS object, and 16.67 and 16.15 for the companion.
The spectrum of SBS 1204+505B does not show any Fe II blends. In the SDSS spectrum it is possible to distinguish a weak broad component of , but the spectrum presented in this paper shows only a narrow component. [O III] lines are clearly visible ([O III]/= 2.27, see Table 4). There is evidence for the presence of the [O I] line, although it is below the detection level of our spectrum. [N II] lines are clearly distinguished at both sides of the narrow component of . The broad component of has a FWHM of about 3400 km s-1, and its emission is comparable with that of the narrow component. Finally, at the red end of the spectrum the [S II] lines can be clearly distinguished.
The narrow components / ratio has a value of 5.02, indicating an important amount of intrinsic reddening (). The BH mass estimated from the [O III] FWHM is .
The loci of all the emission line ratios in the diagnostic diagrams (Fig. Physical Parameters and Classification of Eight Galactic Nuclei from the Second Byurakan Survey) are in the AGN domain. The spectrum presented in this paper is consistent with that of a Sy 1.9, in contrast with both the SBS catalogue and the SDSS spectrum, which favor a Sy 1.8 classification. Of course, the classification may depend on the S/N ratio of the different spectra as well as the somewhat subjective detection threshold for the broad component. However, Penston & Perez (1984) have shown that large variations in the broad components of the Balmer lines are possible, and the same object may be classified as Sy 1 or Sy 2 nuclei in different epochs. Thus, the possibility that the object shows some kind of variability cannot be discarded.
About the companion, it is separated 33″ from the SBS object. The systemic velocity difference between both galaxies is km s-1. With respect to the permitted lines, only and are observed. Although both of them are narrow, is more than twice broader than . The / ratio is rather large (7.40, see Table 4), indicating that intrinsic reddening is important () and the optical depth is larger than the thin limit (; see Table 5). He I is probably present but below the level of detection. For the forbidden lines, the [N II] pair is observed and these lines have similar FWHM to that of , but the [S II] profiles are significantly broader. [O III] is probably present but below the detection level, as is [O I] . These oxygen lines are also very weak in the SDSS spectrum.
The visual aspect (bright nucleus) and a glance to the narrow line spectrum suggest that the companion is a SBN. However, the line ratios are not well determined and two of three upper limits are compatible with both H II regions and low activity AGN (see Fig. Physical Parameters and Classification of Eight Galactic Nuclei from the Second Byurakan Survey). Only the [N II]/ upper limit is incompatible with an AGN. The FWHM of (450 km s-1) is too broad for a SBN or a H II region, although the line is weak (it is barely detected at the level) and all the other lines have FWHM less than 300 km s-1. Following Osterbrock (1989), the [S II] /[S II] line ratio (1.3) yields an electron density (for a range of temperatures between 5000 and ) which is typical for the spread-out giant H II regions. Thus, the companion galaxy can be classified as a SBN.
5.7 SBS 1340+569 (catalog )
This object is a ROSAT and 2MASS source, and it is classified as a Sy 1.8 galaxy in the SBS catalogue. It has an emission line neighbor galaxy located to the East and to the South. The SDSS image for this neighbor does not show a star-like nucleus, and the spectra show that both objects share the same redshift (0.04) and that the neighbor is probably a SB galaxy.
The spectrum of SBS 1340+569 does not show any Fe II blends, which favors the detection of the He II line. The intensity of the broad components of and are approximately twice the strength of the narrow components. The components are significantly wider than those of . The narrow components / ratio (3.26) almost matches the intrinsic value accepted for AGNs (3.1), indicating a very low intrinsic reddening (Table 5).
The He I line is very weak, and the measured FWHM for this line (680 km s-1) is probably inaccurate. The [O III] lines are clearly visible ([O III] ), although these lines are narrower than . [O I] is also present, and it has a FWHM similar to [O III]. The [Fe X] is much broader than the other observed narrow lines (1560 km s-1), as in the case of SBS 1118+541. The [N II] lines are weak ([N II]/ ), but they can be distinguished superposed to the broad component. These lines and the narrow component have similar widths (around 110 km s-1).
The size of the BLR estimated from the continuum at 5100 Å and the broad component of luminosities are small, around 6 light days. This feature, along with the X-ray emission detected by ROSAT and the small amount of reddening measured, probably makes of this object a good candidate for reverberation mapping studies.
The presence of broad components confirms that this is an AGN. The [O III]/ line ratio () indicates an ultraviolet excess probably associated to the AGN. The BH mass calculated from the and [O III] widths agree in an estimate of approximately . Fig. Physical Parameters and Classification of Eight Galactic Nuclei from the Second Byurakan Survey shows the strong correlation between the FWHM and the critical density for each forbidden line present in SBS 1340+569. This correlation shows that the velocities of the clouds scale as . This is a rather large dependency compared to M81 (Filippenko & Sargent, 1988) or SBS 118+541, and it may indicate the presence of a starburst component that contributes to the low-excitation and lower critical density lines. Besides, some of the FWHM of the narrow lines are smaller than the value of 300 km s-1 that separates H II regions from AGN, while some are larger than this value (Table 2). Of the two line ratios plotted in the diagnostic diagrams (Fig. Physical Parameters and Classification of Eight Galactic Nuclei from the Second Byurakan Survey; note that the [S II] lines are not in the range of the available spectrum), one lies in the AGN region while the other in the H II region. These features suggest that this object has a composite spectrum, and should be considered as a Seyfert (probably a Sy 1.8) with a SBN component.
5.8 SBS 1626+554 (catalog )
This object is an infrared (2MASS) and X-ray (ROSAT and EINSTEIN) source. Its spectrum clearly corresponds to a QSO, and the only forbidden lines observed are the [O III] . The permitted lines do not show narrow components, but two broad components are necessary to fit the Balmer lines, whose profiles are slightly asymmetric because the broadest component is systematically redshifted.
The profile is complicated because it is blended with the [O III] line. As shown in Fig. Physical Parameters and Classification of Eight Galactic Nuclei from the Second Byurakan Survey, the broadest component of is redshifted by km s-1. A similar redshifted component can be measured in , as shown in Fig. Physical Parameters and Classification of Eight Galactic Nuclei from the Second Byurakan Survey and . The extreme of the red wing of the profile is bitten by the telluric absorption band between 7570 and 7700 Å. All these lines show a fit which is not as good near the peak as in the rest of the line, suggesting the presence of a narrow component, however, too weak to be measured with confidence (S/N1.5).
Apart from the Balmer lines, the only permitted lines observed are He II (after subtracting the Fe II blends), a feature identified as He I , and He I which is easily recognized in the spectrum.
The broad line referred as He I deserves a especial remark. This feature is clearly seen as the reddest line in Fig. Physical Parameters and Classification of Eight Galactic Nuclei from the Second Byurakan Survey. The He I denomination is suggested because the measured gravity center of the line in the QSO rest-frame is at and, moreover, there are also other He I and He II lines detected in the spectrum. However, other atomic ions have also permitted lines that dwell in the same region. Peterson et al. (1985) found a emission line at 5050 Å in Akn 120 that Crenshaw & Peterson (1986) proposed to be Si II o perhaps Si II . A similar feature was also reported by Sergeev et al. (1997) in the spectrum of NGC 5548.
An indication of the temperature and density in the NLR can be obtained from the [O III] lines. Following Osterbrock (1989), the sum of the [O III] and [O III] fluxes divided by the [O III] flux has a value of 7.35, which indicates either a high temperature () or most probably a high electron density ().
Finally, the BH mass estimated from the and [O III] line widths approximately agree within a factor of 2 (, respectively, see Table 6).
6 Conclusions
Spectroscopic observations of 8 SBS extragalactic sources, as well as one companion galaxy, have been made using the OAN 2.1-m telescope at San Pedro Mártir, Mexico. The spectra in all but one case (SBS 0944+540) covers the rest frame and regions with a spectral resolution of 4.5 Å. The data has been corrected for redshift and for galactic extinction in order to derive spectrophotometric parameters and line ratios.
The spectra have been analyzed in detail and several faint emission lines have been measured. Any feature that strongly suggests the presence of an emission line was also reported. Fe II blends have been subtracted and their EW measured. These subtractions have allowed a better estimate of the emission lines parameters for and the [O III] . Frequently, the Fe II subtraction has also made possible the identification and measurement of He II and, in one case, a feature that is identified as He I .
Gaussian profiles were used to fit both the broad and the narrow emission lines. In most cases, a single component was used, except for the Balmer lines, which usually presented a narrow as well as one or more broad components. Some line profiles can also be described using Lorentzian fits with a lesser number of components. In these cases, the Lorentzian parameters for the broad lines have been reported.
Emission line FWHM and line ratios have been used, along with diagnostic diagrams, to separate AGNs from H II regions-like. Thus it was possible to review the classification of all objects. In two cases, a revised classification is proposed.
The analysis of the spectra reveal that the widths of the lines frequently change along the spectral range, an effect that may imply a stratification of the NLR.
Intrinsic reddening, B V color excess, extinction coefficients and optical depths for the band, and at wavelengths corresponding to , and 5100 Å, were calculated for all the objects with narrow Balmer components, and assuming that the local reddening has a continuous distribution along the line of sight and that the optical properties of the dust in the host-galaxy are the same as in the solar neighborhood.
Several parameters of the central black hole have been calculated with different methodologies and the results are compared. The mass of the central supermassive black hole has been inferred from its correlation with both the bulge stellar velocity dispersion (measured from the [O III] FWHM), and from the luminosity and FWHM of . The luminosity has been estimated from both the monochromatic flux at 5100 Å and the integrated flux of the broad component.
Below is a summary of the main topics discussed for each object:
-
•
SBS 0848+526 is a reddened SBN which has a plume extending to a brighter neighbor Seyfert galaxy. The plume emits , and [O III] lines.
-
•
SBS 0944+540 is a QSO with strong Fe II blends and without evidence of narrow lines. The profile is strongly asymmetric and shows a large blue bump and extended wings.
-
•
SBS 1118+541 and 1136+595 are NLS1 which present many similarities. Both show discrepancies in the FWHM of the broad Balmer components used for their classification, depending on whether they were fitted using Gaussian or Lorentzian profiles. Their line ratios calculated from the Gaussian fits correspond to H II regions-like. There are differences in the widths among all the narrow lines, and particularly the narrow Balmer components are much broader than the forbidden lines, suggesting a stratification of the NLR. Both objects show low amounts of reddening and the masses of their black holes, estimated from the Lorentzian fit for , are one order of magnitude below the mass estimation from the Gaussian fit or from the [O III] FWHM.
-
•
SBS 1136+594 is a Sy 1.5 galaxy showing a large amount of reddening. The mass of the black hole estimated from the [O III] FWHM is rather low for a Sy 1.5 and a factor 44 times smaller than the mass calculated from the FWHM.
-
•
SBS 1204+505B is an AGN with at least one companion galaxy, and is more probably a member of a compact group. The nucleus is reddened, and, in contrast with , the broad component of is not detected in the spectrum presented in this paper. This feature leads to classify the object as a Sy 1.9, rather than a Sy 1.8 as proposed in the SBS catalogue. The companion of SBS 1204+505B reported in this paper is a very reddened SBN. However, the weak line has a FWHM of 450 km s-1, which is larger than the width expected for this kind of objects.
-
•
SBS 1340+569 is probably a Sy 1.8 galaxy with a SBN component. The diagnostic plots for the available line ratios cover both the AGN and H II region domains. Besides, there is a variety of line widths for different ions and between the broad and narrow components of and , being the widths of the narrow lines in the region rather small for an AGN. The amount of reddening is small, as well as the size estimated for the BLR ( light days).
-
•
SBS 1626+554 is a QSO whose permitted lines need two broad profiles to be fitted. The broadest component is redshifted by about 1000 km s-1. Narrow components are suggested for all these three lines, but their S/N are too low to be measured reliably. The He II is discernible after the subtraction of the strong Fe II blends. A peculiar broad emission line, probably He I , is observed and its parameters measured.
References
- Antonucci (1993) Antonucci, R. 1993, ARA&A, 31, 473
- Antonucci & Miller (1985) Antonucci, R. R. J., & Miller, J. S. 1985, ApJ, 297, 621
- Baldwin et al. (1981) Baldwin, J. A., Phillips, M. M., & Terlevich, R. 1981, PASP, 93, 5
- Baldwin et al. (1995) Baldwin, J., Ferland, G., Korista, K., & Verner, D. 1995, ApJ, 455, L119
- Balzano (1983) Balzano, V. A. 1983, ApJ, 268, 602
- Bian & Zhao (2004) Bian, W., & Zhao, Y. 2004, MNRAS, 347, 607
- Bian et al. (2006a) Bian, W.-H., Cui, Q.-L., & Chao, L.-H. 2006a, Chin. J. Astron. Astrophy., 6, 281
- Bian et al. (2006b) Bian, W., Yuan, Q., & Zhao, Y. 2006b, MNRAS, 367, 860
- Binette et al. (1993) Binette, L., Wang, J., Villar-Martin, M., Martin, P. G., & Magris C., G. 1993, ApJ, 414, 535
- Bischof & Becker (1997) Bischof, O. B., & Becker, R. H. 1997, AJ, 113, 2000
- Boller et al. (1996) Boller, T., Brandt, W. N., & Fink, H. 1996, A&A, 305, 53
- Botte et al. (2005) Botte, V., Ciroi, S., di Mille, F., Rafanelli, P., & Romano, A. 2005, MNRAS, 356,
- Blumenthal & Mathews (1975) Blumenthal, G. R., & Mathews, W. G. 1975, ApJ, 198, 517
- Cardelli et al. (1989) Cardelli, J. A., Clayton, G. C., & Mathis, J. S. 1989, ApJ, 345, 245
- Crenshaw & Peterson (1986) Crenshaw, D. M., & Peterson, B. M. 1986, PASP, 98, 185
- de Robertis & Osterbrock (1984) de Robertis, M. M., & Osterbrock, D. E. 1984, ApJ, 286, 171
- Dietrich et al. (2005) Dietrich, M., Crenshaw, D. M., & Kraemer, S. B. 2005, ApJ, 623, 700
- Dumont & Collin-Souffrin (1990a) Dumont, A. M., & Collin-Souffrin, S. 1990a, A&AS, 83, 71
- Dumont & Collin-Souffrin (1990b) Dumont, A. M., & Collin-Souffrin, S. 1990b, A&A, 229, 313
- Espey et al. (1994) Espey, B. R., et al. 1994, ApJ, 434, 484
- Ferguson et al. (1997) Ferguson, J. W., Korista, K. T., Baldwin, J. A., & Ferland, G. J. 1997, ApJ, 487, 122
- Ferrarese & Merritt (2000) Ferrarese, L., & Merritt, D. 2000, ApJ, 539, L9
- Ferrarese et al. (2001) Ferrarese, L., Pogge, R. W., Peterson, B. M., Merritt, D., Wandel, A., & Joseph, C. L. 2001, ApJ, 555, L79
- Filippenko & Halpern (1984) Filippenko, A. V., & Halpern, J. P. 1984, ApJ, 285, 458
- Filippenko & Sargent (1985) Filippenko, A. V., & Sargent, W. L. W. 1985, ApJS, 57, 503
- Filippenko & Sargent (1988) Filippenko, A. V., & Sargent, W. L. W. 1988, ApJ, 324, 134
- Gaskell (1982) Gaskell, C. M. 1982, PASP, 94, 891
- Gaskell & Ferland (1984) Gaskell, C. M., & Ferland, G. J. 1984, PASP, 96, 393
- Gebhardt et al. (2000) Gebhardt, K., et al. 2000, ApJ, 539, L13
- Gonçalves et al. (1999) Gonçalves, A. C., Véron-Cetty, M.-P., & Véron, P. 1999, A&AS, 135, 437
- Goodrich (1989) Goodrich, R. W. 1989, ApJ, 342, 224
- Halpern & Steiner (1983) Halpern, J. P., & Steiner, J. E. 1983, ApJ, 269, L37
- Heckman (1980) Heckman, T. M. 1980, A&A, 87, 152
- Hewitt & Burbidge (1989) Hewitt, A., & Burbidge, G. 1989, A New Optical Catalog of Quasi-Stellar Objects, Univ. of Chicago Press, Chicago
- Ho et al. (1997) Ho, L. C., Filippenko, A. V., Sargent, W. L. W., & Peng, C. Y. 1997, ApJS, 112, 391
- Jiménez-Bailón et al. (2005) Jiménez-Bailón, E., Santos-Lleó, M., Dahlem, M., Ehle, M., Mas-Hesse, J. M., Guainazzi, M., Heckman, T. M., & Weaver, K. A. 2005, A&A, 442, 861
- Jiménez-Bailón et al. (2003) Jiménez-Bailón, E., Santos-Lleó, M., Mas-Hesse, J. M., Guainazzi, M., Colina, L., Cerviño, M., & González Delgado, R. M. 2003, ApJ, 593, 127
- Kaspi et al. (2000) Kaspi, S., Smith, P. S., Netzer, H., Maoz, D., Jannuzi, B. T., & Giveon, U. 2000, ApJ, 533, 631
- Kaspi et al. (2005) Kaspi, S., Maoz, D., Netzer, H., Peterson, B. M., Vestergaard, M., & Jannuzi, B. T. 2005, ApJ, 629
- Kauffmann et al. (2003) Kauffmann, G., et al. 2003, MNRAS, 346, 1055
- Kewley et al. (2006) Kewley, L. J., Groves, B., Kauffmann, G., & Hecman, T. 2006, astro-ph/0605681
- Kewley et al. (2001) Kewley, L. J., Heisler, C. A., Dopita, M. A., & Lumsden, S. 2001, ApJS, 132, 37
- Leighly (1999) Leighly, K. M. 1999, ApJS, 125, 317
- Markarian et al. (1983) Markarian, B. E., Lipovetskii, V. A., & Stepanian, D. A. 1983, Astrofizika, 19, 29
- Martel & Osterbrock (1994) Martel, A., & Osterbrock, D. E. 1994, AJ, 107, 1283
- Marziani et al. (2003) Marziani, P., Zamanov, R. K., Sulentic, J. W., & Calvani, M. 2003, MNRAS, 345, 1133
- Moran et al. (1996) Moran, E. C., Halpern, J. P., & Helfand, D. J. 1996, ApJS, 106, 341
- Nelson & Whittle (1996) Nelson, C. H., & Whittle, M. 1996, ApJ, 465, 96
- Nelson (2000) Nelson, C. H. 2000, ApJ, 544, L91
- Netzer (1982) Netzer, H. 1982, MNRAS, 198, 589
- O’Donnell (1994) O’Donnell, J. E. 1994, ApJ, 422, 158
- Onken et al. (2004) Onken, C. A., Ferrarese, L., Merritt, D., Peterson, B. M., Pogge, R. W., Vestergaard, M., & Wandel, A. 2004, ApJ, 615, 645
- Osterbrock (1989) Osterbrock, D. E. 1989, in Astrophysics of Gaseous Nebulae and Active Galactic Nuclei, University Science Books, Mill Valley (CA), USA
- Osterbrock & Koski (1976) Osterbrock, D. E., & Koski, A. T. 1976, MNRAS, 176, 61P
- Osterbrock & Pogge (1985) Osterbrock, D. E., & Pogge, R. W. 1985, ApJ, 297, 166
- Pelat et al. (1981) Pelat, D., Alloin, D., & Fosbury, R. A. E. 1981, MNRAS, 195, 787
- Penston & Perez (1984) Penston, M. V., & Perez, E. 1984, MNRAS, 211, 33P
- Peterson et al. (1985) Peterson, B. M., Meyers, K. A., Carpriotti, E. R., Foltz, C. B., Wilkes, B. J., & Miller, H. R. 1985, ApJ, 292, 164
- Peterson (1993) Peterson, B. M. 1993, PASP, 105, 247
- Rodríguez-Ardila et al. (2000) Rodríguez-Ardila, A., Binette, L., Pastoriza, M. G., & Donzelli, C. J. 2000, ApJ, 538, 581
- Savage & Mathis (1979) Savage, B. D., & Mathis, J. S. 1979, ARA&A, 17, 73
- Schlegel et al. (1998) Schlegel, D. J., Finkbeiner, D. P., & Davis, M. 1998, ApJ, 500, 525
- Sergeev et al. (1997) Sergeev, S. G., Pronik, V. I., Malkov, Y. F., & Chuvaev, K. K. 1997, A&A, 320, 405
- Smith et al. (2002) Smith, J. A., et al. 2002, AJ, 123, 2121
- Stepanian (2005) Stepanian, J. A. 2005, Rev. Mexicana Astron. Astrofis., 41, 155
- Stepanian et al. (2002) Stepanian, J. A., Chavushyan, V. H., Carrasco, L., Valdés, J. R., Mújica, R. M., Tovmassian, H. M., & Ayvazyan, V. T. 2002, AJ, 124, 1283
- Storey & Zeippen (2000) Storey, P. J., & Zeippen, C. J. 2000, MNRAS, 312, 813
- Sulentic et al. (2000) Sulentic, J. W., Marziani, P., & Dultzin-Hacyan, D. 2000, ARA&A, 38, 521
- Tremaine et al. (2002) Tremaine, S., et al. 2002, ApJ, 574, 740
- Ulrich & Horne (1996) Ulrich, M.-H., & Horne, K. 1996, MNRAS, 283, 748
- Veilleux & Osterbrock (1987) Veilleux, S., & Osterbrock, D. E. 1987, ApJS, 63, 295
- Véron-Cetty et al. (2001) Véron-Cetty, M.-P., Véron, P., & Gonçalves, A. C. 2001, A&A, 372, 730
- Whittet (1992) Whittet, D. C. B. 1992, in Dust in the Galactic Environment, Tayler, R. J. & White, R. E. eds, Institute of Physics Publishing, Bristo, UK
- Williams et al. (2002) Williams, R. J., Pogge, R. W., & Mathur, S. 2002, AJ, 124, 3042
- Wilson & Heckman (1985) Wilson, A. S., & Heckman, T. M. 1985, Astrophysics of Active Galaxies and Quasi-Stellar Objects, 39
- Witt et al. (1992) Witt, A. N., Thronson, H. A., Jr., & Capuano, J. M., Jr. 1992, ApJ, 393, 611
- Zamanov & Marziani (2002) Zamanov, R., & Marziani, P. 2002, ApJ, 571, L77
Spectra of the SBS objects and the companion galaxy of SBS 1204+505B.
Transmittance values for the galactic extinction of SBS 1136+594. The squares show the transmittances obtained from the galactic extinction (eq. 2) for the UBVRIJHKL’ band measurements extracted from NED. The continuous line corresponds to the exponential associate function fit (eq. 3).
Diagnostic diagram adapted from Kewley et al. 2006. The letter code for the objects is: A - SBS 0848+526, B - SBS 1118+541, C - SBS 1136+594, D - SBS 1136+595, E - SBS 1204+505B, F - Companion, and G - SBS 1340+569
Detail of the region in SBS 1118+541. The continuous line shows the original data, and the dashed line the data after subtracting the Fe II blends. The He II (around at the observer’s frame) is clearly visible after the subtraction.
The common logarithm of the FWHM vs the critical density for collisional de-excitation (for a temperature of 104 K) reveals a highly significant correlation for SBS 1118+540 (filled squares) and SBS 1340+569 (open squares). The solid line shows the weighted linear fit for SBS 1118+540 (slope ; correlation coefficient ). Similarly, the dashed line shows the weighted linear fit for SBS 1340+569 (; ).
Gaussian fit of the region in SBS 1118+541 (upper panel) and SBS 1136+595 (lower panel). The continuous line shows the data after Fe II and continuum subtraction. The dotted lines show the individual components of the fit (He II , narrow and broad, and [O III] and 5007). Finally, the dashed thick line shows the profile obtained combining the individual components.
Fit of the line in SBS 1626+554. The continuous line shows the data after subtracting the continuum. The doted lines show the individual components of the line and the narrow [O III] , while the dashed thick line represents the complete fit. A narrow component,would help to improve the fit near the peak.
Fit of the region around in SBS 1626+554. The continuous line shows the data after subtracting the Fe II blends and the continuum. The doted lines show the individual components of the fit (He II , the three broad components of , and [O III] ). The dashed thick line shows the complete fit. As in the previous figure, a weak narrow component would improve the fit near the peak.
| SBS | R.A. | Dec. | Date | Spectral | Spectral | |||
|---|---|---|---|---|---|---|---|---|
| designation | 2000 | 2000 | em | dd-mm-yy | range | typeaaNew or revised classification in italics. | ||
| 0848+526bbPair. | 08 51 51.40 | +52 28 25.2 | 17.5 | 0.064 | -19.9 | 11-04-02 | 5000-7100 | SBN |
| 0944+540 | 09 47 55.94 | +53 50 00.5 | 16.84 | 0.488 | -25.5 | 14-04-02 | 6800-9000 | QSO |
| 1118+541 | 11 21 08.55 | +53 51 20.7 | 16.41 | 0.103 | -22.9 | 12-04-02 | 4800-7550 | NLS1 |
| 14-04-02 | 6500-8000 | |||||||
| 1136+594 | 11 39 08.91 | +59 11 54.5 | 16.26 | 0.060 | -21.5 | 11-04-02 | 5000-7100 | Sy 1.5 |
| 1136+595 | 11 39 00.48 | +59 13 46.7 | 17.0 | 0.115 | -22.1 | 12-04-02 | 4800-7580 | NLS1 |
| 14-04-02 | 6500-8000 | |||||||
| 1204+505BbbPair. | 12 06 55.55 | +50 17 36.8 | 16.64ccCalculated from SDSS photometric database using the Smith et al. (2002) set of transformation equations. | 0.062 | -21.3 | 13-04-02 | 5160-7210 | Sy 1.9 |
| (& Companion)ddA companion of SBS 1204+505B. | 12 06 52.40 | +50 17 24.3 | 17.08ccCalculated from SDSS photometric database using the Smith et al. (2002) set of transformation equations. | 0.063 | -20.8 | 13-04-02 | 5160-7210 | SBN |
| 1340+569bbPair. | 13 42 10.23 | +56 42 11.6 | 16.98 | 0.040 | -20.4 | 14-04-02 | 4800-7210 | Sy 1+SBN |
| 1626+554 | 16 27 56.11 | +55 22 31.9 | 16.17 | 0.134 | -23.4 | 12-04-02 | 4800-7580 | QSO |
| 14-04-02 | 6500-8000 |
| Line | 0848+526 | 0944+540 | 1118+541 | 1136+594 | 1136+595 | 1204+505B | Companion | 1340+569 | 1626+554 | |||||||||
|---|---|---|---|---|---|---|---|---|---|---|---|---|---|---|---|---|---|---|
| identification | EW | FWHM | EW | FWHM | EW | FWHM | EW | FWHM | EW | FWHM | EW | FWHM | EW | FWHM | EW | FWHM | EW | FWHM |
| 22 | 2420 | 31 | 4250 | |||||||||||||||
| 2nd component | 4 | 1650 | ||||||||||||||||
| [O III] | 1 | 710 | ||||||||||||||||
| Fe II | 29 | 37 | 54 | |||||||||||||||
| He II | 19 | 4690 | 33 | 10240 | 9 | 3560 | 13 | 5650 | ||||||||||
| n | 17 | 210 | 19 | 1040 | 4 | 250 | 24 | 1050 | 6 | 520 | 5 | 450 | 9 | 400 | ||||
| b | 33 | 2630 | 53 | 4110 | 61 | 2920 | 44 | 4120 | 18 | 3430 | 61 | 8860 | ||||||
| 2nd component | 81 | 2470 | 13 | 1720 | 65 | 3350 | ||||||||||||
| 3rd component | 112 | 13120 | ||||||||||||||||
| [O III] | 8 | 200 | 12 | 550 | 17 | 220 | 8 | 530 | 5 | 510 | 9 | 330 | 3 | 620 | ||||
| [O III] | 23 | 200 | 36 | 530 | 51 | 200 | 23 | 540 | 13 | 500 | 28 | 290 | 8 | 610 | ||||
| He I | 6 | 4340 | ||||||||||||||||
| Fe II | 101 | 46 | 34 | 43 | 78 | |||||||||||||
| He I | 4 | 170 | 8 | 5350 | 11 | 3990 | 6 | 1210 | 3 | 680 | 30 | 5460 | ||||||
| 2nd component | 2 | 920 | ||||||||||||||||
| [Fe VII] | 2 | 1050 | ||||||||||||||||
| [O I] | 3 | 160 | 1 | 490 | 4 | 340 | 3 | 320 | ||||||||||
| [Fe X] | 2 | 1230 | 3 | 330 | 6 | 1560 | ||||||||||||
| [N II] | 9 | 150 | 2 | 320 | 7 | 350 | 7 | 200 | 5 | 200 | 3 | 120 | ||||||
| n | 116 | 150 | 90 | 870 | 32 | 320 | 140 | 1000 | 30 | 200 | 39 | 200 | 38 | 110 | ||||
| b | 220 | 2970 | 222 | 3210 | 176 | 4870 | 37 | 3390 | 80 | 2260 | 320 | 3220 | ||||||
| 2nd component | 126 | 3600 | 289 | 6680 | ||||||||||||||
| [N II] | 27 | 190 | 6 | 320 | 19 | 350 | 20 | 200 | 15 | 210 | 9 | 110 | ||||||
| [S II] | 1 | 400 | 3 | 320 | 8 | 510 | 4 | 200 | 6 | 280 | ||||||||
| [S II] | 1 | 460 | 7 | 460 | 4 | 200 | 5 | 290 | ||||||||||
| Line | 0944+540 | 1118+541 | 1136+595 | |||
|---|---|---|---|---|---|---|
| identification | EW | FWHM | EW | FWHM | EW | FWHM |
| 28 | 1930 | |||||
| He II | 22 | 3270 | 42 | 8700 | ||
| b | 157 | 2700 | 73 | 1510 | 73 | 1480 |
| 2nd component | 65 | 3220 | ||||
| He I | 24 | 5220 | 13 | 1360 | ||
| b | 355 | 1380 | 334 | 1340 | ||
| SBS | [O III] | Fe II | [O I] | n | [N II] | [S II] |
|---|---|---|---|---|---|---|
| Designation | n | n | n | n | n | n |
| 0848+526 | 1.41 | 0.03 | 6.84 | 0.24 | ||
| 1118+541 | 1.86 | 1.81 | 0.02 | 3.60 | 0.02 | |
| 1136+594 | 10.88 | 6.53 | 0.11 | 7.83 | 0.20 | 0.09 |
| 1136+595 | 0.91 | 1.61 | 4.24 | 0.14 | 0.06 | |
| 1204+505B | 2.27 | 5.02 | 0.67 | 0.15 | ||
| Companion | 7.40 | 0.38 | 0.21 | |||
| 1340+569 | 3.09 | 0.08 | 3.26 | 0.23 |
| SBS | |||||||
|---|---|---|---|---|---|---|---|
| 0848+526 | 2.21 | 0.73 | 2.22 | 2.04 | 1.66 | 2.42 | 2.26 |
| 1118+541 | 0.42 | 0.14 | 0.42 | 0.39 | 0.31 | 0.46 | 0.43 |
| 1136+594 | 2.58 | 0.85 | 2.60 | 2.39 | 1.94 | 2.83 | 2.64 |
| 1136+595 | 0.87 | 0.29 | 0.88 | 0.81 | 0.65 | 0.96 | 0.89 |
| 1204+505B | 1.34 | 0.44 | 1.35 | 1.25 | 1.01 | 1.47 | 1.38 |
| Companion | 2.42 | 0.80 | 2.44 | 2.25 | 1.82 | 2.66 | 2.48 |
| 1340+569 | 0.14 | 0.05 | 0.14 | 0.13 | 0.10 | 0.15 | 0.14 |
| (light days) | |||||||||||||
|---|---|---|---|---|---|---|---|---|---|---|---|---|---|
| SBS | 5100 Å | 5100 Å | 5100 Å | [O III] | |||||||||
| 0944+540aaNot corrected for intrinsic reddening. | 11.69 | 10.16 | 169.62 | 281.19 | 9.63 | 9.85 | |||||||
| 1118+541 | 11.07 | 9.13 | 63.21 | 54.54 | 8.19 | 8.13 | 8 | .34 | -0 | .15 | |||
| 1136+594 | 11.62 | 9.84 | 151.18 | 166.90 | 8.28 | 8.32 | 6 | .64 | 1 | .64 | |||
| 1136+595 | 10.87 | 8.88 | 45.93 | 36.30 | 8.06 | 7.96 | 8 | .37 | -0 | .31 | |||
| 1204+505B | 10.70 | 6.82 | 35.23 | 8 | .24 | ||||||||
| 1340+569 | 9.82 | 7.38 | 8.60 | 3.40 | 7.17 | 6.77 | 7 | .29 | -0 | .12 | |||
| 1626+554aaNot corrected for intrinsic reddening. | 11.13 | 9.25 | 69.35 | 66.09 | 8.90 | 8.88 | 8 | .58 | 0 | .32 | |||