Spitzer identifications and classifications of submillimeter galaxies in giant, high-redshift Lyman- emission-line nebulae
Abstract
Using Spitzer Space Telescope IRAC (3.6–8m) and MIPS (24m) imaging, as well as Hubble Space Telescope optical observations, we identify the IRAC counterparts of the luminous power sources residing within the two largest and brightest Lyman- emitting nebulae (LABs) in the SA 22 protocluster at (LAB 1 and LAB 2). These sources are also both submillimeter galaxies (SMGs). From their rest-frame optical/near-infrared colors, we conclude that the SMG in LAB 1 is likely to be starburst dominated and heavily obscured (). In contrast, LAB 2 has excess rest-frame 2m emission (over that expected from starlight) and hosts a hard X-ray source at the proposed location of the SMG, consistent with the presence of an active galactic nucleus (AGN). We conclude that LAB 1 and LAB 2 appear to have very different energy sources despite having similar Lyman- spatial extents and luminosities, although it remains unclear whether on-going star-formation or periodic AGN heating is responsible for the extended Lyman- emission. We find that the mid-infrared properties of the SMGs lying in LAB 1 and LAB 2 are similar to those of the wider SMG population, and so it is possible that extended Lyman- haloes are a common feature of SMGs in general.
Subject headings:
galaxies: active — galaxies: high-redshift — infrared: galaxies1. Introduction
Narrow-band surveys have revealed an intriguing new population: giant, radio-quiet Lyman- emission-line nebulae (Steidel et al. 2000), which have been termed ‘Lyman- Blobs’ (LABs). These objects typically have linear extents of 10–100 kpc, and Lyman- luminosities of 1043-44 erg s-1, with the highest concentration currently known in the SA 22 proto-cluster at , with 35 confirmed objects (Matsuda et al. 2004). Similar objects have been discovered in other regions associated with rich, but primitive environments (Keel et al. 1999; Francis et al. 2001; Palunas et al. 2004), and extended Lyman- emission has been detected around certain high-redshift radio galaxies (e.g. Reuland et al. 2003); however, the narrow-band selected LABs are typically not associated with such radio-loud systems.
Cooling-flows or shock heating by outflows originating from starburst winds or AGN jets have been proposed as the most plausible mechanisms for producing these extended Lyman- haloes (Taniguchi & Shioya 2000; Ohyama et al. 2003), although other processes such as sub-sonic heating, and inverse Compton scattering of Sunyaev-Zelodovich photons could also play a role (Scharf et al. 2003). The two largest known LABs (LAB 1 and LAB 2, with spatial extents of 1.1 kpc2 and 0.8 kpc2 respectively, both at in SA 22; Matsuda et al. 2004) are both associated with submillimeter galaxies (SMGs) (Chapman et al. 2001). Several other LABs in the SA 22 structure at contain SMGs (Geach et al. 2005) – the apparent association of these bolometrically luminous galaxies with LABs provides support for the scenario where feedback mechanisms are powering the Lyman- emission, since the bolometric luminosities of the SMGs are several orders of magnitude larger than the Lyman- luminosities of the haloes. The action of superwind feedback has recently been given credence by integral field data which reveals outflows and complex velocity structures in both LAB 1 and LAB 2 (Bower et al. 2004; Wilman et al. 2005). However, the precise location and identification of the SMG counterparts, and hence accurate constraints on the dominant power sources, are unclear due to the poor spatial resolution of the submillimeter data (Chapman et al. 2004).
In this Letter, we present Spitzer Space Telescope (SST) mid-infrared and Hubble Space Telescope (HST) optical imaging of the galaxies embedded within LAB 1 and LAB 2 to locate the bolometrically luminous sources within them – the SMGs. To identify these galaxies, we exploit the fact that mid-infrared observations have been shown to be effective at identifying SMGs, particularly at 8m since these galaxies have red infrared colors (Ashby et al. 2006). The mid-infrared photometry also constrains their rest-frame optical–radio spectral energy distributions (SEDs) and hence can shed light on what is powering these sources. Throughout we adopt , and km s-1 Mpc-1. In this geometry, 1′′ corresponds to 7.1 kpc at .
2. Observations & Reduction
The SST observations used here are part of GTO project #64, which we retrieved from the Spitzer Science Center (SSC) archive. LAB 1 and LAB 2 are covered by all four IRAC channels (3.6–8m), and we use the Post Basic Calibrated IRAC frames generated by the pipelines at the SSC. Both LABs were also observed by MIPS at 24m as part of the same project, and for these data we perform post-processing on Basic Calibrated Data frames to remove common MIPS artifacts and flatten small and large-scale gradients using ‘master-flats’ generated from the data. For mosaicking we use the SSC mopex package, which makes use of the supplementary calibration files which are supplied with the main science set. We use SExtractor (v2.4.4, Bertin & Arnouts 1996) to detect and extract sources in the mid-infrared images. Fluxes are measured in apertures with diameters chosen to be the same as in the SWIRE ELAIS-N1 catalog111see Surace, J. A. et al. 2004, VizieR Online Data Catalog, 2255: 3.8′′ for IRAC and 12′′ for MIPS.
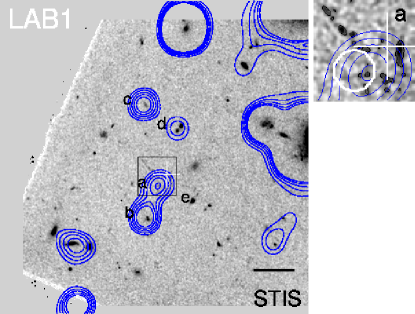
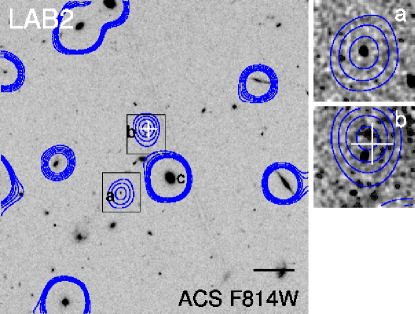
In addition to the mid-infrared data, we analyse optical HST observations of the LABs, to reveal the rest-frame ultra-violet (UV) morphologies of the galaxies in the LAB haloes. The STIS coverage of LAB 1 has been previously discussed by Chapman et al. (2004), while the Advanced Camera for Surveys (ACS) F814W (-band) imaging of LAB 2 is presented here for the first time. The ACS data was reduced using Multidrizzle, and will be described in more detail in J. E. Geach et al. (2006, in preparation).
3. Identification of the SMGs
As the precise location of the SMGs within the LAB haloes is uncertain, we begin our discussion by identifying the mid-infrared counterparts to the SMGs (which we assume to be the dominant power-source of the LABs). Starting with a catalogue of the IRAC-detections within each Lyman- halo222For mid-infrared detections within the Lyman- haloes, we adopt the alphabetical suffix LAB 1a, LAB 1b, etc., although this does not imply that these objects are physically associated with the LAB. (Table 1), we aim to eliminate sources not at , and then identify the most likely mid-infrared counterpart (if any) to the SMG in each case. Note that no sources are detected at 24m within the extent of either LAB, and so we adopt 3- upper limits of Jy.
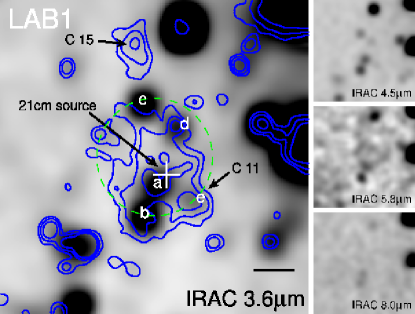
Figure 1 shows HST and IRAC images of the LABs covering 3.6–8m, and we label each of our potential counterparts. Of the five IRAC components in LAB 1 (a–e), we can eliminate several of them as the SMG counterpart immediately: LAB 1c and d have mid-infrared colors , making them inconsistent with galaxies (Ashby et al. 2006), while LAB 1e is at the position of the Lyman-break galaxy (LBG) C 11, and is only weakly detected at 3.6m and undetected at –m. Although this LBG is close to LAB 1, it appears to be kinematically distinct from the bulk of the halo (Bower et al. 2004) and so we discount it – leaving LAB 1a and b as potential counterparts.
The positional uncertainty between LAB 1a and the 850m centroid () is consistent with it being the source of the submm emission. The remaining IRAC counterpart to the south-east of the SMG (LAB 1b) is just within the Lyman- halo, and has a bright counterpart in the STIS imaging. It is not clear from the mid-infrared colors whether this galaxy is at the halo redshift, but given its large separation from the nominal submillimeter position, it is unlikely that it is associated with the power-source. However, if LAB 1b is at , it is possible that LAB 1a and b are interacting given their projected separation of just 4′′ (30 kpc at ).
Previous multi-wavelength observations of LAB 1 (Chapman et al. 2004) associated the SMG with the brightest of a group of UV fragments near the geometrical center of the structure and close to the 21 cm source position (Fig. 1). Component LAB 1a is in the vicinity of this group of faint UV fragments, but the 3.6–8m emission is coincident with a Extremely Red Object (ERO) identified in Steidel et al. (2000), rather than the brightest UV component (‘J1’ in Chapman et al. 2004) which is closest to the radio peak (and a tentative CO(43) detection). Both LAB 1a and the UV object J1 are plausible sources of the submm emission. However, given that SMGs are expected to be massive, we view the 3.6–8m detection as a more reliable indicator of the SMG’s counterpart than the weak UV source. We therefore propose that LAB 1a is the most likely IRAC counterpart to the SMG in LAB 1
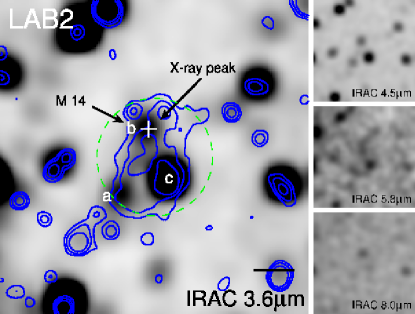
There are three mid-infrared counterparts within the extent of LAB 2 (Fig. 1, Table 1). We can eliminate LAB 2c immediately as a potential counterpart given its blue mid-infrared colors and large, bright optical counterpart in the HST image – it is a foreground object. The remaining two counterparts LAB 2a and LAB 2b have similar 3.6–5.8m characteristics, and similar compact HST morphologies (Fig. 1). However, only LAB 2b is detected at 8m, which has been shown to be a useful identifier of the mid-infrared counterparts of SMGs (Ashby et al. 2006). Moreover, LAB 2 contains a hard X-ray source in the halo (Basu-Zych & Scharf 2004), with an estimated luminosity erg s-1. The location of the X-ray source is consistent with LAB 2b (), whereas LAB 2a is in the extreme south-east of the LAB, 8.5′′ away from the X-ray source. Given the association between SMGs and moderately bright X-ray sources (Alexander et al. 2005a), the SMG in LAB 2 is likely to lie close to the position of the X-ray source. We therefore propose that LAB 2b is the mid-infrared counterpart to the SMG in LAB 2333LAB 2b is also at the location of the LBG M 14, although in this case the LBG appears kinematically associated with the wider halo (Wilman et al. 2005). We note that in the submillimeter observation of this halo, LAB 2b is actually situated near to the edge of the SCUBA beam (Fig. 1). The correction to the 850m flux to account for this offset would make the SMG brighter, with mJy (Chapman et al. 2001).. The precise positions of the SMGs in LAB 1 and LAB 2 and the offsets to the other mid-infrared components are given in Table 1.
4. Classification of the SMGs
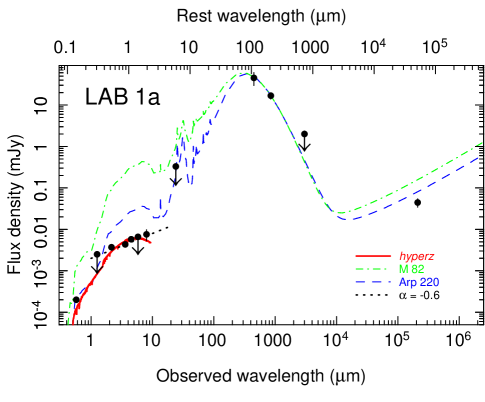
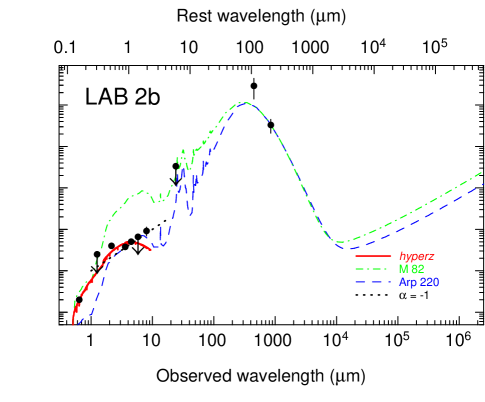
We can use the 3.6–8m photometry (along with multi-wavelength data for these objects from the literature; Chapman et al. 2001, 2004; Steidel et al. 2000) to construct the optical–radio SEDs for the SMGs (Figure 2). We present new and band photometry from the UKIDSS-Deep Extragalactic Survey (to be discussed in Stott et al. 2007 in prep). We note that the poor constraints on the ratio means that we cannot make robust conclusions about the rest-frame mid-to-far infrared differences between LAB 1a and LAB 2b. Both have upper limits consistent with obscured ULIRGs at (Pope et al. 2006). Similarly the limits of the observed ratios for LAB 1a and LAB 2b are consistent with other SMGs at , although the ratio for LAB 1a is at the low end of the distribution (Pope et al. 2006) indicating either a relatively low stellar mass for this system, or more likely very high obscuration. Thus, the SMGs associated with LABs are similar to the wider SMG population.
We now examine the rest-frame near-infrared portion of the SEDs using the IRAC data. Near-infrared colors have been shown to be a useful diagnostic for the power-source of local luminous infrared galaxies (e.g. Spinoglio et al. 1995). For LAB 1a we find rest-frame (Vega) colors and , and in LAB 2b we find and . LAB 1a’s colors are similar to that of ‘normal’ galaxies (, ; Spinoglio et al. 1995), whereas LAB 2b exhibits a redder rest-frame color, indicating an excess in the rest-frame -band likely associated with a non-stellar contribution. We fit a simple power-law, , to the IRAC photometry for LAB 2b, obtaining , similar to that expected for AGN (Alonso-Herrero et al. 2006).
Mid-IR properties of sources lying within LABs (1) (2) Component 3.6m 4.5m 5.8m 8.0m (′′) (Jy) LAB 1a……… 0. 0 0. 0 4. 3 5. 8 ¡ 6. 6 7. 6 b……… 1. 5 3. 4 5. 5 7. 3 7. 6 7. 9 c……… 1. 5 10. 7 4. 8 3. 8 6. 6 6. 6 d……… 3. 0 7. 7 2. 8 1. 9 6. 6 6. 6 e……… 4. 5 1. 4 1. 5 0. 9 6. 6 6. 6 LAB 2a……… 3. 0 7. 7 3. 4 4. 1 6. 6 6. 6 b……… 0. 0 0. 0 3. 8 5. 0 ¡6. 6 9. 2 c……… 3. 0 5. 5 16. 3 12. 0 8. 1 6. 6
To further test if the optical-mid-infrared SEDs of the sources can be reproduced by stellar populations, we use hyperz (Bolzonella, Miralles & Pello 2000) to model the stellar continuum by fitting to the rest-frame 0.15–2m photometry. We adopt a model with an exponentially declining SFR, with Gyr, from Bruzual & Charlot (1993) and constrain the redshift to be . Dust is modelled with a Calzetti law (Calzetti et al. 2000). The rest-frame optical–near-infrared portions of the SEDs are well fit by this model, with high-reddening () and young ages. Absolute -band magnitudes based on the fit are in LAB 1a and for LAB 2b. These absolute rest-frame -band magnitudes are comparable to the wider SMG population (Borys et al. 2005), and suggest stellar masses of , although the -band magnitude of LAB 2b is likely to be contaminated by AGN emission, with a significant rest-frame 2m excess over the hyperz fit of 5Jy. The detection of X-ray emission from LAB 2b is the best evidence we have that it contains an AGN. To quantitatively test the correspondence between the mid-infrared excess and the X-ray emission we use the rest-frame X-ray–10.5m correlation for AGN from Krabbe et al. (2002). We predict the rest-frame 10.5m emission for LAB 2b by extrapolating the rest-frame 2m using the measured spectral slope of . With this approach we estimate the X-ray luminosity from the AGN to be of order erg s-1, in reasonable agreement with that observed (Basu-Zych & Scharf 2004). The luminosity of the X-ray source is consistent with a moderate contribution to the bolometric emission from an AGN (Alexander et al. 2005b), however it is still not clear if an AGN or starburst is responsible for powering the extended Lyman- emission. LAB 1a’s rest-frame -band excess over the best fit stellar template, of 32 Jy is less significant. Nevertheless, taking the same approach as for LAB 2b, we predict an X-ray luminosity of erg s-1, consistent with the 2–10 keV limit in the existing Chandra observations.
To make progress we need mid-infrared observations of a larger sample of LABs in SA 22, four of which also contain SMGs (Geach et al. 2005). This will allow us to investigate whether they also exhibit rest-frame near-infrared characteristics similar to the general submillimeter population. Searches for obscured AGN in SA 22 will also be significantly advanced by a recently approved 400 ks Chandra ACIS-I exposure of this region. Together these studies will provide a clearer view of the energetics of LABs and their relationship to the wider SMG population.
We thank an anonymous referee for helpful comments which greatly improved the clarity of this work. We also appreciate useful discussions with Richard Wilman, Mark Swinbank, Yuichi Matsuda and Toru Yamada. J.E.G. and J.P.S. thank the U. K. Particle Physics and Astronomy Research Council for financial support. I.R.S. and D.M.A. acknowledge the Royal Society.
References
- (1) Alexander, D. M., Smail, I., Bauer, F. E., Chapman, S. C., Blain, A. W., Brandt, W. N., Ivison, R. J., 2005a, Nature, 434, 738
- (2) Alexander, D. M., Bauer, F. E., Chapman, S. C., Smail, I., Blain, A. W., Brandt, W. N., Ivison, R. J., 2005b, ApJ, 632, 736
- alonso-herrero (06) Alonso-Herrero, A., Pérez-González, P. G., Alexander, D. M., Rieke, G. H., Rigopoulou, D., Le Floc’h, E., Barmby, P., Papovich, C., et al., 2006, ApJ, 640, 167
- ashby (06) Ashby, M. L. N., Dye, S., Huang, J.-S., Eales, S., Willner, S. P., Webb, T. M. A., Barmby, P., Rigopoulou, D., et al., 2006, ApJ, 644, 778
- (5) Basu-Zych, A. and Scharf, C, 2004, ApJ, 615, L85
- bolzonella (00) Bolzonella, M, Miralles and J.-M., Pello, R., 2000, A&A, 363, 476
- borys (05) Borys, C., Smail, I., Chapman, S. C., Blain, A. W., Alexander, D. M., Ivison, R. J., 2005, AJ, 635, 853
- bower (04) Bower, R. G., Morris, S., L., Bacon, R., Wilman, R. J., Sullivan, M., Chapman, S., Davies, R. L., de Zeeuw, P. T., Emsellem, E., 2004, MNRAS, 351, 63
- bc (93) Bruzual, G. and Charlot, S., 1993, ApJ, 405, 538
- calzetti (00) Calzetti, D., Armus, L., Bohlin, R. C., Kinney, A. L., Koorneef, J., Storchi-Bergmann, T., 2000, ApJ, 533, 682
- chapman (01) Chapman, S. C., Lewis, G. F., Scott, D., Richards, E., Borys, C., Steidel, C. C., Adelberger, K. L., Shapley, A. E., 2001, ApJ, 548, L17
- chapman (04) Chapman, S. C., Scott, D., Windhorst, R. A., Frayer, D. T., Borys, C., Lewis, G. F., Ivison, R. J., 2004, ApJ, 606, 85
- francis (01) Francis, P. J., Williger, G. M., Collins, N. R., Palunas, P., Malumuth, E. M., Woodgate, B. E., Teplitz, H. I., Smette, A., et al., 2001, ApJ, 554, 1001
- geach (05) Geach, J. E., Matsuda, Y., Smail, I., Chapman, S. C., Yamada, T., Ivison, R. J., Hayashino, T., Ohta, K., et al., 2005, MNRAS, 363, 1398
- keel (99) Keel, W. C., Cohen, S. H., Windhorst, R. A., Waddington, I., 1999, AJ, 118, 2547
- krabbe (02) Krabbe, A., Böker, T. & Maiolino, R., 2002, ASP Conf. Ser. 258: Issues in Unification of Active Galactic Nuclei, 33
- lacy (04) Lacy, M., Storrie-Lombardi, L. J., Sajina, A., Appleton, P. N., Armus, L., Chapman, S. C., Choi, P. I., Fadda, D., et al., 2004, ApJS, 154, 166
- lutz (05) Lutz, D., Valiante, E., Sturm, E., Genzel, R., Tacconi, L. J., Lehnert, M. D., Sternberg, A., Baker, A. J., 2005, ApJ, 625, L83
- ohyama (03) Ohyama, Y., Taniguchi, Y., Kawabata, K. S., Shioya, Y., Murayama, T., Nagao, T., Takata, T., Iye, M. et al., 2003, ApJ, 591, L9
- palunas (04) Palunas, P., Teplitz, H. I., Francis, P. J., Williger, G. M., Woodgate, B. E., 2004, ApJ, 602, 545
- polletta (06) Polletta, M. del C., Wilkes, B. J., Siana, B., Lonsdale, C. J., Kilgard, R., Smith, H. E., Kim, D.-W., Owen, F., et al., 2006, ApJ, 642, 673
- pope (06) Pope, A., Scott, D., Dickinson, M., Chary, R.-R., Morrison, G., Borys, C., Sajina, A., Alexander, D. M., et al., 2006, MNRAS, 370, 1185
- matsuda (04) Matsuda, Y., Yamada, T., Hayashino, T., Tamura, H., Yamauchi, R., Ajiki, M., Fujita, S. S., Murayama, T., et al., 2004, ApJ, 128, 569
- reuland (03) Reuland, M., van Breugel, W., Röttgering, H., de Vries, W., Stanford, S. A., Dey, A., Lacy, M., Bland-Hawthorn, J., et al., 2003, ApJ, 592, 755
- scharf (03) Scharf, C. A., Smail, I., Ivison, R., Bower, R., van Breugel, W., Reuland, M., 2003, ApJ, 596, 105
- silva (98) Silva, L., Granato, G. L., Bressan, A., Danese, L., 1998, ApJ, 509, 103
- spinoglio (95) Spinoglio, L., Malkan, M. A., Ruch, B., Carrasco, L., Recillas-Cruz, E., 1995, ApJ, 453, 616
- steidel (00) Steidel, C., Adelberger, K. L., Shapley, A. E., Pettini, M., Dickinson, M., Giavalisco, M., 2000, ApJ, 532, 170
- taniguchiandshioya (00) Taniguchi, T. and Shioya, Y., 2000, ApJ, 532, L13
- wilman (05) Wilman, R. J., Gerssen, J., Bower, R. G., Morris, S. L., Bacon, R., de Zeeuw, P. T., Davies, R. L., 2005, Nature, 436, 227