Chandra Observation of the Big Dipper X 1624–490
We present the results of a 73 ks long Chandra observation of the dipping source X 1624–490. During the observation a complex dip lasting 4 hours is observed. We analyse the persistent emission detecting, for the first time in the 1st-order spectra of X 1624–490, an absorption line associated to Ca xx. We confirm the presence of the Fe xxv Kα and Fe xxvi Kα absorption lines with a larger accuracy with respect to a previous XMM observation. Assuming that the line widths are due to a bulk motion or a turbulence associated to the coronal activity, we estimate that the lines have been produced in a photoionized absorber between the coronal radius and the outer edge of the accretion disk.
Key Words.:
accretion, accretion disks – stars: individual: XB 1624–490 — stars: neutron — X-rays: stars — X-rays: binaries — X-rays: general1 Introduction
About 10 Low Mass X-ray Binaries (LMXB) are known to show periodic dips in their X-ray light curves and most of them also show X-ray burst activity. The dip intensities, lengths and shapes change from source to source, and, for the same source, from cycle to cycle. Among the dipping sources, X 1624–490 (4U 1624–49) exhibits irregular dips with a long orbital period of 21 hr (Watson et al., 1985) suggesting that the source has the largest stellar separation and for this reason it is called the ”Big Dipper”. Dipping is deep, during the dips the flux in the band 1–10 keV decreases of 75% with respect to the persistent flux. The source also exhibits strong flaring in which the X-ray flux can increase by 30% over timescales of a few thousand seconds (Church & Balucinska-Church 1995), but no X-ray bursts have been observed (e.g., Balucinska-Church et al. 2001, Smale et al. 2001). Another peculiarity of X 1624–490 is that it is the most luminous dipping source with a 1–30 keV luminosity of erg s-1 (Balucinska-Church et al., 2000) assuming a distance to the source of 15 kpc (Christian & Swank, 1997). Jones & Watson (1989) studied the spectrum of X 1624–490 taken from a long Exosat observation of 220 ks and from Ginga, modelling the continuum emission with a blackbody plus a bremsstrahlung component. Church & Balucinska-Church (1995) reanalysed the Exosat observation fitting the continuum of X 1624–490 with a blackbody plus a cutoff power law. Balucinska-Church et al. (2000) modelled the broad band BeppoSAX spectrum of X 1624–490 during the persistent emission adopting a blackbody plus a Comptonization model (described by a cutoff power law) with a blackbody temperature of 1.3 keV, a photon index of 2, and a cutoff energy of 12 keV during the persistent emission; during the deep dipping the blackbody component was totally absorbed while the Comptonized component was little absorbed. The continuum emission was absorbed by neutral matter having an equivalent hydrogen column of cm-2 larger than the expected Galactic one. This large value could be explained by the presence of a dust scattered halo around the source, demonstrated by Angelini et al. (1996).


Parmar et al. (2002) studied X 1624–490 using a 52 ks XMM-Newton EPIC observation. The continuum of the persistent emission in the 2–10 keV EPIC pn spectrum was fitted using a blackbody, with a temperature of 1.2 keV, plus a power-law component with a photon index of 2. The spectrum showed also narrow features which were identified as Fe xxv Kα and Fe xxvi Kα absorption lines centered at and keV, with upper limits on the line widths of 56 and 50 eV, respectively. Furthermore, a Fe emission line centered at 6.58 keV with a width and an equivalent width of 470 and 78 eV, respectively.
Finally we note that the improved sensitivity and spectral resolution of Chandra and XMM-Newton are allowing to observe narrow absorption features, from highly ionized ions (H-like and He-like), in a larger and larger number of X-ray binaries. These features were detected in the micro-quasars GRO J1655–40 (Ueda et al. 1998; Yamaoka et al. 2001) and GRS 1915+105 (Kotani et al. 2000; Lee et al. 2002). Recently the Chandra High-Energy Transmission Grating Spectrometer (HETGS) observations of the black hole candidate H 1743–322 (Miller et al. 2004) have revealed the presence of blue-shifted Fe xxv and Fe xxvi absorption features suggesting the presence of a highly-ionized outflow. All LMXBs those exhibit narrow X-ray absorption features are all known dipping sources (see Table 5 of Boirin et al. 2004) except for GX 13+1. This source shows deep blue-shifted Fe absorption features in its HETGS spectrum, again indicative of outflowing material (Ueda et al. 2004). We conclude this brief resume observing that a recent Chandra spectral analysis of the dipping source XB 1916–053 showed the presence of several absorption features associated to Ne x, Mg xii, Si xiv and S xvi, Fe xxv and Fe xxvi (see Iaria et al., 2006a; Juett & Chakrabarty, 2006).
In this work we present a spectral analysis of the persistent emission from the dipping source X 1624–490 in the 1.7–10 keV energy range using a long 73 ks Chandra observation (Obsid 4559 in the archive of public Chandra observations). During the observation a complex dip lasting 4 hr was present, we excluded it from our analysis. We fitted the continuum emission adopting three statistically equivalent models: a Comptonized component with an electron temperature of 1.9 keV, a blackbody plus a power law, and a cutoff power law. We clearly detected a Fe xxvi Kα absorption line, already observed with the XMM observation; the better energy resolution of Chandra and the larger statistics allowed to well determine its width. Moreover we weakly detected a Fe xxv Kα absorption line and, for the first time in the spectra of this source, a Ca xx absorption line. We discuss the possible production mechanisms of these absorption features and the physical geometry of absorbing medium.
2 Observation
X 1624–490 was observed with the Chandra observatory on 2004 June 04 from 06:26:06 to 2004 June 05 03:46:17 UT using the High Energy Transmission Grating Spectrometer (HETGS). The observation had a total integration time of 73 ks, and was performed in timed graded mode. The HETGS consists of two types of transmission gratings, the Medium Energy Grating (MEG) and the High Energy Grating (HEG). The HETGS affords high-resolution spectroscopy from 1.2 to 31 Å (0.4–10 keV) with a peak spectral resolution of at 12 Å for HEG first order. The dispersed spectra were recorded with an array of six charge-coupled devices (CCDs) which are part of the Advanced CCD Imaging Spectrometer-S (Garmire et al., 2003)111See http://asc.harvard.edu/cdo/about_chandra for more details.. We processed the event list using the standard software (FTOOLS v6.0.2 and CIAO v3.2 packages) and computed aspect-corrected exposure maps for each spectrum.
The brightness of the source required additional efforts to mitigate “photon pileup” effects. A 512 row “subarray” (with the first row = 1) was applied during the observation reducing the CCD frame time to 1.74 s. Pileup distorts the count spectrum because detected events overlap and their deposited charges are collected into single, apparently more energetic, events. Moreover, many events () are lost as the grades of the piled up events overlap those of highly energetic background particles and are thus rejected by the on board software. We, therefore, ignored the zeroth-order events in our spectral analysis. On the other hand, the grating spectra were not, or only moderately (less than 10 %), affected by pileup. In this work we analysed the 1st-order HEG and MEG spectra. To precisely determine the zero-point position in the image, we estimated the mean crossing point of the zeroth-order readout trace and the tracks of the dispersed HEG and MEG arms. In Fig. 1 we showed the 200 s bin time lightcurve taking into account only the events in the positive first-order HEG. During the observation was present a dip lasting around 4 hrs and showing a complex nature of the occulting bulge in the outer disk. The count rate during the persistent emission and the dipping episodes was around 1.5 and 0.15 count s-1, respectively, with a decrease of the intensity of 77%, as aspected for this source (Church, & Balucinska-Church, 1995). Finally we noted that no flare activity was observed during the persistent emission.

We analysed the RXTE ASM lightcurve of X 1624–490 observing that during the previous BeppoSAX observation (Balucinska-Church et al., 2000), the previous XMM observation (Parmar et al., 2002), and our observation the ASM count rate was around 3.5 counts s-1 suggesting a similar intensity of the source. In Fig. 2 we showed the ASM lightcurve of X 1624–490 and indicated the start times of the three observations.
3 Spectral Analysis
Since the lightcurve and the hardness ratio of the source did not show any significant change during the persistent emission we selected the 1st-order spectra from the HETGS data obtaining a total effective time of 65 ks. Data were extracted from regions around the grating arms; to avoid overlapping between HEG and MEG data, we used a region size of 25 and 33 pixels for the HEG and MEG, respectively, along the cross-dispersion direction. The background spectra were computed by extracting data above and below the dispersed flux. The contribution from the background is of the total count rate. We used the standard CIAO tools to create detector response files (Davis 2001) for the HEG -1 (MEG -1) and HEG +1 (MEG +1) order (background-subtracted) spectra. After verifying that the negative and positive orders were compatible with each other in the whole energy range we coadded them using the script add_grating_spectra in the CIAO software, obtaining the 1st-order MEG spectrum and the 1st-order HEG spectrum. Finally we rebinned the resulting 1st-order MEG and 1st-order HEG spectra to 0.015 Å and 0.0075 Å, respectively.
To fit the continuum we rebinned the resulting 1st-order MEG and 1st-order HEG spectra to 0.015 Å and 0.0075 Å, respectively. After the extraction of the spectra we analysed the energy range 1.7–7 keV and 1.9–10 keV for first-order MEG and first-order HEG, respectively, because the low statistics below 1.7 keV due to the large absorption of neutral matter. Initially we fitted the continuum using a model composed of blackbody plus a power law obtaining a (d.o.f.) of 899(1145). We found an absorbing equivalent hydrogen column of N cm-2, a photon index of 2.2, a power-law normalization of 0.61, a blackbody temperature of 1.5 keV, and a blackbody normalization of . We observed in the residuals the presence of an excess between 6 and 7 keV, a prominent absorption line near 7 keV and two absorption lines at 4 and 6.7 keV. We modelled the excess adding a Gaussian emission line and the absorption lines adding three Gaussian lines with negative normalizations. The addition of these components improved the fit with a (d.o.f.) of 812(1133) and the statistical significance of the lines in unit of was 2.8, 3.2, 2.9 and 5.7 corresponding to the emission line and the absorption lines at 4 keV, 6.7 keV and 7 keV, respectively. We obtained an absorbing equivalent hydrogen column of N cm-2, a photon index of 2.0, a power-law normalization of 0.41, a blackbody temperature of 1.39 keV, and a blackbody normalization of . The energy centroid, the width, and the equivalent width of the emission line were 6.72 keV, 500 eV, and 100 eV, respectively. The energy centroid, the width, and the equivalent width of the prominent absorption line were 6.98 keV, 21 eV, and -22 eV, respectively; we identified it as a Fe xxvi Kα absorption line. The two weak absorption lines were associated to Ca xx Kα and Fe xxv Kα, respectively. The energy centroid, the width, and the equivalent width of the Ca xx absorption line were 4.095 keV, eV, and -3 eV, respectively. The energy centroid, the width, and the equivalent width of the Fe xxv absorption line were 6.71 keV, eV, and -9 eV, respectively. The best values and the corresponding errors of the continuum and of the lines are reported in Tabs. 1 and 2. Finally, assuming a distance to the source of 15 kpc (Christian & Swank, 1997; hereafter we assume this value of distance to the source) we extrapolated an unabsorbed luminosity of ergs s-1 in the 0.6–10 keV energy range.
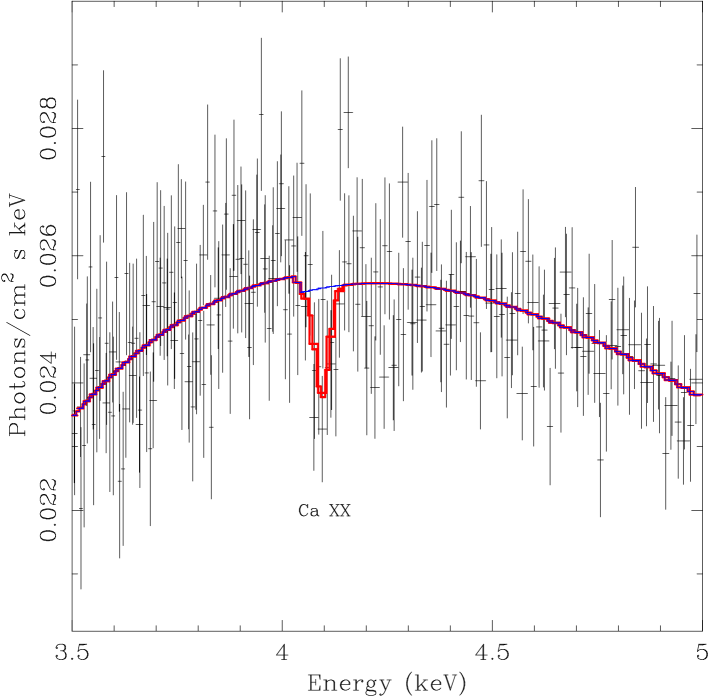
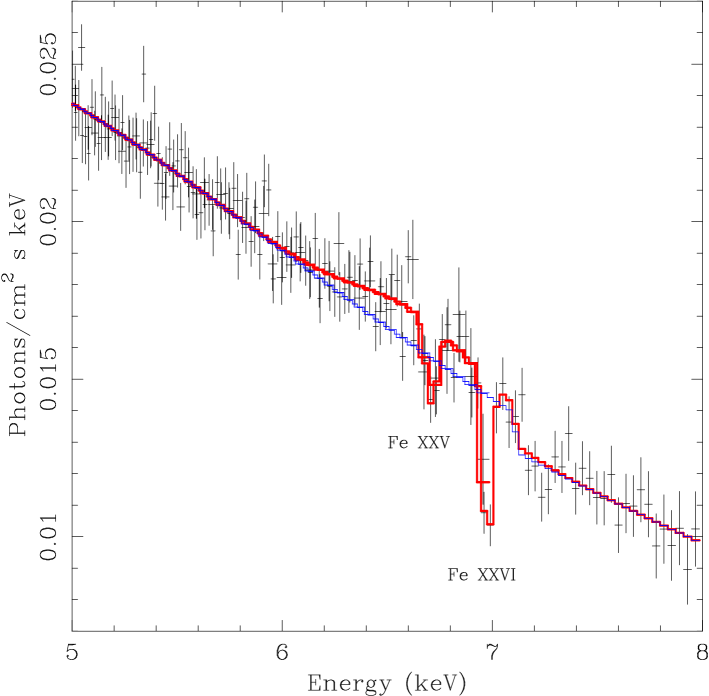
The spectrum was equivalently well fitted using as continuum a Comptonized component (Comptt in XSPEC; Titarchuk, 1994) instead of a blackbody plus a power law. Adopting the Comptt component we obtained that the seed-photon temperature k was 0.63 keV, the electron temperature k was 1.88 keV, and the optical depth of the Comptonizing cloud (assuming a spherical geometry) was 22. We extrapolated an unabsorbed luminosity of ergs s-1 in the 0.6–10 keV energy range, this value is slightly lower than that obtained using a blackbody plus a power law because of the different values of the absorbing hydrogen column. In this case the Gaussian emission line is better constrained; the centroid, the width, the equivalent width and the significance of the emission line were 6.64 keV, 280 eV, 49 eV, and 3.1. The parameters of the absorption lines are quite similar to those obtained using the previous model. The results of the fit are reported in Tabs. 3 and 4, in Fig. 3 we showed the best-fit continuum around the Ca xx absorption line and the Fe Kα region overplotting the emission and absorption lines. Finally we adopted the Comptonized component as continuum and substituted the Gaussian emission line with an emission line from a relativistic accretion disk (diskline in XSPEC; Fabian et al., 1989) fixing the inclination angle of the source at 65∘, typical value for a dipping source not showing eclipses. Also in this case we obtained statistically equivalent parameters of the continuum and the absorption lines, we obtained an inner radius cm, an outer radius cm and an emissivity of the disk scaling as , where is the radial distance from the compact object. The parameters of the diskline model were reported in Tab. 5.
| Continuum + emission line | |
|---|---|
| kTBB (keV) | |
| NBB () | |
| photon index | |
| Npo | |
| Eline (keV) | |
| (eV) | |
| Iline ( cm-2 s-1) | |
| EWline (eV) | |
| FWHMline (km s-1) | |
| Significance | 2.8 |
| L0.6-10keV erg s-1 | |
| (d.o.f.) | 814(1133) |
| Absorption Lines | |
|---|---|
| ECa20 (keV) | |
| Ca20 (eV) | |
| ICa20 ( cm-2 s-1) | |
| EWCa20 (eV) | |
| FWHMCa20 (km s-1) | |
| Significance | 3.2 |
| EFe25 (keV) | |
| Fe25 (eV) | |
| IFe25 ( cm-2 s-1) | |
| EWFe25 (eV) | |
| FWHMFe25 (km s-1) | |
| Significance | 2.9 |
| EFe26 (keV) | |
| Fe26 (eV) | |
| IFe26 ( cm-2 s-1) | |
| EWFe26 (eV) | |
| FWHMFe26 (km s-1) | |
| Significance | 5.7 |
| Continuum + emission line | |
|---|---|
| kT0 (keV) | |
| kTe (keV) | |
| NComptt | |
| Eline (keV) | |
| (eV) | |
| Iline ( cm-2 s-1) | |
| EWline (eV) | |
| Significance | 3.1 |
| L0.6-10keV erg s-1 | |
| (d.o.f.) | 817(1133) |
| Absorption Lines | |
|---|---|
| ECa20 (keV) | |
| Ca20 (eV) | |
| ICa20 ( cm-2 s-1) | |
| EWCa20 (eV) | |
| FWHMCa20 (km s-1) | |
| Significance | 3.5 |
| EFe25 (keV) | |
| Fe25 (eV) | |
| IFe25 ( cm-2 s-1) | |
| EWFe25 (eV) | |
| FWHMFe25 (km s-1) | |
| Significance | 2.7 |
| EFe26 (keV) | |
| Fe26 (eV) | |
| IFe26 ( cm-2 s-1) | |
| EWFe26 (eV) | |
| FWHMFe26 (km s-1) | |
| Significance | 4.5 |
| Continuum + emission line | |
|---|---|
| Ediskline (keV) | |
| Emissivity slope | |
| Rin (cm) | |
| Rout (cm) | |
| Idiskline ( cm-2 s-1) | |
| EWline (eV) |
4 Discussion
We have analyzed a 65 ks Chandra observation of the persistent emission from X 1624–490 performing a spectral analysis of the persistent emission using the 1st-order MEG and HEG spectra. The continuum emission was equivalently well fitted adopting a model composed of either a blackbody plus a power law or a Comptonized component (Comptt; Titarchuk, 1994). A power law was chosen rather that a cutoff power law since the cutoff energy of 12 keV (Balucinska-Church et al., 2000) was too high to be estimated in the Chandra energy range; the same model was adopted by Parmar et al. (2002) to fit the persistent emission continuum of the source using XMM EPIC data. We obtained similar best-fit parameters to those obtained by Balucinska-Church et al. (2000) and Parmar et al. (2002) obtaining an extrapolated unabsorbed luminosity of erg s-1 in the 0.6–10 keV energy range.
Using as continuum a blackbody plus a power law we noted that the best-fit value of the absorbing equivalent hydrogen column NH was cm-2, compatible with the value obtained by Balucinska-Church et al. (2000), on the other hand using as continuum the Comptonized component NH was cm-2. Although the column density of X 1624–490 is high, radio measurements indicated a lower value of cm-2 (Dickey & Lockman 1990; Stark et al. 1992), so that could be possible that the high value of NH can be due to absorption intrinsic to the source, as already suggested by Angelini et al. (1997) and Diaz-Trigo et al. (2005).
We noted that the model composed of a blackbody component plus a power law in the energy range 0.6–10 keV could be compatible with the Birmingham Model (Church & Balucinska-Church, 2004), where the blackbody emission is produced by a thermalized emission from the neutron star and the cutoff power law is the Comptonized emission from an extended accretion disk corona (ADC) above the accretion disk. However the blackbody radius obtained from the best-fit parameters was km, smaller than the typical neutron star radius of 10 km, suggesting that part of the thermal emission is occulted. The model composed of a Comptonized component indicated that we were not observing the primary emission from the neutron star and/or the inner accretion disk. Under this hypothesis the Comptonized emission could be produced in an extended accretion disk corona (ADC) embedding the accretion disk and the neutron star, in the following we discussed this scenario. We assumed a spherical geometry of the Comptonizing cloud although we cannot exclude a different geometry. Following in’t Zand et al. (1999) we calculated the radius, RW, of the seed-photon emitting region using the parameters reported in Tab. 3; we obtained R km implying that the seed photons for the Comptonization might come from the neutron star surface and/or the inner region of the accretion disk. According to White & Holt (1982) the ADC radius RADC can be obtained by R R⊙, where is the mass of the neutron star, and R⊙ are mass and radius of the Sun, and is the ADC temperature in units of K. Using as ADC temperature the electron temperature k obtained by the Comptonized component and we found R cm. More precise measures of the RADC made measuring the dip ingress time by Church & Balucinska-Church (2004) indicated the the RADC of X 1624–490 is between 5.8 and 7.2 cm, compatible with our result.
We observed an emission line between 6 and 7 keV. We fitted it using a Gaussian profile inferring a centroid of keV, a width of eV and an equivalent width of eV (see Tab. 3). This feature was already observed with an ASCA observation (see Tab. 5 in Asai et al.; 2000) and with an XMM observation by Parmar et al. (2002). Parmar et al. (2002) found that the energy, the width and the equivalent width of the emission line were keV, eV, and eV, respectively. Note that the parameters of the Gaussian emission line were compatible with those obtained from the XMM observation. Broad Fe lines have been detected using XMM from other neutron star systems that show highly-ionized absorption features such as MXB 1658-298 (FWHM keV, Sidoli et al. 2001), GX 13+1 (FWHM keV, Sidoli et al. 2002), and 4U 1323–62 (FWHM keV, Boirin et al. 2005), however this was the first source observed by Chandra to show both a broad Fe line and narrow absorption features. We immediately excluded that the broadening of the line could have a thermal origin since the needed temperature of the plasma should be larger than 10 MeV. The most probable origin of the observed emission line is either the accretion disk (in this case, the large width of the line would be due to Doppler and relativistic smearing effects) or the ADC (in this case, the large width of the line would be due to Compton broadening). We investigated the possibility that the line was produced by reflection in an accretion disk substituting the Gaussian component with the diskline model in XSPEC (see Tab. 5). Unfortunately the low statistics and the overwhelming continuum did not allow to well determine the model parameters, for this reason we fixed the source inclination angle to 65∘, typical value for a dipping source not showing eclipses. We found an emissivity slope of , and estimated that the required inner and outer radius of the disk were and gravitational radius Rg, for a neutron star mass of 1.4 corresponding to a inner and outer radius of the disk and cm, respectively. These values gave few information about the region of the disk in which the line was produced although the upper limit on the inner radius indicated that the line should be produced in the region of the disk covered by the ADC. Alternatively, the Compton scattering in the ADC could explain the large width of the broad Gaussian emission line. Detailed calculations give , where is the Thompson optical depth and kTe is in units of keV (Kallman & White 1989; see also Brandt & Matt 1994). Assuming an average electron temperature of kT keV, as derived from the fit of our data to the Comptonization model, we could explain the width of the iron line assuming a Thomson optical depth of . Therefore, it is possible that the line was produced in the outer region of the ADC, where the optical depth might be lower (if we assume that the ADC temperature profile remains constant). This result was not unreasonable since any contribution to the line produced inside the Comptonizing region, where the optical depth can be as high as 20 (see Tab. 3), would be completely smeared by Comptonization. Therefore, as expected, we only observed that part of the line that was produced in the outer Comptonizing region. Unfortunately, we could not discriminate between the two possible origins of the iron line and its broadening proposed above, it seems more appropriate to consider that both Compton scattering and the Doppler shift due to the Keplerian motion of the accretion disk worked simultaneously in the ADC to produce the broad Fe line.
We detected two narrow absorption lines associated to Ca xx Kα and Fe xxv Kα, and a prominent narrow absorption line associated to Fe xxvi Kα. The Fe xxvi line energy did not fit with the lab energies. We believe that this was not due to a physical effect but to a systematic error associated to the uncertainty of 0.6″222See http://cxc.harvard.edu/cal/ASPECT/celmon/ for more details. of the source position which also identifies the zero of the grating arms. Considering the systematic error associated to the absolute wavelength accuracy (i.e. and for HEG and MEG, respectively) the Fe xxvi line energy was fully consistent with the lab energy. The Fe xxv and Fe xxvi absorption lines were already observed by Parmar et al. (2002), in that case the corresponding upper limits of the line width were 50 and 56 eV, respectively, and the equivalent widths were and eV, respectively. We found that the Fe xxv and Fe xxvi line width were and eV and the corresponding equivalent widths were and eV (see Tab. 4). We note that the higher energy resolution of Chandra allowed us to better constrained the energy centroid of the Fe xxv and Fe xxvi absorption lines that were and keV, respectively. Parmar et al. (2002) obtained the Fe xxv and Fe xxvi energy centroid at and keV, respectively. We concluded that the Fe xxv and Fe xxvi energy centroids reported in this work were fully consistent with the corresponding rest-frame values, It was not true for the Fe xxvi energy centroid obtained from the XMM observation (see Parmar et al., 2002), indicating a possible blue-shift of this line although the Fe xxv absorption line did not show blue-shift.
Parmar et al. (2002) detected two weak absorption features at 7.83 and 8.28 keV associated to Ni xxvii Kα and Fe xxvi Kβ, respectively, nevertheless the authors also suggested that these features could have an instrumental origin since they were observed in a spectral region where the EPIC calibration was still relatively uncertain at the time of their analysis. We did not detect absorption features which could be associated to Fe xxvi Kβ or to Ni xxvii Kα but we could not exclude that this is due to the low effective area of the 1st-order HEG above 7 keV.
We estimated the Ca xx, Fe xxv and Fe xxvi column densities using the relation:
where is the column density for the relevant species, is the oscillator strength, is the equivalent width of the line, and is the wavelength in centimeters (Spitzer 1978, p. 52). Adopting , , and for Fe xxv, Fe xxvi, and Ca xx respectively (see Verner et al., 1996), and the best parameters reported in Tab. 4, we found N cm-2, N cm-2, and N cm-2. We noted that the Fe xxv and Fe xxvi column densities were similar to those estimated by Lee et al. (2002) for GRS 1915+105. Assuming an ionization continuum consisting of a power law with (Kallman & Bautista, 2001) and using the ratio between NFeXXVI and NFeXXV we inferred that log erg cm s-1. This value was similar than those recently obtained from the Chandra analysis of the dipping source XB 1916–053 (log; Iaria et al., 2006a; Juett & Chakrabarty, 2006) and XB 1254–690 (log; Iaria et al., 2006b). We also noted that the temperature associated to a photoionized plasma having a ionization parameter log() of 4.1 erg cm s-1 was K. Finally, we note the inferred value of the ionization parameter also explained the Ca xx absorption line observed in the spectrum and never observed before.
We investigated the nature of the absorption line widths. A plausible scenario, already adopted to describe the line widths of the absorption lines detected in the Chandra spectrum of the dipping sources XB 1916–053 (Iaria et al., 2006a) and XB 1254–690 (Iaria et al., 2006b), is that the lines were broadened by some bulk motion or supersonic turbulence with a velocity below 3500 km s-1 as indicated by the FWHMs of the lines (see Tab. 4). Assuming that the mechanism generating the turbulence or bulk motion was due to the presence of the extended corona we can infer some information about where the absorption lines were produced. Coronal models tend to have turbulent velocities which are locally proportional to the virial or rotational velocity (Woods et al., 1996). At cm, the ADC radius, the virial velocity should be 520 km/s, considering a neutron star of . This velocity was compatible with the values obtained from the FWHMs of the detected absorption lines and suggested that the absorption lines could be produced in a photoionized plasma highly ionized between the the external region of the ADC and the disk edge ( cm, see Church & Balucinska-Church, 2004).
5 Conclusion
We studied the persistent emission of X 1624–490 using a 65 ks Chandra exposure time using the 1st order MEG and HEG spectra in the 1.7–10 keV energy range.
We fitted the continuum adopting a Comptonizing component which we interpreted as emission from an extended corona above the accretion disk, although a blackbody plus power law was statistically equivalent. The unabsorbed luminosity in the 0.6–10 keV energy range was erg s-1. We observed the presence of a broad Fe emission line at 6.64 keV with a FWHM of 0.7 keV. We could not discriminate the mechanism producing the broadening of this line. Under the hypothesis that it was produced by Doppler and relativistic smearing effects in the accretion disk we deduced that the region of the disk where the line had origin was covered by the accretion disk corona, while under the hypothesis that the line broadening is producing by Compton scattering in the ADC we inferred that the line should be produced in the outer region of the corona. Nevertheless we could not exclude that the broadening of the emission line was due to a combination of both these effects.
In the spectrum we observed three narrow absorption features that we associated to Ca xx, Fe xxv, and Fe xxvi. We inferred that these absorption lines were produced in a photoionized plasma with ionization parameter log() of 4.1 erg cm s-1, resulting in a plasma temperature of K. We estimated that the absorption line widths could be compatible with a broadening caused by bulk motion or turbulence connected to the coronal activity, produced between the external ADC and the disk edge ( cm).
Acknowledgements.
This work was partially supported by the Italian Space Agency (ASI) and the Ministero della Istruzione, della Universitá e della Ricerca (MIUR).References
- (1) Angelini, L., Parmar, A. N., & White, N. E. 1996, Proc. IAU Colloquim 163, ASP Conf. series, 121, 685
- (2) Asai, K., Dotani, T., Nagase, F., & Mitsuda, K., 2000, ApJS, 131, 571
- (3) Balucinska-Church, M., Humphrey, P. J., Church, M. J., & Parmar, A. N., 2000, A&A, 360, 583
- (4) Balucinska-Church, M., Barnard, R., Church, M. J., & Smale, A. P., 2001, A&A, 378, 847
- (5) Boirin, L., Parmar, A. N., Barret, et al., 2004, A&A, 418, 1061
- (6) Boirin, L., Mendez, M., Diaz Trigo, M., et al., 2005, A&A, 436, 195
- (7) Brandt, W. M., & Matt, G. 1994, MNRAS, 268, 1051
- (8) Christian, D. J., & Swank, J. H. 1997, ApJS, 109, 177
- (9) Church, M. J. & Balucinska-Church, M., 1995, A&A 300, 441
- (10) Church, M. J. & Balucinska-Church, M., 2004, MNRAS, 348, 955
- (11) Davis, J. E. 2001, ApJ, 562, 575
- (12) Diaz Trigo, M., Parmar, A. N., Boirin , L., et al., 2005, A&A, 445, 179
- (13) Dickey, J. M., & Loekman, F., J., 1990, ARA&A, 28, 215
- (14) Fabian et al., 1989, MNRAS, 238, 729
- (15) Garmire, G. P., Bautz, M. W., Ford, et al., 2003, Proc. SPIE, 4851, 28
- (16) Iaria, R., Di Salvo, T., Lavagetto G., Robba, N. R., Burderi, L., 2006a, ApJ, 647, 1341
- (17) Iaria, R., Di Salvo, T., Lavagetto G., Robba, N. R., Burderi, L., 2006b, submitted to A&A
- (18) in’t Zand, J. J. M., et al. 1999, A&A, 345, 100
- (19) Jones, M.H., Watson, M.G., 1989, Proc. of 23rd ESLAB Symposium, Bologna
- (20) Juett, A. M., & Chakrabarty, D., 2006, ApJ, 646, 493
- (21) Kallman, T., & White, N. E. 1989, ApJ, 341, 955
- (22) Kallman, T., & Bautista, M., 2001, ApJS, 133, 221
- (23) Kotani, T., Ebisawa, K., Dotani, T., et al., 2000, ApJ, 539, 413
- (24) Lee, J. C., Reynolds, C. S., Remillard, R., et al., 2002, ApJ, 567, 1102
- (25) Miller, J. M., Raymond, J., Homan, J., et al., 2004, ArXiv Astrophysics e-prints, astro-ph/0406272
- (26) Parmar, A. N., Oosterbroek, T., Boirin, L., & Lumb, D., 2002, A&A, 386, 910
- (27) Sidoli, L., Oosterbroek, T., Parmar, A. N., Lumb, D., & Erd, C., 2001, A&A, 379, 540
- (28) Sidoli, L., Parmar, A. N., Oosterbroek, T., & Lumb, D., 2002, A&A, 385, 940
- (29) Smale, A. P., Church, M. J., & Balucinska-Church, M., 2001, ApJ, 550, 962
- (30) Stark, A.A., Gammie, C.F., Wilson, R.W., et al., 1992, ApJS 79, 77
- (31) Titarchuk, L., 1994, ApJ, 434, 570
- (32) Ueda, Y., Inoue, H., Tanaka, Y., et al., 1998, ApJ, 492, 782
- (33) Ueda, Y., Murakami, H., Yamaoka, K., et al., 2004, ApJ, 609, 325
- (34) Verner, D. A., Verner, E. M., Ferland, G. J., 1996, At. Data Nucl. Data Tables, 64, 1
- (35) Watson, M.G., Willingale, R., King, A.R., Grindlay, J.E., Halpern, J., 1985, IAU Circ. 4051
- (36) White, N. E., & Holt, S. S., 1982, ApJ, 257, 318
- (37) Woods, D. T., Klein, R. I., Castor, J. I., et al., 1996, ApJ, 461, 767
- (38) Yamaoka, K., Ueda, Y., Inoue, H., et al., 2001, PASJ, 53, 179