Draco, a flawless dwarf galaxy
Abstract
The Draco dwarf spheroidal galaxy (dSph), with its apparent immense mass to light ratio and compact size, holds many clues to the nature of the enigmatic dark matter. Here we present deep photometric studies of this dwarf galaxy, undertaken with the MegaCam Camera at the Canada-France-hawaii Telescope, the Wide Field Camera at the Isaac Newton Telescope and the Wide-Field and Planetary Camera on board the Hubble Space Telescope. The new photometric data cover the entirety of the galaxy, and reach at 50% completeness, significantly deeper than previous panoramic studies, allowing searches for tidal disturbances of much lower surface brightness than has been possible before. With these improved statistics, we find no evidence for asymmetric disturbances or tidal tails that possess more than 3% of the stars found within the centre of the galaxy. We find that the central stellar density, as probed by the HST data, rises into the central . Uncertainties in the position of the centroid of the galaxy do not allow us to determine whether the apparent flattening of the profile interior to is reliable or not. Draco is therefore a flawless dwarf galaxy, featureless and apparently unaffected by Galactic tides.
keywords:
galaxies: dwarf – galaxies: structure – cosmology: dark matter1 Introduction
11footnotetext: Based on observations obtained with MegaPrime/MegaCam, a joint project of CFHT and CEA/DAPNIA, at the Canada-France-Hawaii Telescope (CFHT) which is operated by the National Research Council (NRC) of Canada, the Institute National des Sciences de l’Univers of the Centre National de la Recherche Scientifique of France, and the University of Hawaii.Based on observations made with the NASA/ESA Hubble Space Telescope, obtained from the data archive at the Space Telescope Institute. STScI is operated by the association of Universities for Research in Astronomy, Inc. under the NASA contract NAS 5-26555.
The nature of the most common type of galaxy in the Local Group, the dwarf spheroidals, remains a mystery. Were these small galaxies formed early in the Universe, as predicted in the hierarchical galaxy formation model (White & Rees, 1978), and were many of them later incorporated into the Milky Way? Though the CDM model gives currently the best means to explain the formation of these galaxies, this scenario has the well-known problem of a discrepancy of 1–2 orders of magnitude between the number of low mass structures predicted by this theory and the observed number of satellite galaxies (Moore et al., 1999; Klypin et al., 1999). Their apparent alignments in great circles (Lynden-Bell, 1976) have led some authors to propose a tidal (non-cosmological) origin (Kroupa, 1997), possibly by the early interaction between Andromeda and the Milky Way (Sawa & Fujimoto, 2004).
Thus the study of dwarf spheroidal galaxies is of importance in our attempt to understand the formation of galaxies in general and also the distribution of the dark matter. These small galaxies are most easily examined in the Local Group due to their proximity, and of the dwarf spheroidal galaxies in this region Draco is arguably the most interesting in terms of its importance in placing constraints on the distribution of dark matter on small scales.
The Draco dSph is a small, faint, and metal-poor Galactic satellite situated about from the Sun (see Table 1). The stellar population is very old ( 8-10 Gyr) and very metal poor ( dex) (Apparicio et al., 2001). Its total i-band luminosity is (Odenkirchen et al., 2001), and King model (King, 1962) fits to the stellar profile, show that it has a core radius of 7.7′, and a tidal radius of 40.1′. Under the assumption of Virial equilibrium, the high stellar velocity dispersion implies an extremely high mass to light ratio of about in Solar units, according to Odenkirchen et al. (2001) (hereafter O01) or according to Kleyna et al. (2002) (hereafter K02). Several other studies (e.g., Klessen et al. 2003; Lokas 2002), also conclude that it is probably a very strongly dark-matter dominated galaxy.
In many of its properties Draco is very similar to the Ursa Minor dSph, another low-mass Milky Way satellite. Surveys of the latter galaxy, however, have shown the presence of tidally-induced features which attest to the non-equilibrium state of that galaxy (Olszewski & Aaronson, 1985; Bellazzini et al., 2002; Palma et al., 2003), and imply that the dark matter fraction may well be much lower in Ursa Minor than might be naively expected. In contrast, previous studies of Draco have shown it to have a smooth symmetrical shape (O01; Piatek et al. 2001; Bellazzini et al. 2002). Indeed, no study has yet found evidence for a distorted distribution of stars in the halo of the Draco dSph, which would be expected if it did not possess a massive dark matter mini-halo to protect the stellar component from the strong tidal field of the Milky Way. Recently however, Wilkinson et al. (2004) (hereafter W04) discovered a break in the light profile of Draco at and a sharp decline in the velocity dispersion at . They concluded that the outer part of Draco is filled with a dynamically colder stellar population, which could be caused by an external tidal field.
Our aim in this work is therefore to search more thoroughly for tidal perturbations in the halo of the Draco dSph, using the new generation of wide-field cameras. The outline of the paper is as follows: §2 describes the observations and the data reduction processes, §3 details the selection criteria for Draco stars, while §4 discusses the analysis of the photometric survey, the different star populations that are present, and the search for substructures in the outskirts of this small galaxy. Finally, §5 and §6 are dedicated to the discussion of our results and the conclusions of the study.
2 Observations and data reduction
2.1 MegaCam and INT surveys
The Draco dSph galaxy was observed with the wide-field MegaCam camera at the Canada-France-Hawaii Telescope (CFHT) in service mode during the 2004A and 2005A observing seasons. Megacam is a mosaic of 36 EEV chips, offering a field of square degrees. We chose to observe seven fields, six around the galaxy and a comparison field four degrees in declination below the centre of the galaxy. Taken in photometric conditions, the images totalled 950 s, 1090 s and 1700 s per field in, respectively, the MegaCam g, r and i bands. The seeing ranged from to , with the majority of the images being taken in seeing better than .
The images were pre-processed by the CFHT ”Elixir” pipeline yielding debiassed, flat-fielded images, with i-band fringing artefacts removed. Photometric standards observed over the season are used by ”Elixir” to measure the zero-point in each passband for every pointing. The resulting images were subsequently passed through the photometry pipeline developed for the Wide Field Camera (WFC) of the Isaac Newton Telescope (INT) (Irwin & Lewis, 2001), suitably altered to deal with MegaCam data.
Catalogue generation follows the precepts outlined by Irwin (1985, 1996) and includes the facility to: automatically track any background variations on scales of typically 20-30 arcsec; detect and deblend images or groups of images; and parameterise the detected images to give various (soft-edged) aperture fluxes, position and shape measures. The generated catalogues start with an approximate World Coordinate System (WCS) defined by the known telescope and camera properties (the WCS distortion model) and are then progressively refined using the 2MASS (2 Micron All Sky Survey) astrometric catalogues to give an internal precision generally better than 0.1 arcsec and a global external precision of 0.25 arcsec. These latter numbers are solely dependent on the accuracy of the astrometric catalogues used in the refinement.
All catalogues for all CCDs for each pointing are then processed using the image shape parameters for morphological classification in the main categories: stellar, non-stellar, and noise-like. A sampled curve-of-growth for each detected object is derived from a series of aperture flux measures as a function of radius. The classification is then based on comparing the curve-of-growth of the flux for each detected object with the well-defined curve-of-growth for the general stellar locus. This latter is a direct measure of the integral of the point spread function (PSF) out to various radii and is independent of magnitude, if the data are properly linearised, and if saturated images are excluded. The average stellar locus on each detector is clearly defined and is used as the basis for a null hypothesis stellar test for use in classification. The curve-of-growth for stellar images is also used to automatically estimate frame-based aperture corrections for conversion to total flux.
Various quality control plots are generated by the pipeline and these were used to monitor characteristics such as the seeing, the average stellar image ellipticity (to measure trailing), the sky brightness and sky noise, the size of aperture correction for use with the “optimal” aperture flux estimates (here ”optimal” refers to the well-known property that soft-edged apertures of roughly the average seeing radius provide close to profile fit accuracy, e.g., Naylor 1998). The ”optimal” catalogue fluxes for the g, r, i filters for each field were then combined to produce a single matched catalogue for each pointing and the overlaps between pointings were used to cross-calibrate all the catalogues to a common system to within an accuracy % across the survey region.
For completeness we also present here an earlier panoramic dataset obtained with the INT WFC on the nights of the 11th, and the 13th to 15th of October 2002. The WFC is a mosaic of four EEV chips, offering a field of square degrees. A total of 11 pointings were observed in photometric conditions, with exposures of 1800 sec in the equivalent of the Johnson V passband and 1800 sec in the equivalent of the Gunn i band at each pointing. The seeing ranged from to . The INT WFC images were reduced in an identical manner to the MegaCam observations, with the exception that the pre-processing was performed with the INT pipeline. A small offset of magnitudes was applied to the i-band INT magnitudes to bring them into agreement with the MegaCam values.
Tables 2 and 3 list the photometry resulting from the MegaCam and INT surveys, showing g, r, i-band MegaCam magnitudes (in the AB system), V and i-band INT magnitudes (converted into the MegaCam AB system), with their uncertainties, a classification parameter in each passband (, , and ), and the equatorial coordinates for each object. This classification index is a flag that indicates the likely nature of the objects. A classification index of 1 corresponds to a likely galaxy, to a point-sources (in order of decreasing confidence of stellarity), and 0 to an artefact or noise. The INT photometry is only used to calibrate the HST V-band photometry.
| 17 16 45.50 | 53 24 41.1 | 0.000 | 0.000 | 0 | 0.000 | 0.000 | 0 | 23.406 | 0.057 | 1 |
| 17 16 44.52 | 53 24 41.1 | 24.204 | 0.051 | 1 | 23.708 | 0.054 | 1 | 0.000 | 0.000 | 0 |
| 17 17 3.98 | 53 24 41.4 | 24.394 | 0.060 | 0 | 22.796 | 0.025 | 0 | 21.893 | 0.016 | 0 |
| 17 17 1.92 | 53 24 41.7 | 19.279 | 0.002 | 1 | 18.065 | 0.001 | -1 | 17.304 | 0.001 | -1 |
| 17 17 17.34 | 53 24 42.4 | 24.223 | 0.052 | 1 | 23.060 | 0.031 | -8 | 22.391 | 0.024 | -8 |
| 17 18 10.29 | 53 24 42.4 | 0.000 | 0.000 | 0 | 0.000 | 0.000 | 0 | 22.387 | 0.024 | 1 |
| 17 18 10.58 | 53 24 42.4 | 0.000 | 0.000 | 0 | 0.000 | 0.000 | 0 | 22.310 | 0.023 | 0 |
| 17 17 33.88 | 53 24 42.5 | 0.000 | 0.000 | 0 | 0.000 | 0.000 | 0 | 34.916 | 8.326 | 0 |
| 17 18 13.85 | 53 24 42.5 | 0.000 | 0.000 | 0 | 0.000 | 0.000 | 0 | 22.317 | 0.023 | 0 |
| 17 18 14.27 | 53 24 42.5 | 0.000 | 0.000 | 0 | 0.000 | 0.000 | 0 | 22.334 | 0.023 | 1 |
| 17 20 17.72 | 57 4 45.4 | 22.572 | 0.034 | 1 | 21.026 | 0.020 | 1 |
| 17 20 16.05 | 57 4 47.0 | 23.862 | 0.105 | 0 | 0.000 | 0.000 | 0 |
| 17 19 53.57 | 57 4 47.4 | 0.000 | 0.000 | 0 | 23.099 | 0.121 | 0 |
| 17 20 18.82 | 57 4 47.6 | 0.000 | 0.000 | 0 | 22.936 | 0.105 | -3 |
| 17 19 55.91 | 57 4 48.0 | 0.000 | 0.000 | 0 | 22.627 | 0.080 | 1 |
| 17 20 5.51 | 57 4 48.6 | 23.617 | 0.085 | 0 | 0.000 | 0.000 | 0 |
| 17 19 47.26 | 57 4 48.7 | 21.466 | 0.013 | -3 | 19.815 | 0.007 | -3 |
| 17 19 26.95 | 57 4 48.8 | 23.799 | 0.100 | -2 | 0.000 | 0.000 | 0 |
| 17 19 19.21 | 57 4 49.5 | 0.000 | 0.000 | 0 | 23.262 | 0.140 | 1 |
| 17 19 11.11 | 57 4 50.0 | 22.231 | 0.025 | -3 | 21.859 | 0.041 | -3 |
2.2 HST survey
We also analysed a series of HST images of a field in the centre of the Draco dSph. The data were taken in 1995 and 1999 with the Wide Field and Planetary Camera (WFPC2), in two spectral bands, V (F606W) and i (F814W). The total exposure time amounts to 4000 sec in F606W and 4500 sec in F814W. The wide-field (WF) chips of the mosaic were reduced with the DAOPHOT/ALLSTAR package (Stetson, 1987; Stetson et al., 1990). A point spread function (PSF) previously constructed for a study of the globular cluster M4 (Ibata et al., 1999) in each of the WF chips was used to fit the profiles of all detected sources in the WF mosaic. This yielded, for each detected object, the coordinates, the magnitude, a parameter describing the profile shape (sharpness) and the value of the PSF fit. The equatorial coordinates of the sources were determined by comparison to the MegaCam survey. The instrumental WFPC2 F606W and F814W magnitudes were calibrated onto the INT V-band and MegaCam i-band systems, respectively, by assuming a simple offset with no colour terms. The correspondence between the bands is reasonably acceptable, as we show in Fig. 1.

The images listed in Table 5 do not cover exactly the same area of sky, and have offsets of up to pixels. Since we were primarily interested in measuring the stellar density profile in the inner regions of the Draco dSph, we retained only the overlapping region in common to all 14 exposures, thereby ensuring that the region was surveyed to a uniform depth.
3 Sample selection
3.1 Completeness
The deep HST photometry in the centre of the galaxy is useful to help define the stellarity criteria and also to determine the completeness of the MegaCam survey. We find that adopting MegaCam sources with classification indices of either -1 or -2 in all three passbands results in zero false objects (i.e. zero sources not present in the HST survey). The completness for this selection is represented with a dashed line in Fig. 2. We also show, with a solid line, the completness when we select all the MegaCam objects (classification index from 1 to -9). To both selections have completeness %. Down to this limit, the adopted selection on classification indices does not make us lose a substantial fraction of stars. It should be noted that the incompleteness is affected to a significant extent by the crowding, which is maximal in the central region probed by the HST field, but will be much less problematic in the outskirts of the galaxy. Fig. 2 therefore represents the worst completeness over the survey.

| name | passband | exposed time | date |
|---|---|---|---|
| (s) | |||
| u2oc0101t | F606W | 200 | 1995 |
| u2oc0102t | F606W | 1100 | 1995 |
| u2oc0103t | F606W | 1000 | 1995 |
| u2oc0104t | F814W | 200 | 1995 |
| u2oc0105t | F814W | 1100 | 1995 |
| u2oc0106t | F814W | 1100 | 1995 |
| u5er1401r | F606W | 400 | 1999 |
| u5er1402r | F606W | 400 | 1999 |
| u5er1403r | F606W | 500 | 1999 |
| u5er1404r | F606W | 500 | 1999 |
| u5er1405r | F814W | 400 | 1999 |
| u5er1406r | F814W | 500 | 1999 |
| u5er1407r | F814W | 500 | 1999 |
| u5er1408r | F814W | 500 | 1999 |
| (J2000) | (J2000) | ||||||||
|---|---|---|---|---|---|---|---|---|---|
| 17 20 3.41 | 57 53 31.3 | 26.538 | 0.146 | 0.850 | 0.048 | 26.158 | 0.185 | 0.670 | 0.040 |
| 17 20 3.28 | 57 53 32.8 | 24.845 | 0.031 | 1.060 | 0.010 | 24.616 | 0.049 | 1.270 | 0.162 |
| 17 20 3.31 | 57 53 33.4 | 24.048 | 0.017 | 1.920 | -0.141 | 23.615 | 0.022 | 3.450 | 0.041 |
| 17 20 3.14 | 57 53 33.5 | 23.702 | 0.014 | 0.560 | 0.081 | 23.602 | 0.023 | 1.060 | 0.109 |
| 17 20 3.51 | 57 53 34.8 | 25.259 | 0.045 | 0.510 | 0.118 | 24.986 | 0.067 | 0.800 | 0.080 |
| 17 20 3.02 | 57 53 34.9 | 25.801 | 0.064 | 0.660 | 0.081 | 25.464 | 0.089 | 0.630 | 0.079 |
| 17 20 3.71 | 57 53 34.9 | 25.907 | 0.068 | 0.650 | 0.053 | 26.065 | 0.143 | 0.650 | -0.014 |
| 17 20 2.71 | 57 53 36.2 | 27.108 | 0.206 | 0.590 | -0.048 | 26.180 | 0.165 | 0.930 | 0.056 |
| 17 20 3.98 | 57 53 36.7 | 25.604 | 0.062 | 1.330 | 0.099 | 25.304 | 0.075 | 1.600 | 0.177 |
| 17 20 2.82 | 57 53 36.9 | 24.948 | 0.031 | 0.760 | 0.062 | 24.806 | 0.050 | 0.950 | 0.136 |
3.2 Star selection
Fig. 3 shows the colour magnitude diagram (CMD) of the MegaCam stars in the central region of Draco within a radius of 6. To reduce the contamination by foreground stars and background galaxies, we construct a selection region covering the red giant branch (RGB) to sub-giant branch (SGB) on the central CMD. As the red giant branch has very low contrast compared to the ”background” in some fields (or may simply not be present), this CMD selection will help reduce contaminants in the analysis below. A fairly broad selection is chosen here to ensure that we do not reject a significant fraction of members of the dwarf galaxy.


Clearly a simple CMD filter is not an optimal way to select Draco-like stars, particularly towards fainter magnitudes, where the discrimination between stars of the dwarf galaxy and background galaxies is difficult. We therefore try to implement a CMD filter that will enhance the signal of the dwarf galaxy by filtering out those CMD regions that degrade the total signal to noise. To this end we take the background field (Fig. 4) as representative of the contamination by foreground and background Galactic stars as well as point-like distant galaxies that have managed to evade the stellarity criterion. In general, the signal to noise ratio in a given CMD bin will be simply
where is the number of stars in the CMD bin in the region under consideration, is the number of stars in the comparison field, and is the ratio of the geometrical areas of the two fields. Assuming Poisson noise, this simplifies further to
Let us consider first the region inside (displayed in Fig. 3), taking the stars within the selection polygon. We bin the CMD in intervals of mag in g-i colour and mag in g-band magnitude. For each bin, we calculate the signal-to-noise ratio, and we sort the resulting array. Starting with the CMD bin of highest signal to noise, we examine each new bin in decreasing order of S/N testing whether the additional bin adds to the total S/N, in which case the bin is accepted. It transpires that upon applying this process we accept the whole region within the polygon of Fig. 3, i.e. in the region within of the galaxy centre, all of the CMD bins contribute usefully to the total S/N.
However, this will not the case on the outskirts of the galaxy, where . In the outer regions the signal from the dwarf galaxy is of course extremely weak, so one cannot apply the same procedure as above. We use instead the CMD within as a model. Now the signal to noise ratio becomes:
where is the number of Draco stars in the central () region and is an unknown normalisation factor combining the ratio of geometrical areas between the area of interest and the central region and the relative frequency of stars from the dwarf galaxy in the outer region compared to the central region. Since in this background-dominated case, we find that , with a constant of proportionality whose value we need not know. We proceed as above, binning the CMD, calculating the signal-to-noise ratio in each bin (to within the multiplicative constant), and sorting the resulting array. We find that in the outskirts of the galaxy at radii beyond an optimal CMD selection includes the main-sequence turnoff and parts of the horizontal branch and blue-straggler regions.
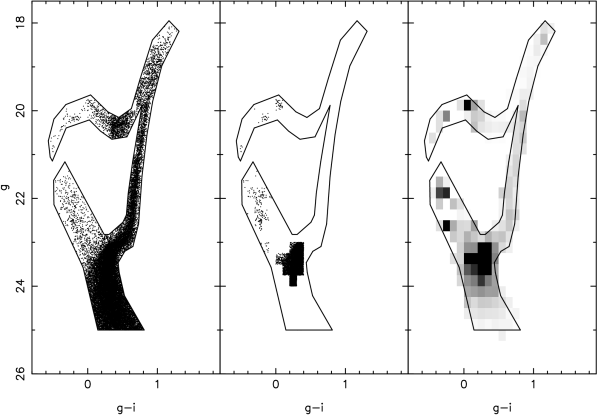
The left and middle panels of Fig 5 show the result of these two selection methods, where we present the full dataset of point-sources, filtered by the two CMD filters. These two CMD filters allow us to construct a star selection appropriate for the centre of the dwarf galaxy (S1, on the left-hand panel), and the other (S2, in the middle panel) that enhances the signal to noise in the external parts of the galaxy, where the background is high. We retain 25670 stars for the S1 selection and 5385 stars for S2. Fig. 6 shows the spatial distribution of the two selections.
The matched-filter technique (see e.g., Rockosi et al. 2002) provides an alternative means to enhance the signal of an expected CMD structure in the presence of contamination. We apply this procedure also to our survey, taking the stars within the polygon of Fig. 3 to be representative of the desired signal, with a background sampled by the comparison field shown in Fig. 4. The matched-filter method assigns a relative weight to each star, according to its CMD location (the map of the matched-filter weights is displayed in the right-hand panel of Fig. 5). In this way it is more efficient than the methods used above to select the samples ”S1” and ”S2” since one can make use of the entire dataset. However, the drawback is that one must bin all quantities of interest, which is not always convenient. We therefore use all three methods, applying each where appropriate.
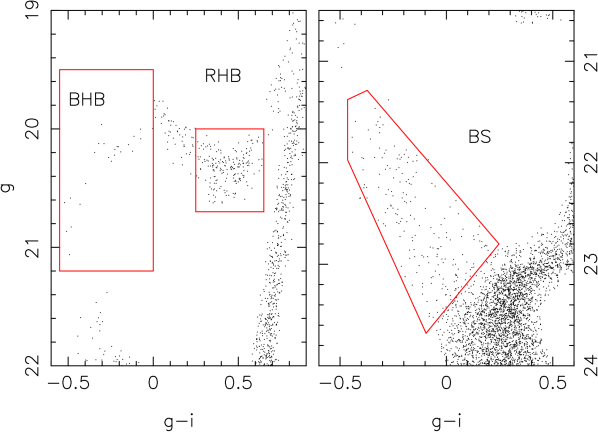
Fig. 7 shows the selection boxes used to investigate the spatial distribution of stars at other evolutionary phases which are clearly present from visual inspection of the CMD: the blue and red horizontal branch (hereafter BHB and RHB respectively), and the blue stragglers (hereafter BS). These boxes are defined from the (g-i,g) CMD. The spatial distribution of these selections are shown on Fig. 8, where we display maps for the BHB, RHB and BS populations, which contain 605, 2542 and 973 stars, respectively.


4 Analysis
4.1 Stellar density profile
We next construct the stellar density profiles for the two selections. However, there are two practical problems that need to be solved. First, the survey is riddled with holes caused by CCD artefacts around bright stars, so these unusable areas of the fields need to be masked out. We eliminated circular regions around the positions of bright USNO and Hipparcos stars which have magnitudes , choosing appropriate magnitude-dependent radii to cover the holes in the MegaCam survey. The second problem is the gaps between CCDs. The chipsets of the MegaCam camera are distributed on four rows, with two large gaps. These gaps (which are clearly visible in Fig. 6) are sufficiently large to influence measurements of the stellar density profile.
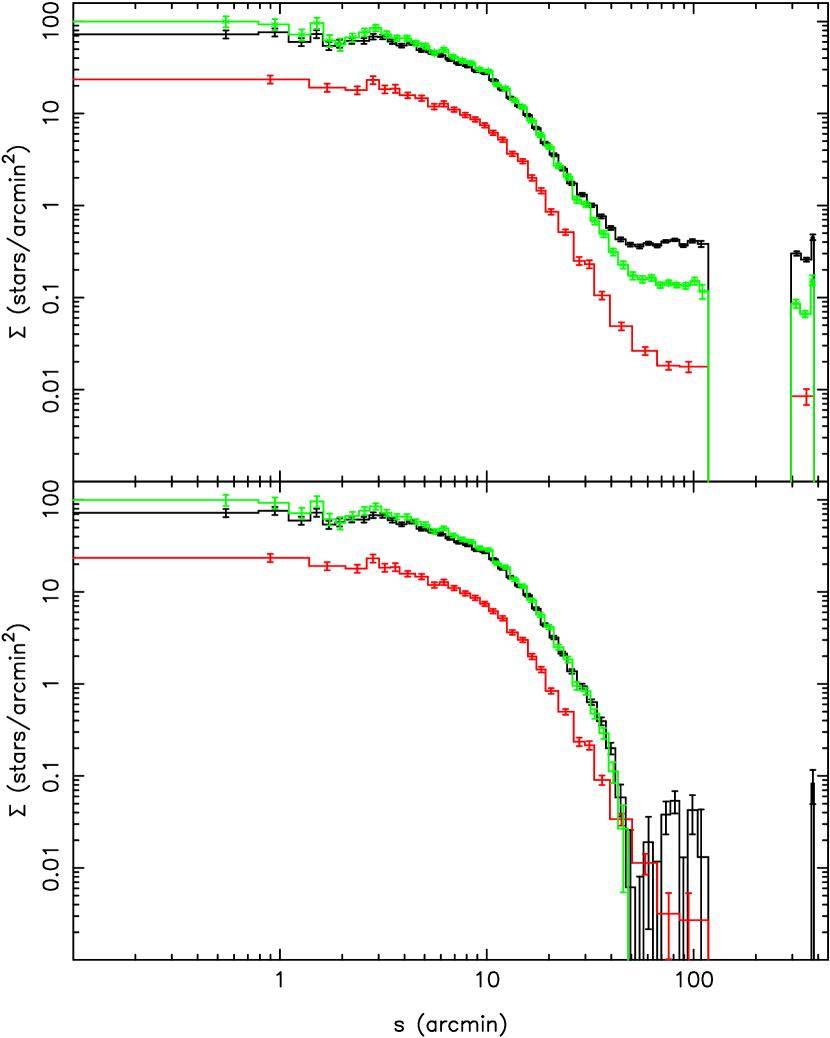
To trace the stellar density profiles, we construct a succession of ellipses with different major axis values (throughout this work, we use to denote an elliptical radius, and to denote a circular radius). We choose the best shape parameters found by O01, a ellipticity equal to and a position angle of the major axis of . For each optimised selection, we construct the surface brightness profile, taking into account the holes made by the bright stars and the gaps between CCDs, and remove a background level. The background count level is determined from the comparison field. In Fig. 9 we show the resulting profiles before background subtraction (upper panel) and after background subtraction (lower panel).
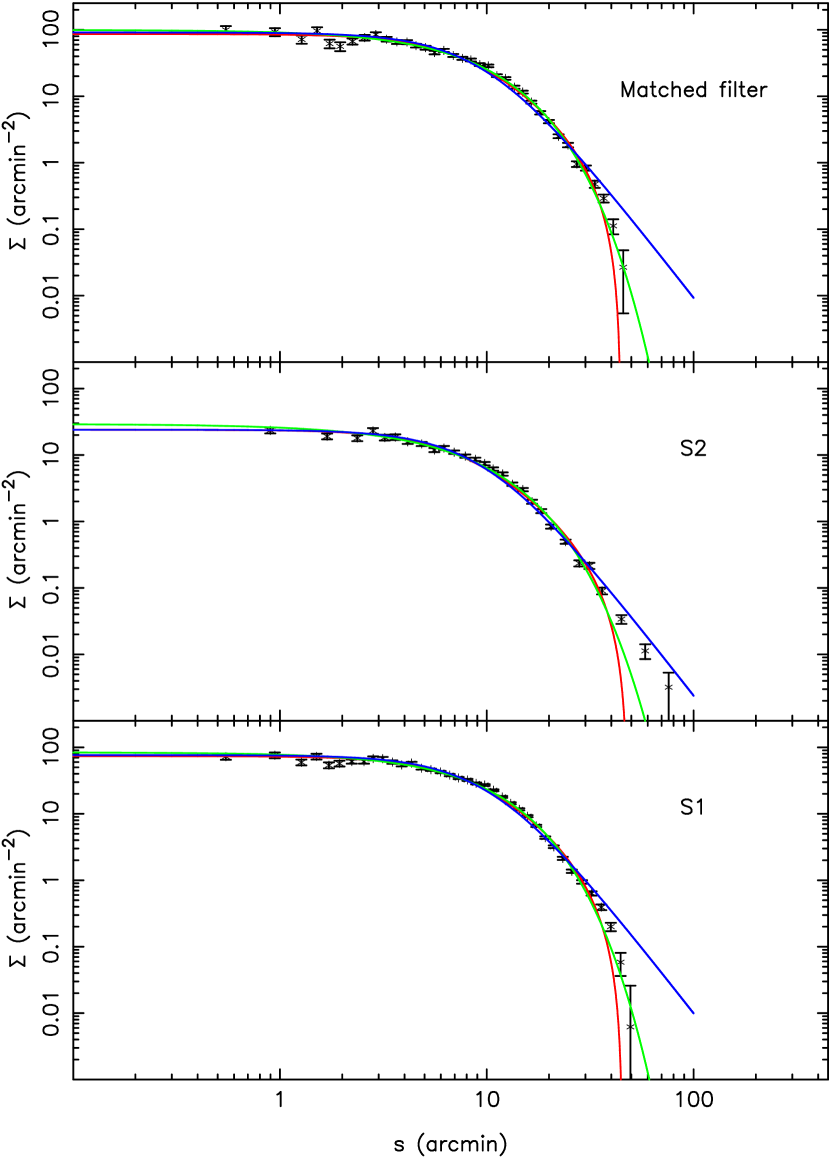
We next fit structural models to the S1 and S2 profiles and compare our results with O01 and Wilkinson et al. 2002 (hereafter W02). We use three different models, the King model (King, 1962):
the exponential model (Sersic, 1968):
and the Plummer model:
The fitting is performed by minimisation, with the ellipticity and the position angle of the major axis taken as constant. The results are summarised in table 6, and the corresponding profiles are displayed in Fig. 10.
| King | data | r | r | |
| S1 | 5.35 | |||
| S2 | 4.61 | |||
| MF | 3.31 | |||
| O01 | ||||
| Exponential | data | r | n | |
| S1 | 3.97 | |||
| S2 | 3.42 | |||
| MF | 2.27 | |||
| O01 | ||||
| Plummer | data | r | ||
| S1 | 9.55 | |||
| S2 | 5.03 | |||
| MF | 8.01 | |||
| W02 |
The extensive spatial coverage of our survey provides us with information far from the core of Draco, up to 100′. In contrast to W04, who found a break at in the light profile with the INT dataset, the profiles on Fig. 9 based on either the S2 selection or from the matched-filter analysis do not show evidence for a break. We suspect that the presence of the break in the W04 study could have been an artefact of background subtraction, which is very difficult at these low count levels.
The fits of Fig. 10 give a visual impression that the data can be represented quite well by these simple models. However, the reduced values listed in Table 6, are very poor, and even the best of the models (the exponential model fit to the Matched-Filter sample) can be rejected with better than 99.99% confidence. Thus the data are now of such excellent quality that these simple models no longer provide satisfactory fits. We suspect that dynamically self-consistent triaxial models will be required to reproduce the structure of this dwarf galaxy, however that is beyond the scope of the present article.
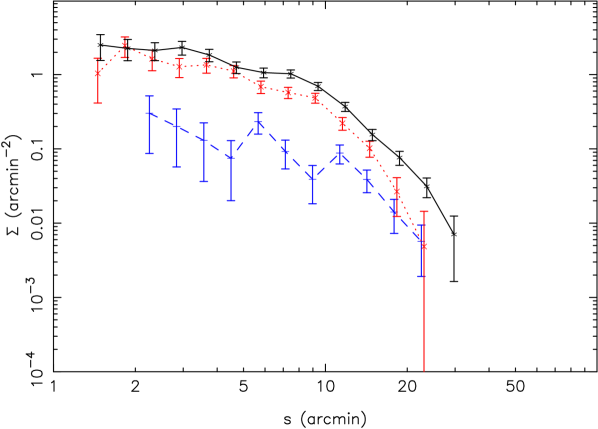
We also trace the stellar density profile for the BHB, RHB and BS selections. Fig. 11 shows the three resulting profiles. A fit with a Plummer model yields scale radii of , and respectively for the BHB, RHB and BS selections. We find that widening the BHB box by allowing redder horizontal-branch stars into the selection results in a profile that is closer to that of the RHB. Thus the paucity of BHB stars does not allow us to confirm the visual impression from Fig. 8 that the BHB stars are more dispersed than the RHB and BS stars. Consequently, Draco, unlike the Sculptor (Tolstoy et al., 2004) and Fornax (Battaglia et al., 2006) dSph, does not possess a BHB population that is significantly more extended than the RHB population. Whether this attests to a difference in early star-formation or simply to the low statistics of BHB stars is currently not clear.
4.2 Smoothness of the stellar density profile
The stellar profiles displayed in Fig. 10 appear approximately smooth, but are they really featureless apart from their monotonic decrease? To investigate this point we implement a variant of a test devised by Kuhn, Kocevski & Fleck (2004) (hereafter KKF), who in a preliminary study of the stellar profile of the Draco dSph, found the very interesting result that the inner regions within are not as smooth as one would expect from Poisson noise statistics. Following KKF, we divide our Matched-Filter sample into 1000 radial bins, using the same elliptical coordinate as in Fig. 10. Each bin contains 24 stars to maintain uniform statistical significance. However, since our survey suffers from gaps between CCDs and holes due to the haloes of bright stars, we calculate the density in each bin , and also the density uncertainty , taking into account the Poisson noise in each bin, and the Poisson noise in the background subtraction.
In a similar way to KKF, we take groups of 5 bins at radius , and calculate the reduced of the group, testing the null-hypothesis that the density is constant over the small radial interval. To this end, we define:
where is the weighted mean density in the group of 5 bins. Large values of would indicate large deviations from Poisson noise, and if many such bins were found, it would imply significant small spatial-scale variations in the density. However, contrary to KKF, we find that in the region within the observed distribution of does not differ significantly from the expected distribution; indeed a Kolmogorov-Smirnoff test indicates that the probability that the observed distribution is drawn from the expected distribution is 2%. The hypothesis that the stellar profile of Draco is smooth on small-scales therefore cannot be confidently rejected. Since any defects in the survey that were not accounted for in our processing will have the effect of driving down this probability, one should interpret this test as evidence that the stellar profile is smooth.
4.3 The central profile of Draco
We include the HST survey in this discussion of the spatial properties of the Draco dSph, as the resulting deep photometry complements the wide-field MegaCam data, giving much better statistics in the centre of the galaxy. The CMD derived from the point-sources in the much deeper WFPC2 data is shown in Fig. 12. (We define point sources to be those objects in Table 5 that have and sharpness between and in both the V and i-bands). The main sequence turnoff and part of the RGB and HB are clearly visible. In this central region of the dwarf galaxy, the number of contaminants to the point-source catalogue is very small, but we choose to implement a simple CMD selection box (as shown in Fig. 12) around the stellar populations of Draco to avoid the obvious contamination. The selection inside the polygon contains a total of 1122 stars.
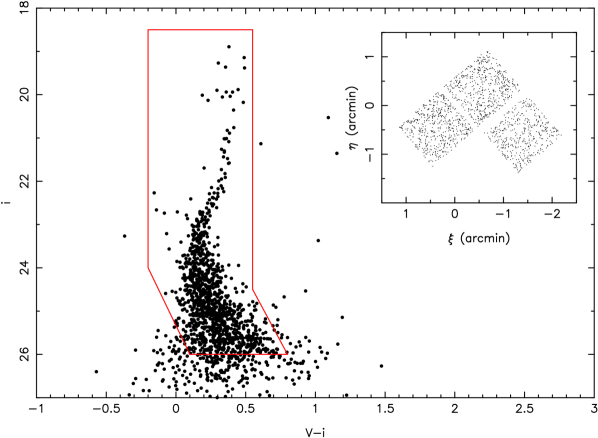
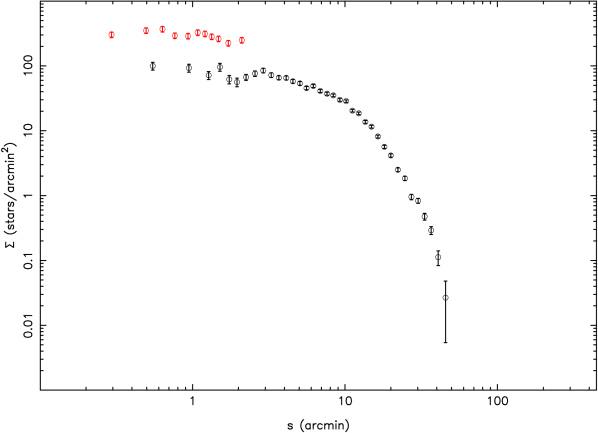
We now trace the surface density profile of this selection of HST stars. We divide the sample into 11 bins each containing 102 stars, and as with the MegaCam dataset, we compute the stellar density taking into account the gaps between the CCDs. Fig. 13 compares the stellar density profiles of Draco obtained with the HST data to the MegaCam matched-filter selection. In Fig. 14 we show more clearly the region probed by the HST data; the higher source density results simply from the greater photometric depth. The mean star-count level in the HST survey is , however the probability that these density are constant with radius is 0.8%. Thus the profile derived from the HST starcounts requires that the stellar density in the inner regions of the galaxy continue to increase towards the centre.

In cosmological simulations, dark matter halos follow a ”universal” profile, like the NFW (Navarro et al., 1997) or Moore (Moore et al., 1999) models. Though these models work well on large scales such as those of galaxy clusters, the question about the form of the inner regions of low-mass dark matter halos is not resolved: are their centres cuspy or cored (de Blok et al., 2001)? Though the distribution of the luminous matter need not follow that of the underlying dark halo, it is nevertheless interesting to compare the observed distribution of stars to the expected dark matter models.
In Fig. 14 we compare the observed central stellar number density profile to a cusped profile model, that we choose to parametrise with a projected NFW model of mass (Lokas & Mamon, 2001). We adopt a normalisation to minimise , so that the only free parameter is the concentration of the NFW model. The mean concentration of a halo of this mass is (Macciò et al., 2006); this model is shown with a dashed line, and has a probability of only 0.1% of conforming to the data. However, there is a wide range in the concentration of cosmological halos, with a typical scatter of 0.4 in (Macciò et al., 2006). The dotted line shows a fit for , an extreme () value for halos of mass . The probability that the observed profile can be drawn from such a model is 8%.
The marginal discrepancy between the NFW models and the data stems solely from the innermost point of the survey. We have checked this datum carefully, and could find no artificial reason why it should be substantially lower than the trend. This may reveal a real departure due to a change in the mass to light ratio of the central regions, though it may also simply point to the possibility that the centre of the dwarf galaxy is not precisely at the location measured by O01. Their centroid resulted from a fit to the data over the entire galaxy, so it is reasonable that there could be an offset in the very central . Indeed, this is perfectly consistent with the quoted uncertainty of in the O01 centroid position. The MegaCam survey, due to the large gaps between CCDs, is not well suited to improve on the O01 centroid measurement, and neither is the HST survey presented here due to its very limited spatial coverage. If we omit the innermost datum, the probability that the HST profile is drawn from a or a model is 48% and 14%, respectively.
Nevertheless, it is interesting in this context that the simple exponential model that we fit earlier to the Matched-Filter sample provides a good representation to the data, including the innermost datum. This is shown with the full line in Fig. 14, where we have simply scaled the previous fit to best match the observed profile. The probability that the data are drawn from this exponential model is 26%, while rejecting the innermost point yields a probability of 28%.
4.4 Search for tidal features
One of the particularities of the Draco dSph based on previous studies of this system is its undisturbed appearance. To try to place better constraints on the absence of tidally-induced features we count the number of stars at radii between probing beyond the King model tidal radius to the end of the survey. Each annulus is divided into 36 equal parts, and we count the number of stars in each annulus segment. In Fig. 15 we show the background-subtracted star-counts and their uncertainties in each annulus segment for the S2 selection. None of these -wide bins exceeds , so we conclude that no significant overdensities are detected.
To test the sensitivity of this method, we make fake tidal tails by redistributing a fraction of the stars from the central region of the galaxy along the direction of the major axis of the galaxy. For every randomly drawn star from within a radius of the galaxy centre, we randomly reassign the coordinate along the major axis of the galaxy so as to have a constant density stream over the length of the surveyed region. With a tidal tail representing 3% of the selection of the central stars, we are able to detect the tail at (summing two bins around ) and (from summing two bins around ). This result indicates that a tidal tail consisting of only 3% of the central body of Draco is detectable by this method.

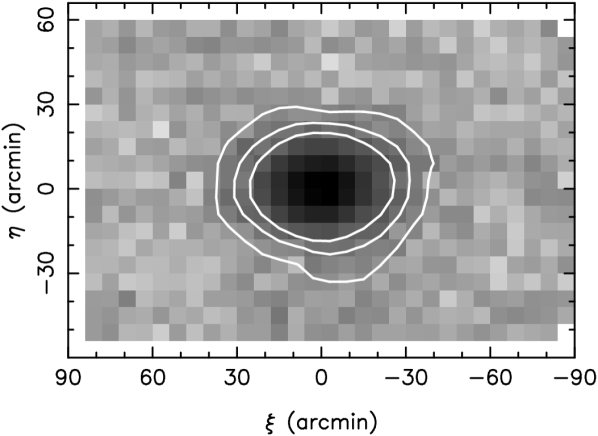
The absence of any other deformities in the outskirts of the galaxy is further corroborated by the stellar density map in Fig. 16, which has been constructed from the matched-filter sample. The uncertainty contours at the 1, 3 and levels are also shown. These data clearly show that Draco is a very regular and symmetric system.
5 Discussion
5.1 The inner density profile
The HST survey presented above shows clearly that the inner stellar density profile increases inwards until at least . Inside that radius, the profile may flatten or decline, or we may simply have adopted a slightly incorrect centroid. The current data are not good enough to discriminate between these possibilities. CDM simulations show dark matter profiles with a power-law slope between -1 and -1.5, as shown by numerous recent studies (Colìn et al., 2004; Ghigna et al., 2000; Hayashi et al., 2003). However, low surface brightness galaxies appear to have flat central mass profiles (de Blok et al., 2001), in stark contradiction to the theoretical predictions. These authors also show that the profiles are better fit with a model with a power-law index of .
A flat central density profile has also been deduced for the Ursa Minor dSph, from an analysis of the survivability of a morphological substructure (Kleyna et al., 2003). They found that the stars of this substructure are dynamically colder than the stellar population of the dwarf galaxy, concluding that the substructure was a stellar cluster accreted by Ursa Minor, and whose stars now orbit unbound inside the halo of the dwarf galaxy. They demonstrated that this type of scenario is only possible if the dark matter profile around Ursa Minor has a flat core, as otherwise the stars rapidly lose their coherence.
Some numerical simulations (Ricotti & Wilkinson, 2004) can produce dark matter halos with flat cores in agreement with those observations. In their cosmological simulations, Ricotti & Wilkinson (2004) created this type of halo at , by taking into account the effect of radiative pressure. They are able to produce galactic systems similar to the Local Group. To make this, they selected at galaxies with cored dark matter halos. Then they evolved without any peroid of fusion. The main result is the core of each dwarf galaxy remains flat and stable until . The modelled velocity dispersion profile was found to have the same shape as those found observationally by Kleyna et al. (2002). Another method to obtain dark matter halos with flat core was proposed by Read & Gilmore (2005). They discovered it is possible to flatten the core of a potential by two short periods of mass-loss, separated by a phase of reaccretion of gas. Recently, Mashchenko et al. (2006) showed that the CDM cusp may be removed for halos in the to range by including stellar feedback into the simulations.
Clearly our starcounts are not directly measuring the dark matter profile; the stellar profile will have resulted from a complex interplay between baryons and the dark matter. With complementary kinematic measurements we could hope to use the Jeans equations to disentangle the two. However, though samples of several hundred stars are now being obtained in this galaxy Wilkinson et al. (2004), the HST photometry we have analysed above probes the interesting very inner parts of the system, where kinematics are as yet unavailable in sufficient numbers to allow a measure of the velocity dispersion, let alone its gradient. (The paucity of kinematic data is due to the low surface number density of bright giant stars needed for spectroscopic observations). Nevertheless, a clear flattening of the starcounts in the central regions of the galaxy away from an NFW model would have lent support to the presence of a core in the Draco dSph. Similarly, if the stars were found to follow an NFW profile into the very central regions it would call into question the possibility that the dark matter is cored in this dwarf galaxy. Unfortunately, the uncertainty in the position of the centroid of the galaxy does not allow us to draw a clear conclusion on this matter. If we do not include the innermost datum, the HST data follow an NFW model closely. Including the innermost datum forces us to accept a model with a flat inner profile like the exponential model shown in Fig. 14. Further observational work is required to measure accurately the position of the centre of the dwarf galaxy, and to improve on the statistics of the starcounts in the central few arcmins.
5.2 Absence of tidal effects
We have searched for tidal disturbances in the outer parts of the Draco dwarf spheroidal galaxy, using a stellar selection designed to optimise the signal to noise ratio in regions of low contrast. However, no evidence was found for the presence of an extra-tidal population, and we limit the fraction of such a component to less than 3% within the spatial extent of the MegaCam survey. This result, in conjunction with the finding that the surface brightness profile is consistent with that of an unperturbed dynamical system, suggests that Draco has led a quiet existence. This finding also lends support to models in which the stars are shielded by a dark matter mini-halo from the tidal forces of the Milky Way.
A similar conclusion about the non-detection of tidal streams in Draco has been made by Klessen et al. (2003), who studied the properties of blue horizontal branch stars in Draco with the SDSS dataset. They choose this stellar population because it is distributed all over Draco and the contamination by other astronomical objetcs is minimal. Their surface brightness profile of this stellar population does not possess any break, in agreement with our much deeper MegaCam results presented here. They completed this study with a numerical simulation of the dwarf galaxy, without a dark matter component and affected by the tidal effects of the Milky Way. By comparing the morphology of the simulation to the observations of the horizontal branch of Draco, they concluded that such a purely baryonic model is not compatible with reality. Their numerical simulations show a wide horizontal branch that is not observed for Draco. Thus Klessen et al. (2003) conclude that Draco is not a renmant of a tidally disrupted galaxy, but a dwarf galaxy with a substantial dark matter halo.
The fact that we find no tidal stream is not altogether unexpected. Mayer et al. (2002) conducted cosmological simulations to attempt to model the behaviour of dwarf galaxies with tidal debris, such as the Carina dSph. They found that to reproduce this type of galaxy, the dark matter halo must have a flat core or else it can possess a steep inner profile but with very low concentration (). If the concentration is higher, the orbits must be highly tangential to reproduce the observations. In the case of dwarf galaxies with high mass-to-light ratio, like Draco or Ursa Minor, they showed that it is difficult to create large tidal streams. Only small tidal features could be formed, but at low contrast.
6 Conclusions
We have presented a study of the structure of the Draco dwarf spheroidal galaxy, using photometric data obtained with the MegaCam camera on the CFHT telescope and the WFPC2 camera aboard the Hubble Space Telescope. These two datasets give us a new detailed view of this small galaxy.
Our deep photometry allows us to probe further than previous studies into the heart and the outskirts of the dwarf galaxy. We find that the central stellar density increases inwards from to . We find reasonable agreement if we choose to model the central HST stellar profile with a cusped model, parametrised as a projected NFW model of mass . Inside the profile appears to flatten out, or drop, though this may be an artefact of adopting an incorrect value for the position of the centre of the galaxy. However, we find that an exponential model gives an equally good description of the data.
The derived stellar profile is very smooth on large scales and does not appear to have a break, contrary to some previous claims. We also do not find evidence to support a claim that the stellar distribution is clumpy on small scales. We fit the stellar profile with various simple models, and improve slightly the model parameters compared to earlier studies. However, neither a King model, an exponential or a Plummer model give satisfactory fits to the observed profile over the entirety of the galaxy. The data depart slightly from each of these idealised models, and we are forced to reject them all at high confidence. However, this discrepancy is more a testament to the outstanding quality of the data. A more refined model will have to be developed to properly model these data; this is however beyond the scope of the present paper.
We also search for possible tidal substructures in the outskirts of the dwarf galaxy. No evidence for the presence of a tidal stream is found. Monte-Carlo tests show that if any such structure is present it cannot represent more than 3% of the main body of the system. Thus we find that Draco is an undisturbed system, most likely in dynamical equilibrium. The Draco dSph therefore continues to be an excellent target for studies of the dark matter on small scales.
Acknowledgments
We would like to thank the staff at the CFHT telescope for observing and processing the MegaCam data, and for their kind help at many stages during the progress of this work.
References
- Apparicio et al. (2001) Apparicio, A., Carrera, R., Martinez-Delgado, D. 2001, AJ 122, 2524
- Battaglia et al. (2006) Battaglia, G., et al. 2006, astro-ph/0608370
- Bellazzini et al. (2002) Bellazzini, M., Ferraro, F., Origlia, L., Pancino, E., Monaco, L. Oliva, E. 2002, AJ 124, 3222
- Colìn et al. (2004) Colìn, P., Klypin, A., Gottlöber, S. 2004, ApJ 612, 50
- de Blok et al. (2001) de Blok, W., McGaugh, S., Bosma, A. Rubin, V. 2001, ApJL 552, 23
- Ghigna et al. (2000) Ghigna, S., Moore, B., Governato, F., Lake, G., Quinn, T. Stadel, J. 2000, ApJ 544, 616
- Hargreaves et al. (1996) Hargreaves, J., Gilmore, G., Irwin, M., Carter, D. 1996, MNRAS 282, 305
- Hayashi et al. (2003) Hayashi, E., Navarro, J., Taylor, J., Stadel, J., Quinn, T. 2003, ApJ 584, 541
- Ibata et al. (1999) Ibata, R., Richer, H., Fahlman, G., Bolte, M., Bond, H., Hesser, J., Pryor, C., Stetson, P. 1999, ApJS 120, 265
- Irwin (1985) Irwin, M. 1985, MNRAS 214, 575
- Irwin & Hatzidimitriou (1995) Irwin, M., Hatzidimitriou, D. 1995, MNRAS 277, 1354
- Irwin (1996) Irwin, M. 1996, in 7th Canary Islands Winter School, Ed. Espinosa, J.
- Irwin & Lewis (2001) Irwin, M., Lewis, J. 2001, NewAR 45, 105
- King (1962) King, I. 1962, AJ 67, 471
- Klessen et al. (2003) Klessen, R., Grebel, E., Harbeck, D. 2003, ApJ 589, 798
- Kleyna et al. (2002) Kleyna, J., Wilkinson, M., Evans, N., Gilmore, G., Frayn, C. 2002, MNRAS 330, 792
- Kleyna et al. (2003) Kleyna, J., Wilkinson, M., Gilmore, G., Evans, N. 2003, ApJL 588, 21 MNRAS 330, 792
- Klypin et al. (1999) Klypin, A., Kravtsov, A., Valenzuela, O., Prada, F. 1999, ApJ 522, 8
- Kroupa (1997) Kroupa, P. 1997, NewA 2, 139
- Kuhn, Kocevski & Fleck (2004) Kuhn, J., Kocevski, D., Fleck, J.-J., 2004, ASPC, 327, 150 (astro-ph/0309207)
- Lokas & Mamon (2001) Lokas, E., Mamon, G. 2001, MNRAS 321, 155
- Lokas (2002) Lokas, E. 2002, MNRAS 333, 697
- Lynden-Bell (1976) Lynden-Bell, D. 1976, MNRAS 175, 695
- Macciò et al. (2006) Macciò, A., Dutton, A., van den Bosch, F., Moore, B., Potter, D., Stadel, J. 2006, astro-ph/0608157
- Mashchenko et al. (2006) Mashchenko, S., Couchman, H., Wadsley, J. 2006, Nature 442, 539
- Mateo (1998) Mateo, M. 1998, ARA&A 36, 435
- Mayer et al. (2002) Mayer, L., Moore, B., Quinn, T., Governato, F., Stadel, J. 2002, MNRAS 336, 119
- Moore et al. (1999) Moore B., Ghigna S., Governato F., Lake G., Quinn T., Stadel J. & Tozzi P., 1999a, ApJ 524, L19
- Moore et al. (1999) Moore B., Quinn T., Governato F., Stadel J. & Lake G., 1999b, MNRAS 310, 1147
- Navarro et al. (1997) Navarro, J., Frenk, C., White, S. 1997, ApJ 490, 493
- Naylor (1998) Naylor, T. 1998, MNRAS 296, 339
- Odenkirchen et al. (2001) Odenkirchen, M., et al. 2001, AJ 122, 2538
- Olszewski & Aaronson (1985) Olszewski, E., Aaronson, M. 1985, AJ 90, 2210
- Palma et al. (2003) Palma, C., Majewski, S., Siegel, M., Patterson, R., Ostheimer, J., Link, R., 2003 AJ 125, 1352
- Piatek et al. (2001) Piatek S., Pryor, C., Armandroff, T., Olszewski, E. 2002, AJ 123, 2511
- Read & Gilmore (2005) Read, J., Gilmore, G. 2005, MNRAS 356, 107
- Ricotti & Wilkinson (2004) Ricotti, M., Wilkinson, M. 2004, MNRAS 353, 867
- Rockosi et al. (2002) Rosckosi, C., et al. 2002, AJ 124, 349
- Sawa & Fujimoto (2004) Sawa, T., Fujimoto, M. 2005, PASJ 57, 429
- Sersic (1968) Sersic, J. 1968, Atlas des galaxies australes, Observatorio Astronomico, Cordoba
- Stetson (1987) Stetson, P., 1987, PASP 99, 191
- Stetson et al. (1990) Stetson, P., Davis, L., Crabtree, D. 1990, ASP Conf. Ser. 8: CCDs in astronomy, 289
- Tolstoy et al. (2004) Tolstoy, E., et al. 2004, ApJ 617, L122
- White & Rees (1978) White, S., Rees, M. 1978, MNRAS 183, 341
- Wilkinson et al. (2002) Wilkinson M. I., Kleyna J., Evans N. W. & Gilmore G. F., 2002, MNRAS 330, 778
- Wilkinson et al. (2004) Wilkinson M. I., Kleyna J., Evans N. W., Gilmore G. F., Irwin M. J. & Grebel E. K., 2004, ApJL 611, 21